
Analytical Studies Branch Research Paper Series
Automation and the Sexes: Is Job Transformation More Likely Among Women?

Archived Content
Information identified as archived is provided for reference, research or recordkeeping purposes. It is not subject to the Government of Canada Web Standards and has not been altered or updated since it was archived. Please "contact us" to request a format other than those available.
Skip to text
Text begins
Acknowledgements
This study is funded by the Department for Women and Gender Equality.
Abstract
Recent advances in artificial intelligence and machine-learning technologies have fuelled fears of potential job losses among some workers. While the net impact of new technology on total jobs can be negative, positive or neutral, some workers may be more affected than others depending on how easily robots and algorithms can replace them, or how easily their skills complement the new technology. In the case of women and men, it is not clear who is likely to be most affected. While women are more likely to hold a university degree (typically associated with non-routine work that is more difficult to automate), they are also less likely to specialize in technology (which may limit their work opportunities in an increasingly digital world), but more likely to work in certain occupations that may be susceptible to automation (e.g., retail sales or clerical work). The objective of this study is to estimate the automation risks faced by women and men based on an existing methodology applied to Canadian data (the Longitudinal and International Study of Adults, Wave 3). The approach also uses expert consultations in the automatability of occupations, taking into account a wide range of tasks typically associated with those occupations (thus allowing automation risks to vary within occupations). The study finds that 44.4% of women in the paid workforce faced a moderate to high risk of job transformation as a result of automation (50% probability or above), compared with only 34.8% of men. Overall, the gap remains about the same when comparing women and men with similar characteristics, such as age, education, industry and occupation. However, several characteristics are associated with greater automation risks faced by women relative to men, including being aged 55 or older, having no postsecondary qualifications or postsecondary qualifications other than a degree, having low levels of literacy or numeracy proficiency, being born in Canada, having a disability, being a part-time worker, not being in a union or covered by a collective bargaining agreement, and being employed in a small to mid-sized firm.
Executive summary
Recent advances in artificial intelligence and machine-learning technologies have fuelled fears of potential job losses among some workers. Variations in the extent to which different types of workers may be at risk of job transformation as a result of automation technology may depend on how easily robots and algorithms can replace the tasks these workers perform in their jobs, or how easily their skills complement the new technology. While previous research tends to estimate the overall risk of automation for workers and occupational differences, less attention has been given to the degree to which automation technology will affect different groups of workers based on sociodemographic characteristics.
In the case of women and men, it is not clear who is likely to be most affected. While women are more likely to hold a university degree, which is typically associated with non-routine work that is more difficult to automate, they are also less likely to specialize in technology, which may limit their work opportunities in an increasingly digital world. However, women are also more likely to work in certain occupations that may be more susceptible to automation, such as retail sales or office support occupations.
This study estimates the risk of job transformation as a result of automation technology faced by women and men. An existing methodology is applied to Canadian data from the Longitudinal and International Study of Adults (LISA), Wave 3. This methodology uses expert consultations in the automatability of occupations and accounts for a range of tasks typically associated with those occupations. The automation risks were further adjusted by accounting for differences in 25 tasks that workers performed in their jobs (e.g., sharing information, selling product and services, advising people, performing physical work for a long period of time, using skill or accuracy with hands or fingers, reading directions and instructions, and using a programming language).
The study finds that 44.4% of women in the paid workforce faced a moderate to high risk of automation-related job transformation (50% probability or above), compared with only 34.8% of men. Overall, the gap remains about the same when comparing women and men with similar characteristics, such as age, education, industry and occupation.
Several characteristics are associated with greater automation risks faced by women relative to men, including being aged 55 or older, having no postsecondary qualifications or postsecondary qualifications other than a degree, having low levels of literacy or numeracy proficiency, having a disability, being a part-time worker, not being in a union or covered by a collective bargaining agreement, and being employed in a small to mid-sized firm. Differences in immigration status and the presence of preschool-aged or school-aged children were generally small between women and men.
Gender differences in the risk of job transformation as a result of automation technology may be attributable to different tasks performed within occupations that were not accounted for by the LISA task variables, such as repetitiveness of job tasks, or differences in the extent to which women and men engage in upskilling (i.e., learning new skills) while at work. Therefore, future research that examines more within-occupation differences between women’s and men’s job tasks and gender differences in upskilling behaviour would provide greater clarity on the differences in the risk of job transformation faced by women and men.
Introduction
In industrialized countries, the production of goods and services is highly dependent on technology and the degree to which activities or tasks are automated. Technological improvements have been a long-standing feature of advanced economies. Traditionally, such improvements have been gradual and have not been associated with major job disruptions. While some human jobs (e.g., bookkeeper) have been phased out to some extent as a result of technological improvements, others (e.g., Internet technology specialist) have been created to complement the new technology (e.g., Autor, Levy and Murnane 2003; Graetz and Michaels 2018).
More recently, advances in artificial intelligence and machine learning have led to technological developments in the production of goods and services traditionally in the domain of humans. For example, driverless vehicles have been employed in certain settings, as have robot writers. Robot diagnosticians have also been tested on humans. Although the commercial adoption of the new technologies takes time, their development has already led to concerns about the possibility of job disruption as the list of tasks that can be done only by humans grows smaller. Recent studies examining the risk of automation have concluded that only about 1 in 10 workers faces a high risk of automation-related job transformation in the coming years, while slightly more than one-quarter face a moderate risk (e.g., Frenette and Frank 2020). However, the adoption of new automation technology could accelerate as a result of the COVID-19 pandemic, as firms try to find ways to reduce the number of humans in the workplace.
Regardless of how quickly technological adoption unfolds, some workers may be more affected than others based on the degree of complementarity between their skills and the work that robots and computer algorithms can do. For example, women have become more likely to obtain a university degree than men in recent decades. This could favour women in the context of widespread automation, as highly educated workers may be better positioned to work alongside automated technology by focusing on more advanced processes not yet within the toolbox of robots, rather than performing physical or routine tasks. On the other hand, women with any postsecondary qualifications are less likely to select technology-related disciplines such as engineering, computer science or physics. This may limit their employment opportunities in an increasingly digital workforce. Women are also more likely to work in certain occupations associated with routine work, such as retail sales or office clerk positions.
For these reasons and many more, it is not clear a priori whether women face higher or lower automation-related risks than men, and the significance of any such difference. The purpose of this study is to provide insight on this issue by estimating the risks of automation-related job transformation faced by women and men. Furthermore, this study will attempt to explain the differences in the risks faced by women and men based on their observed individual and job characteristics. To do this, the study adopts an existing occupation and task-based approach to estimating automation‑related risks and applies it to Canadian data (the Longitudinal and International Study of Adults [LISA], Wave 3).
While several studies have examined the extent to which workers are at risk for job loss overall (e.g., Frey and Osborne 2013; Arntz, Gregory and Zierahn 2016), less attention has been given to potential gender differences (Hegewisch, Childers and Hartmann 2019; Peetz and Murray 2019).
It is important to examine the possibility of job transformation from a genderNote perspective for several reasons. First, the fact that men and women work largely in different occupations may result not only in different job loss risks, but also in different risks of job transformation for those who keep their jobs. For example, a female-dominated occupation in the health care field may be at a low risk for being eliminated because of automation, but might face substantial changes in the job tasks required if automation technology is introduced to assume some tasks (Hegewisch, Childers and Hartmann 2019). Therefore, knowledge of the implications of automation technology for both women and men can inform discussions on individual, institutional and public planning.
Moreover, job transformation resulting from technological advancements may increase workers’ need to upskill and retrain for changes in skill demand. This increased need for training may result in greater demand for certain types of postsecondary training and educational programs, as well as on-the-job training (Hegewisch, Childers and Hartmann 2019). Increased training needs will likely have particular implications for parents with respect to child care needs. This may affect women more if they are more highly impacted by automation technology than men, as women tend to take on a greater share of child care responsibilities within the household (Craig 2006; Guppy, Sakumoto and Wilkes 2019). Therefore, technology may create more demand for child care among affected women who seek retraining opportunities than among their male counterparts.
The next section reviews the related literature, followed by a description of the methods used and the main findings. This paper concludes by summarizing the key results and discussing useful next steps in research.
Literature review
Advances in automation technology have been at the forefront of recent discussions about the future of work. Generally, the literature focuses on the implications of this technology on workers’ jobs. Although much of the attention has focused on the extent to which jobs will be eliminated by automation technology (e.g., Frey and Osborne 2013), many researchers note that these technological developments will also create new job tasks and occupations (e.g., Acemoglu and Restrepo 2019; Hegewish, Childers and Hartmann 2019; Muro, Maxim and Whiton 2019). Some studies have employed a more nuanced task-based approach to argue that automation technology is more likely to change the tasks performed within most workers’ jobs, rather than replacing their jobs entirely (e.g., Acemoglu and Restrepo 2019; Acemoglu and Autor 2010; Autor, Levy and Murnane 2003).
Studies that apply the task-based approach have found that routine tasks are most likely to be replaced by automation technology, resulting in an increased demand for workers who can perform non-routine tasks that complement automated tasks (Acemoglu and Autor 2010). Furthermore, jobs that require more abstract and non-routine tasks, such as problem solving, persuasion or caring for others, may be less susceptible to automation than those that consist primarily of routine manual tasks that can be automated easily, such as bookkeeping, clerical work and repetitive tasks in production occupations (Acemoglu and Autor 2010; Muro, Maxim and Whiton 2019).
Studies that have examined how the potential for automation of tasks may affect men and women differently have produced varied results. Some research has found that women are at a higher risk of being affected than men (e.g., Roberts et al. 2019; World Economic Forum 2018). This disadvantage has been attributed to a variety of factors, such as women’s higher employment in part-time jobs, particularly in the service industry, and their underrepresentation in higher-paying jobs that are expected to expand in the future, such as occupations in programming and software development (Dellot 2018; Roberts et al. 2019; World Economic Forum 2018).
On the other hand, some research has found that differences in the skills that men and women use in their jobs may give women an advantage. For example, while a large proportion of men are employed in jobs that require specialized technical skills—often involving physical or manual tasks—women’s jobs tend to require more general and social skills (Madgavkar et al. 2019; RBC 2019). Therefore, while the jobs in which women are currently concentrated might be at a higher risk for automation (e.g., clerical and administrative occupations), women’s skills may be more transferable to emerging jobs in the digital economy (RBC 2019).
Research examining the relationship between automation and gender often points to occupational segregation between men and women as a driving factor in the differences in their risks of job transformation (e.g., Madgavkar et al. 2019). Occupational segregation by sex has resulted in many occupations being either male dominated (e.g., maintenance and equipment operation trades; industrial, electrical and construction trades) or female dominated (e.g., sales support occupations, professional occupations in health). This could result in differences in the extent to which men and women are susceptible to job loss as a result of automation technology. For example, researchers who employed the task-based approach found that, on average, women worked in jobs with a higher intensity of routine cognitive tasks than men, while men’s jobs were more likely to require routine manual tasks than women’s jobs.Note
Decreases were observed in the share of workers employed in both of these occupational task groups over time (i.e., occupations with a high intensity of routine cognitive tasks and routine manual tasks). This indicates that both men and women have been moving out of occupations with a high intensity of routine tasks and into both high-skilled and low-skilled occupations with a higher intensity of non-routine tasks (Acemoglu and Autor 2010; Autor, Levy and Murnane 2003; Levy and Murnane 2013; Spitz-Oener 2006).Note
However, despite similar trends observed across occupational task groups, some literature points to potential differences in how automation technology will affect women and men. Much of this literature points to the fact that automation primarily replaces tasks associated with physical and manual jobs, which tend to be in male-dominated occupations in fields such as production, transportation and construction (Muro, Maxim and Whiton 2019). Conversely, automation technology is less likely to be applied to interpersonal tasks (e.g., caregiving), which are largely associated with female-dominated occupations in fields such as health care, personal services and education (Muro, Maxim and Whiton 2019; Piasna and Drahokoupil 2017). In addition, because women are more highly educated than men on average, they may be at a lower risk of automation-related job transformation (Frenette and Frank 2020; Peetz and Murray 2019).
Others have found that women are more likely than men to work in both high-riskNote and low-riskNote occupations (Hegewisch, Childers and Hartmann 2019; Peetz and Murray 2019). This has led some to conclude that sex is not a major determinant of individuals’ susceptibility to job loss as a result of automation technology. Instead, a worker’s risk of job transformation can be determined primarily by the specific occupation in which they are employed (Peetz and Murray 2019).
Nevertheless, there is also evidence of gender differences within occupations. Piasna and Drahokoupil (2017) found that the tasks men and women performed within the same occupation differed. Across most occupational groups, women in the European Union were more likely than their male counterparts to report performing repetitive and routine tasks in their job, and were less likely to report performing complex tasks. These gender gaps were particularly pronounced for craft and trades workers, as well as for machine operators and assemblers. However, there were also notable gaps among managers, technicians and associate professionals. These results indicate that women may be more at risk for automation-related job transformation than men.
Technological advancements could positively affect women’s employment if they result in increased employment in female-dominated occupations (Goldin 1987). However, greater demand for workers could increase the status and wages and—subsequently—the desirability of these occupations. As a result, men who have lost their jobs because of automation technology may move into these occupations, displacing female workers (Peetz and Murray 2019).
Historically, the occupation of computer operator illustrates how a change in the perceived status of an occupation can result in it shifting from being a female-dominated occupation to being a male-dominated one. Because this occupation did not have a “gender precedent” when it was first introduced, it was associated with female-dominated clerical work because it involved the transfer of information (Light 1999). However, as the power of computers became more apparent over time, women were largely phased out of these jobs around the 1970s (Hicks 2017).
Previous research indicates that the changes in an occupation’s sex composition affect the wages and value associated with that occupation (Levanon, England and Allison 2009). This is illustrated by the change in computer-related occupations from female-dominated to male‑dominated, which resulted in an increase in pay and status for workers in these occupations (Hicks 2017; Peetz and Murray 2019). Generally, the higher the proportion of women in an occupation, the more the occupation is devalued (Levanon, England and Allison 2009). Therefore, if female-dominated occupations are less likely to be automated, increases in the number of men entering these occupations could raise their status, resulting in higher wages. However, if female-dominated occupations are at a higher risk of job transformation and there is growth in male-dominated occupations in the future, women may enter these occupations in higher numbers.
The shift in the sex composition of computer operators also has implications for women in the current context, as computer- and technology-related occupations are now identified as one of the occupations that are least at risk for automation-related job transformation. Furthermore, the skills associated with these jobs are in greater demand than social and interpersonal skills (Peetz and Murray 2019; Roberts et al. 2019).
Studies that estimate automation risks for women and men use different measures that produce varying results. For example, Madgavkar et al. (2019) examined the risk of job displacement as a result of automation technology across 10 countries, including Canada. Their methodology accounted for job loss by breaking occupations down into different activities (or job tasks), which were then categorized into broader groups of capabilities. They then ran a model that accounted for factors that affect the pace and extent of automation.Note Each occupation was given a percentage for automation adoption, with the assumption that an occupation is only automatable when all of its activities are automatable. Madgavkar et al. (2019) found that, overall, women were generally at a lower risk of job displacement than men, although the difference was small. However, there were variations across different countries, as each had a different rate of automation technology adoption. The Canadian estimates indicated that 24% of women’s jobs and 28% of men’s jobs were at risk for job displacement by automation technology.
Roberts et al. (2019) used an approach similar to the one used in this study to estimate the proportion of women and men in the United Kingdom who were employed in jobs with a high potential for automation. Specifically, they integrated the Frey and Osborne (2013) approach with the Arntz, Gregory and Zierahn (2016) approach through the use of data from the Programme for the International Assessment of Adult Competencies (PIAAC) and the United Kingdom’s Labour Force Survey. Roberts et al. (2019) found that women in the United Kingdom were twice as likely as men to be in the group identified as being at a high risk for potential automation (9% of women vs. 4% of men). Part of this difference was attributed to a higher likelihood of women to be employed in part-time jobs, which tend to have a higher potential for automation.
Methods
The methods used in this study are described thoroughly by Frenette and Frank (2020). Only a brief overview is provided below.
Frey and Osborne (2013) pioneered the literature on automation risks, and their work served as a starting point for the current study. They assigned a probability of facing automation over the next 10 or 20 years to the United States’ 2010 Standard Occupational Classification (SOC) codes. The assignment of risk was based on input from artificial intelligence experts who were presented with a list of job descriptions from 70 occupations in the Occupational Information Network (O*NET) and were asked “Can the tasks of this job be sufficiently specified, conditional on the availability of big data, to be performed by state of the art computer-controlled equipment?” This information was then used to model the probability of automation for all occupations in the 2010 SOC. The model also accounted for nine task variables that capture three “engineering bottlenecks to computerisation”: perception and manipulation, creativity, and social intelligence. This approach was critiqued by Arntz, Gregory and Zierahn (2016) on the grounds that it did not sufficiently distinguish occupations by job tasks, which is important because some occupations may comprise certain tasks that are fully automatable, while other components of the job may not be automatable at all. To account for this, Arntz, Gregory and Zierahn (2016) further adjusted Frey and Osborne’s (2013) probabilities based on 25 tasks, as well as various individual and workplace characteristics available in the 2012 PIAAC (e.g. age, education, industry, and occupation). Therefore, these probabilities may vary not only by occupation, but also within occupations, to the extent that workers employed in the same occupation perform different observed tasks and possess different individual and workplace characteristics (which could lead to workers performing different unobserved tasks).
The current study more closely follows Arntz, Gregory and Zierahn (2016) by also adjusting for an extensive list of tasks.
First, the Frey and Osborne automation risk probabilities were assigned to workers in the 2016 LISA based on their occupation. Because the Frey and Osborne data are based on the 2010 SOC and LISA is based on the 2011 National Occupational Classification (NOC), a concordance file combining the two classification systems was used.Note
The automation risks assigned to each NOC code were then transferred to the 2016 LISA data file. These automation risks were further adjusted with the 25 task variables in LISA, which were virtually identical to the ones used by Arntz, Gregory and Zierahn (2016). Specifically, they include measures of cooperating or collaborating, sharing information, instructing, making speeches, selling products or services, advising people, planning and organizing own activities, planning and organizing activities of others, planning and organizing own time, persuading or influencing people, negotiating with people, solving problems of less than 5 minutes, solving problems of less than 30 minutes, performing physical work for a long period of time, using skill or accuracy with hands or fingers, reading directions or instructions, reading journals or scholarly publications, reading books, reading manuals or reference materials, writing articles for newspapers or newsletters, filling in forms, using advanced mathematics, using the Internet for work-related issues, using a programming language, and participating in real-time discussions on the Internet.Note
As noted by Frenette and Frank (2020), the automation risk probabilities were adjusted only for the 25 tasks and not by individual and workplace characteristics. Adjusting for tasks provides a conceptually clear measure of automation risk that is based solely on technological feasibility. Following these adjustments, the automation risks were estimated for women and men separately.Note The sample was limited to paid workers aged 18 and older with valid responses for all of the variables used in the analysis (described in the results section). This resulted in a sample of 2,267 workers.Note
Results
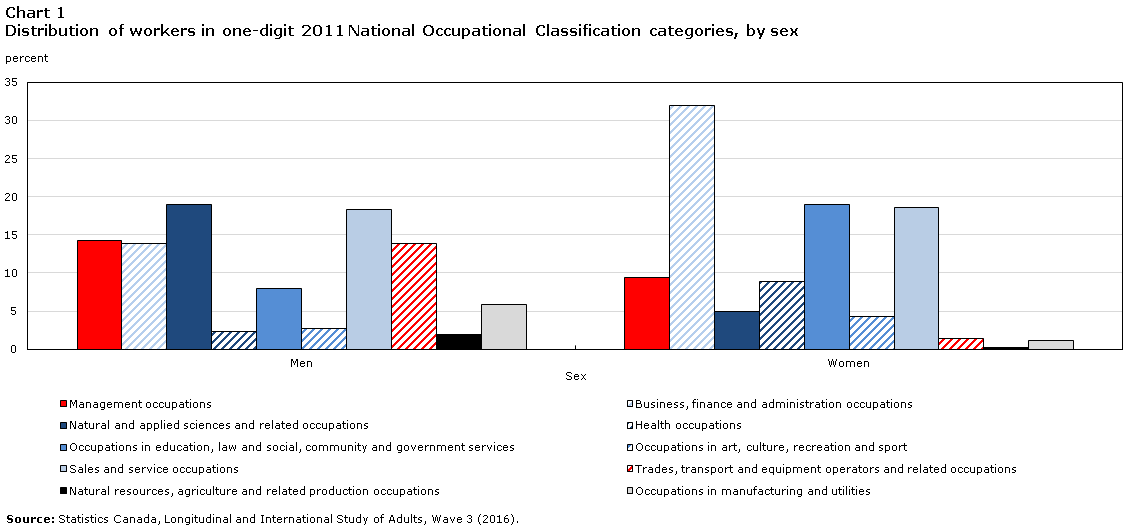
The automation risk index is determined entirely by the specific job held by the worker, which is defined as the occupation type and job tasks involved. As a result, gender differences in the risk of automation may reflect, in part, gender differences in occupations, which are shown in Chart 1.
Data table for Chart 1
| Men | Women | |
|---|---|---|
| percent | ||
| Management occupations | 14.3 | 9.3 |
| Business, finance and administration occupations | 13.9 | 32.0 |
| Natural and applied sciences and related occupations | 19.0 | 5.0 |
| Health occupations | 2.4 | 8.9 |
| Occupations in education, law and social, community and government services | 7.9 | 19.0 |
| Occupations in art, culture, recreation and sport | 2.7 | 4.3 |
| Sales and service occupations | 18.3 | 18.6 |
| Trades, transport and equipment operators and related occupations | 13.8 | 1.5 |
| Natural resources, agriculture and related production occupations | 1.9 | 0.2 |
| Occupations in manufacturing and utilities | 5.8 | 1.2 |
| Source: Statistics Canada, Longitudinal and International Study of Adults, Wave 3 (2016). | ||
In general, the occupational distributions of women and men were very different. In fact, it is easier to identify the one major occupational group with similar shares of both sexes—sales and service occupations. Men were more likely to hold jobs classified as trades, transport and equipment operators and related occupations (13.8% vs. 1.5%), as well as natural and applied sciences and related occupations (19.0% vs. 5.0%). In contrast, almost one-third (32.0%) of women worked in business, finance and administration occupations, compared with only 13.9% of men. Similarly, 19.0% of women were employed in occupations in education, law and social, community and government services, compared with only 7.9% of men.
Chart 2 shows the distribution of the probability of facing automation-related job transformation by sex. While women and men were equally likely to face a high risk of automation-related job transformation (typically denoted as 70% or above in the literature), women were far more likely to face a moderate risk (50% to 70%). More specifically, 33.9% of women faced a moderate risk, compared with only 24.0% of men. The chart also shows that women were considerably less likely than men to face a low risk of automation (below 50%)—only 55.6% of women occupied jobs at low risk of automation-related transformation, compared with 65.2% of men.

Data table for Chart 2
| Predicted risk of automation-related job transformation | Men | Women |
|---|---|---|
| percent | ||
| Less than 10% | 2.6 | 1.1 |
| 10% to less than 20% | 13.3 | 8.6 |
| 20% to less than 30% | 17.5 | 13.4 |
| 30% to less than 40% | 17.9 | 17.2 |
| 40% to less than 50% | 14.0 | 15.3 |
| 50% to less than 60% | 15.6 | 19.6 |
| 60% to less than 70% | 8.5 | 14.2 |
| 70% to less than 80% | 8.3 | 7.9 |
| 80% to less than 90% | 2.5 | 2.7 |
| 90% or more | 0 | 0 |
| Source: Statistics Canada, Longitudinal and International Study of Adults, Wave 3 (2016). | ||
Since the dividing line between women and men lies around the 50% risk cut-off, the remainder of this study will focus on the probability of facing a 50% or greater probability of automation-related job transformation. Overall, 44.4% of women were in this category, compared with only 34.8% of men (a difference of 9.7 percentage points).
Why were women more likely to face at least a moderate risk of automation than men? The answer is not clear a priori, as women and men had very different individual and workplace characteristics, as shown in Table 1. These characteristics could be related to the risk of automation. Consequently, a multivariate analysis will be done in an attempt to isolate the role of gender in the risk of automation. To provide some context, these differences in characteristics are described below.
Women were somewhat more likely to hold a degree than men. In particular, 25.5% of women and 21.1% of men held a bachelor’s degree. Women were also slightly more likely to hold a master’s degree than men (9.4% vs. 8.8%), but there were virtually no differences in the share of women and men holding a doctoral or first professional degree. Despite lower rates of degree holding among men, their mean literacy and numeracy scores were slightly higher than those of women.Note
It is important to note that the education and literacy and numeracy results are for the population of women and men aged 18 and older and employed in the paid workforce. In recent years, approximately three in five university students have been female. As more and more of these young women enter the workforce, the gap in educational attainment between women and men will likely increase further. Moreover, the gender gap in literacy and numeracy test scores may decline over time, as these measures are positively correlated with educational attainment.
Gender differences in immigration status and the presence of preschool-aged or school-aged children were generally quite small. However, women in the sample were less likely to report being married (62.0%) than men (66.0%).
More significant differences were observed for several other variables, including disability status. Women were almost twice as likely as men to report having a disability (18.4% vs. 9.9%).Note Women were also more than three times as likely as men to work part time (18.0% vs. 5.0%). However, about one-third (33.1%) of women in the paid workforce were in a union or covered by a collective bargaining agreement, compared with only about one-quarter (25.3%) of their male counterparts.
While women were slightly more likely to be employed in a small to medium-sized firm (50 employees or less), they were typically in very different industries than men. For example, men were about three times as likely as women to work in manufacturing (14.3% vs. 5.4%) or in mining, quarrying, and oil and gas extraction; utilities; and construction (9.9% vs. 3.1%). However, 32.2% of women were employed in educational services, and health care and social assistance, compared with only 9.0% of men. Women were also more likely than men to be employed in arts, entertainment and recreation, and accommodation and food services (6.9% vs. 2.8%).
These differences may have different impacts on the gender gap in automation risk. For example, Frenette and Frank (2020) found that workers with a postsecondary education typically faced a lower risk of automation. This fact should favour women, as they were more likely to hold a degree than men. However, women were also more likely to be employed part time, and Frenette and Frank (2020) found that part-time workers faced higher risks of automation.
To estimate the joint role of the gender differences reported in Table 1 on the gender differences in the probability of facing at least a moderate risk of automation, a multivariate framework was required. Table 2 presents the results of regressing a binary variable indicating a moderate to high risk of automation on a female indicator variable, as well as all of the variables from the analysis in Table 1. The key coefficient of interest is the one associated with the female variable, which indicates the gender difference in the probability of facing a moderate to high risk of automation after accounting for gender differences in all other independent variables, such as age and education.Note
The results indicate that, after accounting for the gender differences reported in the individual and workplace characteristics in Table 1, women still faced a considerably higher probability of a moderate to high automation risk. In fact, the difference was 11.4 percentage points (statistically significant at 0.1%), which was slightly larger than the unadjusted difference (9.7 percentage points). This means that the overall gender difference in automation risk cannot be explained by the observed gender differences in individual and workplace characteristics. Other factors may explain this gap, but these cannot be identified in the data.Note
However, certain groups of women faced a risk that was significantly higher than that of their male counterparts. Table 3 shows the percentage of women and men who faced a high risk of automation, by different socioeconomic group, both in the raw (unadjusted) data as well as after adjusting for the full set of covariates used in the model associated with Table 2 (through interaction terms). Although the unadjusted results could be of interest to many, they may be explained—to some extent—by differences in other socioeconomic characteristics. Therefore, the discussion will focus exclusively on the adjusted differences.
The gender differences in the probability of facing a moderate to high risk of automation were broad based. Statistically significant differences were registered for some categories of all characteristics examined.
For example, women aged 55 and older were 20.5 percentage points more likely to face a high risk of job transformation as a result of automation than their male counterparts. In contrast, women and men aged 18 to 24 faced about the same risk.
Other groups of women who faced a particularly high risk compared with their male counterparts include those who have no postsecondary qualifications (12.3 percentage points more likely than comparable men) or have a postsecondary education with no degree (13.1 percentage point difference), have a literacy or numeracy proficiency below Level 3 (11.6 and 16.8 percentage points, respectively), were born in Canada (12.9 percentage points), have a disability (18.2 percentage points), work part time (17.2 percentage points), are not in a union or covered by a collective bargaining agreement (13.7 percentage points), and are employed in small to mid-sized firms (with no more than 10 employees: 19.2 percentage points; or between 51 and 250 employees: 20.6 percentage points).Note
Conclusion
Fears of widespread job losses have arisen in response to recent, rapid advances in artificial intelligence. The COVID-19 pandemic could accelerate technological adoption, as firms try to find ways to reduce the number of humans in the workplace. While technological improvements may create considerable job opportunities for workers with complementary skills, some workers may be left behind. The objective of this study was to document and attempt to explain gender differences in the risk of job transformation as a result of automation.
This study found that 44.4% of women in the paid workforce faced a moderate to high risk of automation-related job transformation (50% probability or above), compared with only 34.8% of men. Overall, the gap remained about the same when comparing women and men with similar characteristics, such as age, education, industry and occupation. However, several characteristics were associated with greater automation risks faced by women relative to men, including being aged 55 or older, having no postsecondary qualifications or postsecondary qualifications other than a degree, having low levels of literacy or numeracy proficiency, being born in Canada, having a disability, being a part-time worker, not being in a union or covered by a collective bargaining agreement, and being employed in a small to mid-sized firm.
Some of the gender differences in automation risk may be attributable to different tasks performed within occupations, which were not accounted for by the LISA task variables. In particular, none of the task variables explicitly measured the extent to which individuals performed repetitive tasks in their jobs. Previous literature has shown that women were more likely to report performing repetitive tasks than men in the same occupation, which could put them at greater risk of automation-related job transformation (Piasna and Drahokoupil 2017).
Furthermore, gender differences in the extent to which workers engage in upskilling while at work have been found. Piasna and Drahokoupil (2017) found that women were less likely than men in the same occupation to upgrade their skills through on-the-job training, which could also contribute to women’s higher risk of job transformation. However, these differences were lower than within-occupation gender differences in the intensity of performing routine tasks, leading Piasna and Drahokoupil (2017) to conclude that women’s higher vulnerability to job transformation was largely driven by gender differences in the distribution of job tasks.
Therefore, the estimation of men’s and women’s risk of job transformation likely requires the consideration of additional factors. Future research might benefit from examining more within‑occupation differences in men’s and women’s job tasks, such as repetitive tasks, as well as differences in their training or upskilling behaviour. This may require new data, particularly more detailed task information.
Recent research has also examined gender differences in the perceptions of automation risk (Baird et al. 2018; Dodel and Mesch 2020). In Australia, similar proportions of men and women believed their job would not exist in 20 years because of automation (about one in five). However, men were more likely than women to be concerned about potentially losing their jobs to automation technology (Baird et al. 2018). Research from the United States suggests that there are no gender differences in how workers perceive the impact automation will have on their jobs (Dodel and Mesch 2020). In Canada, Loewen and Stevens (2019) also examined expectations and concerns regarding automation. However, results were not available by subgroup. Understanding whether expectations about automation align with one’s risk is important for personal and public planning purposes.
Tables
| Men | Women | |
|---|---|---|
| percent | ||
| Age (years) | ||
| 18 to 24 | 5.5 | 6.5 |
| 25 to 34 | 22.7 | 19.9 |
| 35 to 54 | 53.0 | 53.3 |
| 55 and older | 18.9 | 20.3 |
| Highest level of education completed | ||
| Less than high school diploma | 2.7 | 3.0 |
| High school diploma | 18.5 | 14.8 |
| Trades certificate or apprenticeship | 12.8 | 5.5 |
| College certificate or diploma | 25.7 | 27.9 |
| University transfer program | 0.1 | 0.3 |
| University certificate below a bachelor's degree | 4.5 | 4.1 |
| Bachelor's degree | 21.1 | 25.5 |
| University certificate above a bachelor's degree | 2.6 | 6.3 |
| First professional degree | 2.1 | 2.2 |
| Master's degree | 8.8 | 9.4 |
| Doctoral degree | 1.2 | 1.0 |
| mean | ||
| Literacy | 296.9 | 289.8 |
| Numeracy | 296.2 | 275.6 |
| percent | ||
| Immigration status | ||
| Born in Canada | 78.8 | 79.9 |
| Long-term immigrant (10 years or more) | 14.8 | 12.6 |
| Recent immigrant (less than 10 years) | 6.4 | 7.4 |
| Married | 66.0 | 62.0 |
| mean | ||
| Number of preschool-aged children | 0.2 | 0.2 |
| Number of school-aged children | 0.5 | 0.5 |
| percent | ||
| Have a disability | 9.9 | 18.4 |
| Work part time | 5.0 | 18.0 |
| In a union or covered by a collective bargaining agreement | 25.3 | 33.1 |
| Firm size (number of employees) | ||
| 1 to 10 | 19.3 | 21.0 |
| 11 to 50 | 29.6 | 32.3 |
| 51 to 250 | 25.5 | 25.3 |
| 251 to 1,000 | 15.1 | 12.3 |
| More than 1,000 | 10.5 | 9.1 |
| Industry (one-digit NAICS 2012 code) | ||
| Agriculture, forestry, fishing and hunting (1) | 1.3 | 0.3 |
| Mining, quarrying, and oil and gas extraction; utilities; and construction (2) | 9.9 | 3.1 |
| Manufacturing (3) | 14.3 | 5.4 |
| Wholesale trade, retail trade, and transportation and warehousing (4) | 22.6 | 16.0 |
| Information and cultural industries; finance and insurance; real estate and rental and leasing; professional, scientific and technical services; management of companies and enterprises; and administrative and support, waste management and remediation services (5) | 25.7 | 21.7 |
| Educational services, and health care and social assistance (6) | 9.0 | 32.2 |
| Arts, entertainment and recreation, and accommodation and food services (7) | 2.8 | 6.9 |
| Other services (except public administration) (8) | 4.0 | 4.2 |
| Public administration (9) | 10.3 | 10.3 |
| number | ||
| Sample size | 1,017 | 1,250 |
|
Note: NAICS stands for North American Industry Classification System. Source: Statistics Canada, Longitudinal and International Study of Adults, Wave 3 (2016). |
||
| Coefficient | Bootstrap standard error | |
|---|---|---|
| Female | 0.114Note *** | 0.024 |
| Age (years) | ||
| 18 to 24 (omitted) | Table 2 Note ‡ | Table 2 Note ‡ |
| 25 to 34 | -0.066 | 0.069 |
| 35 to 54 | -0.056 | 0.063 |
| 55 and older | -0.035 | 0.066 |
| Highest level of education completed | ||
| Less than high school diploma | 0.028 | 0.075 |
| High school diploma (omitted) | Table 2 Note ‡ | Table 2 Note ‡ |
| Trades certificate or apprenticeship | -0.014 | 0.054 |
| College certificate or diploma | -0.162Note *** | 0.041 |
| University transfer program | -0.308 | 0.300 |
| University certificate below a bachelor's degree | -0.241Note *** | 0.066 |
| Bachelor's degree | -0.313Note *** | 0.040 |
| University certificate above a bachelor's degree | -0.307Note *** | 0.066 |
| First professional degree | -0.369Note *** | 0.067 |
| Master's degree | -0.380Note *** | 0.051 |
| Doctoral degree | -0.307Note *** | 0.082 |
| Literacy | 0.006 | 0.005 |
| Literacy squared | 0.000 | 0.000 |
| Numeracy | -0.003 | 0.004 |
| Numeracy squared | 0.000 | 0.000 |
| Immigration status | ||
| Born in Canada (omitted) | Table 2 Note ‡ | Table 2 Note ‡ |
| Long-term immigrant (10 years or more) | 0.089Note * | 0.040 |
| Recent immigrant (less than 10 years) | 0.112Note * | 0.055 |
| Married | -0.058Note * | 0.028 |
| Number of preschool-aged children | -0.003 | 0.021 |
| Number of school-aged children | -0.022 | 0.014 |
| Have a disability | -0.030 | 0.032 |
| Work part time | 0.214Note *** | 0.042 |
| In a union or covered by a collective bargaining agreement | 0.096Note *** | 0.029 |
| Firm size (number of employees) | ||
| 1 to 10 (omitted) | Table 2 Note ‡ | Table 2 Note ‡ |
| 11 to 50 | 0.003 | 0.037 |
| 51 to 250 | -0.040 | 0.037 |
| 251 to 1,000 | -0.055 | 0.040 |
| More than 1,000 | -0.081Table 2 Note † | 0.044 |
| Intercept | 0.604 | 0.503 |
Notes: The regression is a linear probability model (ordinary least squares) and also includes one-digit NAICS 2012 fixed effects (results were similar with two-digit codes). NAICS stands for North American Industry Classification System; R2 = 0.247. Sample size = 2,267. Source: Statistics Canada, Longitudinal and International Study of Adults, Wave 3 (2016). |
||
| Men | Women | Women – Men | Women – Men | |||||
|---|---|---|---|---|---|---|---|---|
| percentage | bootstrap standard error | percentage | bootstrap standard error | percentage-point difference | bootstrap standard error | adjusted percentage-point difference | bootstrap standard error | |
| Overall | 34.8 | 2.0 | 44.4 | 1.8 | 9.7Note *** | 2.7 | 11.4Note *** | 2.4 |
| Age (years) | ||||||||
| 18 to 24 | 62.2 | 8.0 | 67.0 | 6.1 | 4.7 | 10.0 | 1.3 | 10.0 |
| 25 to 34 | 35.0 | 4.9 | 38.4 | 4.8 | 3.4 | 6.9 | 11.0Note * | 5.6 |
| 35 to 54 | 32.1 | 2.8 | 38.5 | 2.3 | 6.4Table 3 Note † | 3.6 | 9.4Note ** | 3.3 |
| 55 and older | 33.9 | 4.0 | 58.6 | 3.6 | 24.7Note *** | 5.4 | 20.5Note *** | 4.8 |
| Highest level of education completed | ||||||||
| No postsecondary qualifications | 60.0 | 4.5 | 75.8 | 3.4 | 15.8Note ** | 5.6 | 12.3Note * | 5.3 |
| Postsecondary, no degree | 37.0 | 3.0 | 50.4 | 2.6 | 13.4Note *** | 4.0 | 13.1Note *** | 3.9 |
| Postsecondary degree | 15.6 | 2.3 | 22.8 | 2.8 | 7.2Note * | 3.7 | 4.5 | 3.5 |
| Literacy proficiency | ||||||||
| Below Level 3 | 50.6 | 3.5 | 57.8 | 3.2 | 7.2 | 4.7 | 11.6Note ** | 4.4 |
| Level 3 or above | 28.8 | 2.4 | 37.8 | 2.1 | 9.0Note ** | 3.2 | 10.3Note *** | 2.9 |
| Numeracy proficiency | ||||||||
| Below Level 3 | 51.2 | 3.6 | 58.2 | 2.6 | 7.0 | 4.5 | 16.8Note *** | 4.3 |
| Level 3 or above | 28.9 | 2.3 | 32.5 | 2.3 | 3.6 | 3.3 | 8.8Note ** | 2.7 |
| Immigration status | ||||||||
| Born in Canada | 33.0 | 2.1 | 44.1 | 1.9 | 11.2Note *** | 2.8 | 12.9Note *** | 2.7 |
| Immigrant | 41.4 | 5.3 | 45.7 | 4.3 | 4.3 | 6.8 | 5.7 | 5.7 |
| Disability | ||||||||
| No | 35.1 | 2.1 | 43.5 | 1.9 | 8.4Note ** | 2.8 | 10.4Note *** | 2.6 |
| Yes | 32.0 | 5.3 | 48.6 | 4.9 | 16.6Note * | 7.2 | 18.2Note ** | 6.0 |
| Work hours | ||||||||
| Full time | 33.4 | 2.0 | 39.1 | 1.9 | 5.7Note * | 2.7 | 10.9Note *** | 2.5 |
| Part time | 59.8 | 8.9 | 68.5 | 3.9 | 8.7 | 9.7 | 17.2Table 3 Note † | 8.9 |
| In a union or covered by a collective bargaining agreement | ||||||||
| No | 31.9 | 2.3 | 47.9 | 2.2 | 16.0Note *** | 3.2 | 13.7Note *** | 2.9 |
| Yes | 43.3 | 3.7 | 37.4 | 2.7 | -5.8 | 4.6 | 5.3 | 4.1 |
| Firm size (number of employees) | ||||||||
| 1 to 10 | 36.7 | 4.7 | 57.1 | 3.5 | 20.4Note *** | 5.9 | 19.2Note *** | 5.1 |
| 11 to 50 | 42.1 | 4.0 | 45.0 | 3.3 | 2.9 | 5.2 | 5.1 | 4.5 |
| 51 to 250 | 29.6 | 3.3 | 45.4 | 3.8 | 15.8Note ** | 5.1 | 20.6Note *** | 4.6 |
| 251 to 1,000 | 35.6 | 5.0 | 31.2 | 4.7 | -4.3 | 6.9 | 0.7 | 5.3 |
| More than 1,000 | 21.8 | 5.4 | 28.1 | 5.1 | 6.3 | 7.4 | 5.0 | 6.9 |
Source: Statistics Canada, Longitudinal and International Study of Adults, Wave 3 (2016). |
||||||||
References
Acemoglu, D., and D.H. Autor. 2010. Skills, Tasks and Technologies: Implications for Employment and Earnings. NBER Working Paper Series, no. 16082. Cambridge, Massachusetts: National Bureau of Economic Research.
Acemoglu, D., and P. Restrepo. 2019. “Automation and new tasks: How technology displaces and reinstates labor.” Journal of Economic Perspectives 33 (2): 3–30.
Arntz, M., T. Gregory, and U. Zierahn. 2016. The Risk of Automation for Jobs in OECD Countries: A Comparative Analysis. OECD Social, Employment and Migration Working Papers, no. 189. Paris: OECD Publishing.
Autor, D., H. Levy, and R. Murnane. 2003. “The skill content of recent technological change: An empirical exploration.” The Quarterly Journal of Economics 118 (4): 1279–1333.
Baird, M., R. Cooper, E. Hill, E. Probyn, and A. Vromen. 2018. Women and the Future of Work. Australian Women’s Working Futures project. Sydney: University of Sydney Business School.
Craig, L. 2006. “Does father care mean fathers share? A comparison of how mothers and fathers in intact families spend time with children.” Gender and Society 20 (2): 259–281.
Dellot, B. 2018. A Field Guide to the Future of Work: Essay Collection. The Royal Society for the Encouragement of Arts, Manufactures and Commerce. Available at: https://www.thersa.org/discover/publications-and-articles/reports/field-guide-to-the-future-of-work-essay-collection.
Dodel, M., and G.S. Mesch. 2020. “Perceptions about the impact of automation in the workplace.” Information, Communication & Society 23 (5): 665–680. Available at: https://doi.org/10.1080/1369118X.2020.1716043.
Frenette, M., and K. Frank. 2020. Automation and Job Transformation in Canada: Who’s at Risk? Analytical Studies Branch Research Paper Series, no. 448. Statistics Canada Catalogue no. 11F0019M. Ottawa: Statistics Canada.
Frey, C.B., and M.A. Osborne. 2013. The Future of Employment: How Susceptible Are Jobs to Computerisation? Oxford University, Oxford Martin School, Programme on the Impacts of Future Technology.
Goldin, C. 1987. “Women’s employment and technological change: A historical perspective.” In Computer Chips and Paper Clips: Technology and Women’s Employment, ed. H.I. Hartmann. Washington, D.C.: The National Academic Press.
Graetz, G., and G. Michaels. 2018. “Robots at work.” The Review of Economics and Statistics 100 (5): 753–768.
Guppy, N., L. Sakumoto, and R. Wilkes. 2019. “Social change and the gendered division of household labour in Canada.” Canadian Review of Sociology 56 (2): 178–203.
Hegewisch, A., C. Childers, and H. Hartmann. 2019. Women, Automation and the Future of Work. Institute for Women’s Policy Research. Available at: https://iwpr.org/wp-content/uploads/2020/08/C476_Automation-and-Future-of-Work.pdf
Hicks, M. 2017. Programmed Inequality: How Britain Discarded Women Technologists and Lost Its Edge in Computing. Cambridge, Massachusetts: MIT Press.
Levanon, A., P. England, and P. Allison. 2009. “Occupational feminization and pay: Assessing causal dynamics using 1950–2000 U.S. census data.” Social Forces 88 (2): 865–892.
Levy, F. and R. Murnane. 2013. Dancing with robots: human skills for computerized work. Washington, DC: Third Way NEXT.
Light, J.S. 1999. “When computers were women.” Technology and Culture 40 (3): 455–483.
Loewen, P., and B.A. Stevens. 2019. Automation, AI, and Anxiety: Policy Preferred, Populism Possible. Public Policy Forum, Key Issues Series.
Madgavkar, A., J. Manyika, M. Krishnan, K. Ellingrud, L. Yee, J. Woetzel, M. Chui, V. Hunt, and S. Balakrishnan. 2019. The Future of Women at Work: Transitions in the Age of Automation. McKinsey Global Institute. Available at: https://www.mckinsey.com/featured-insights/gender-equality/the-future-of-women-at-work-transitions-in-the-age-of-automation.
Muro, M., R. Maxim, and J. Whiton. 2019. Automation and Artificial Intelligence: How Machines are Affecting People and Places. Washington, D.C.: Brookings Institution Metropolitan Policy Program.
Peetz, D., and G. Murray. 2019. “Women’s employment, segregation and skills in the future of work.” Labour & Industry: A journal of the social and economic relations of work 29 (1): 132–148.
Piasna, A., and J. Drahokoupil. 2017. “Gender inequalities in the new world of work.” Transfer: European Review of Labour and Research 23 (3): 313–332.
RBC. 2019. Advantage Women: How an Automated Future Could Play to Women’s Strengths. RBC Economics. Available at: http://www.rbc.com/economics/economic-reports/pdf/other-reports/Advantagewomen_2019.pdf
Roberts, C., H. Parkes, R. Statham, and L. Rankin. 2019. The Future Is Ours: Women, Automation and Equality in the Digital Age. London: Institute for Public Policy Research.
Spitz-Oener, A. 2006. “Technical change, job tasks, and rising educational demands: looking outside the wage structure.” Journal of Labor Economics, Vol. 24, No. 2, pp. 235-270.
World Economic Forum. 2018. The Global Gender Gap Report 2018. Available at: http://www3.weforum.org/docs/WEF_GGGR_2018.pdf
- Date modified: