
Analytical Studies Branch Research Paper Series
Survival and Performance of Start-ups by Gender of Ownership: A Canadian Cohort Analysis

Archived Content
Information identified as archived is provided for reference, research or recordkeeping purposes. It is not subject to the Government of Canada Web Standards and has not been altered or updated since it was archived. Please "contact us" to request a format other than those available.
Acknowledgements
This study was funded by Women and Gender Equality Canada.
Abstract
This paper provides an overview of women-owned start-ups in Canada. The recently developed data on the gender of business owners, as well as longitudinal data on firm entry by cohort for Canadian private corporations, make it possible for the first time to examine the entry and performance of women-owned start-ups from 2005 to 2013. In this paper, the annual number, size and industry concentration of new majority women-owned firms are examined and compared with majority men-owned and equally owned entrants. Subsequently, the survival rate and performance of surviving new private corporations by gender are examined.
Executive summary
Issues pertaining to gender diversity in business ownership are of interest to policy makers and researchers. This paper uses newly developed data identifying the gender of business owners and longitudinal cohorts of firms from 2005 to 2013 to investigate differences in firm survival and labour productivity between majority men-owned, majority women-owned and equally owned start-ups with less than 100 employees. These are first examined at an aggregate level and then broken down by industry.
This paper outlines a number of features of women-owned start-ups. First, less than one-fifth of new entrants were women-owned, similar to what was observed in the overall firm population. Women-owned start-ups were not concentrated in a particular business size category and tended to have a stronger presence in the service industries. Second, women-owned start-ups had an overall lower survival rate than men-owned and equally owned start-ups, with equally owned start-ups having the highest survival rate when controlling for firm size but not industry. Third, women-owned start-ups had lower labour productivity than equally owned and men-owned start-ups, with men-owned start-ups having the highest overall labour productivity when controlling for capital but not industry. Fourth, when industry differences were accounted for, women-owned start-ups were more productive and more likely to survive than men-owned start-ups in industries in which they had a large presence (i.e., retail trade, and accommodation and food services, but not health care and social assistance).
These results highlight the importance of identifying industry-specific barriers that may still remain for women-owned start-ups.
1 Introduction
The entry of new firms into the market is an important mechanism for new ideas and innovations to be brought into the economy (Schumpeter 1912, 1943). Therefore, the entry and exit dynamics of new businesses (Ciobanu and Wang 2012; Macdonald 2014) and their life patterns (Macdonald 2012), productivity performance relative to incumbents (Baldwin and Lafrance 2011; Gu and Lafrance 2014; Liu and Tang 2017), and contribution to aggregate employment (Rollin 2012) have been tracked in numerous studies in Canada.
There is a large body of literature on self-employment and business ownership among women (e.g., Jeon and Ostrovsky 2016; Moyser 2017). These studies often examine the individual motivations for becoming self-employed or a business owner, the personal remuneration earned from becoming self-employed or a business owner, and the transition between and duration of different labour market states. These studies are based primarily on data where the unit of observation or survey unit is the individual. The incorporation of business data into these types of analyses makes it possible to study the economic performance of women-owned firms.
In Budget 2018, the Government of Canada emphasized the importance of women’s economic participation and developed the Women Entrepreneurship Strategy. To better understand the status of women entrepreneurs in Canada, this paper used innovative data on cohorts of new firms to examine the characteristics of women-owned start-ups, their survival and their labour productivity, compared with men-owned and equally owned start-ups in Canada.
Previous studies using survey data have looked at business performance differences between women-owned and men-owned firms and found that women-owned firms tended to underperform or be less likely to survive (Robb 2002; Du Rietz and Henrekson 2000; Brusch 1992; Rosa, Carter and Hamilton 1996; Fisher 1992; Fairlie and Robb 2009). However, another set of papers argued that this underperformance is only because of differences in the size of the business and the risk aversion of the business owner being improperly accounted for (Kalleberg and Leicht 1991; Marlow and McAdam 2013; Watson 2002; Watson and Robinson 2003; Robb and Watson 2012).
There are also barriers to entry that women-owned firms have been found to face women tend to have greater difficulty accessing capital and obtaining bank loans to start a business. Bates (2002) found that, when seeking to operate in a new market, women-owned enterprises in the manufacturing sector have less access to business clients than men-owned firms. Using the 2011 Survey on Financing and Growth of Small and Medium Enterprises, Rosa and Sylla (2016) found that majority women-owned small and medium enterprises (SMEs) were less likely to receive the full amount of financing they requested, and the amount they received was at a higher interest rate, than majority men-owned SMEs.
Controlling for firm size and age, the current study found that women-owned businesses have lower survival rates and labour productivity overall than men-owned start-ups, indicating that women-owned start-ups do not fare as well in the Canadian market as men-owned start-ups.Note For this paper, labour productivity was measured as the firm’s value added divided by the number of workers it employed.
However, this is only one part of the story. Bates (1995) and Anna et al. (2000) demonstrated how important it is to account for industry in measuring self-employment outcomes for women-owned firms. Kalnins and Williams (2014) measured women-owned firm survival, controlling for industry-specific effects, and found that women-owned businesses were more likely to survive in the retail industry in particular. The current paper found that, after industry was controlled for, women-owned start-ups were relatively more productive and more likely to survive than men-owned start-ups in industries in which they were more concentrated, with the exception of health care and social assistance. This new evidence of how the majority gender of ownership and industry intersect on firm performance measures may help policy makers support women as entrepreneurs.
Start of text boxKey concepts
Labour productivity: A measure of output per unit of labour, here defined as value added per employee.
Value added: Total output minus the value of intermediate inputs (e.g., goods used in the production process). In this study, value added is approximated by the sum of the compensation of employees (total payroll, a measure of return to labour) and capital income (a measure of return to capital).
The remainder of the paper is organized as follows. Section 2 describes the firm data and new data source for the determination of gender of ownership. Section 3 presents tabulations of entrants by size and industry. Section 4 compares the survival of firms and Section 5 compares the performance of new firms by majority gender of ownership. Section 6 provides a discussion of the results in greater detail, and Section 7 concludes.
2 Data
The National Accounts Longitudinal Microdata File (NALMF) developed by the Economic Analysis Division at Statistics Canada was used to identify cohorts of start-up firms in Canada from 2005 to 2013. This firm-level dataset was produced by linking various administrative datasets from the Canada Revenue Agency (CRA) using Statistics Canada’s Business Register. In each annual cross-section, the universe of the NALMF is defined as all enterprises in Canada that filed either a T2 Corporate Income Tax Return, a T4 Statement of Remuneration Paid or a PD7 payroll deduction form. As a result, the NALMF is a rich firm microdata set comprising firm characteristics, such as detailed industry classification, employment, payroll and revenue.
The NALMF also includes a set of predecessor successor tables that were constructed using T4 slips and labour tracking for each pair of consecutive years. Labour tracking was first used in Statistics Canada’s Longitudinal Employment Analysis Program to create a longitudinal history of firms in which spurious births and deaths (that could be the result of structural or administrative changes) were removed from the dataset.Note
In this paper, for a given year, a firm was classified as a birth if it (1) had a new business identifier, (2) had one or more employees for the first time, and (3) was not identified as a successor in labour tracking. To ensure that the files created provide a comprehensive picture of start-up firms, entrants with more than 100 employees were excluded. A start-up was considered as a death if its business identifier no longer existed in the NALMF and had not been flagged as a predecessor in labour tracking.
Data from the Canadian Employer Employee Dynamics Database (CEEDD) were used to assign the gender of ownership of firms to the NALMF data (see Grekou, Li and Liu 2018a). This module used Schedule 50 of the T2 Corporate Income Tax Return form. This schedule provides key information on the type of shareholders (i.e., company, individual and income trust) and owned shares for all shareholders with at least 10% ownership. Demographic characteristics of these shareholders, including sex, were then obtained by linking the T1 individual tax files to the T2 corporate tax files. In this paper, the sex (i.e., male or female) of the individual was recorded by the CRA as a proxy for gender.
A firm owner’s gender was identified by gender majority the gender with the highest share of ownership. If 51% or more of the shares were owned by women, the firm was defined as majority women-owned. A similar logic was used to identify majority men-owned firms. Firms were identified as equally owned when men and women each owned 50% of the firm.
2.1 Coverage and limitations
While the use of newly linked administrative files such as the NALMF and CEEDD allows for the measurement of Canadian statistics on the entry of women-owned firms for the first time, the data present various challenges and limitations.
First, only Canadian-controlled private corporations (CCPCs) are required to file a Schedule 50 as part of their corporate tax filings. As a result, gender of ownership information is available only for private corporations (i.e., non-publicly traded firms). A CCPC is an incorporated firm that is not controlled directly or indirectly in any manner by public corporations, non-residents or a combination of the two. It also excludes corporations such as Crown corporations and general insurers. Therefore, this study excludes public corporations and is limited to the sample of incorporated CCPCs with non-zero employment in the NALMF.
Second, since only shareholders of private corporations with at least 10% of shares are required to file a Schedule 50 and since, in some cases, the quality of reporting is poor, the majority gender of ownership cannot be established for all private corporations. CCPCs without an assigned gender can be divided into two categories: (1) firms for which the information is missing and no Schedule 50 was filed and (2) firms for which the information provided by the schedule is insufficient to establish the majority gender of ownership. The former category could include CCPCs owned by companies rather than individuals. Overall, the sample used for this analysis CCPCs for which a majority gender of ownership can be attributed covers roughly three-quarters of CCPCs in the NALMF (see Appendix Table A.1).
The evolution of cohorts of start-up firms from 2005 to 2013 was examined in this analysis. Although entrants were identified from 2005 to 2013 only, at the time of this analysis, the information on these entrants (e.g., balance sheet, employees, survival status) could be tracked up to 2015. The gender of ownership is the gender defined during the firm’s first year of existence, unless it is missing. If it is missing but defined within the next two years, it is used to define the majority gender of ownership of that firm.
While majority gender of ownership for a start-up is defined in the data as it is described above, in reality, the shareholders and, as a result, the majority gender of business ownership, may change over time. However, this impact of potential bias is limited, as only 0.2% of surviving firms switched to becoming women-owned firms from being either men-owned or equally owned firms, and only 0.3% went from being women-owned to either men-owned or equally owned.
3 Overview of entry
Similar to the findings of Grekou, Li and Liu (2018b), men-owned firms represented approximately two-thirds (67.4%) of all active private enterprises in Canada for which a majority gender of ownership could be attributed from 2005 to 2013.Note Women-owned firms represented 16.8% of firms, while 15.8% were equally owned (see Appendix Table A.2). Over this period, the number of women-owned firms increased at a faster pace than the number of men-owned firms, with the share of women-owned firms growing.
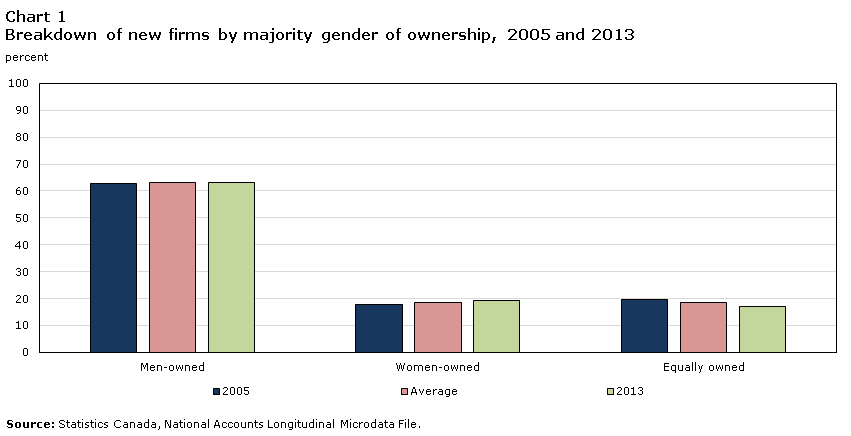
Using data from entry cohorts 2005 to 2013, Chart 1 shows that the distribution of entrants by gender of ownership was comparable to what was observed in the overall firm population. Less than one-fifth of new private corporations for which a gender of ownership could be identified were majority owned by women. However, the share of women-owned start-ups increased over the period, while the share of equally owned start-ups declined over the same period. Together, women-owned and equally owned firms represented roughly one-third of entrants, while the majority (two-thirds) of new firms were majority owned by men.
Data table for Chart 1
| Men-owned | Women-owned | Equally owned | |
|---|---|---|---|
| percent | |||
| 2005 | 62.63 | 17.64 | 19.73 |
| Average | 62.98 | 18.56 | 18.47 |
| 2013 | 63.32 | 19.47 | 17.21 |
| Source: Statistics Canada, National Accounts Longitudinal Microdata File. | |||
To examine the concentration of start-ups by firm size (Chart 2), three size categories were defined: micro (fewer than five employees), small (5 to 19 employees) and medium (20 to 99 employees).Note Women-owned entrants were not concentrated in a particular size category they represented roughly one-fifth of start-ups in each category from 2005 to 2013. Men-owned start-ups represented about two-thirds of entrants in all size categories and represented a larger share of medium-sized entrants. Equally owned start-ups were more likely to be micro or small firms rather than medium-sized entrants with 20 employees or more. Grekou (2020) found that women who start a business were more likely than men to go into business with a partner or have a partner who owns their own business.
Overall, the data show that the number of women-owned micro entrants increased more than that of men-owned micro entrants, and it decreased less than men-owned firms in the count of small entrants. As a result, the women-owned share of micro and small entrants increased over the period. The total number of medium entrants decreased, but the number of men-owned start-ups decreased less than that of women-owned start-ups. Therefore, men-owned entrants’ share of medium-sized firms increased. Overall, the share of micro and small women-owned start-ups increased from 2005 to 2013, while their share of medium-sized start-ups decreased. The share of medium-sized men-owned start-ups increased significantly. The share and count of equally owned start-ups decreased in all size categories over the period.

Data table for Chart 2
| Micro | Small | Medium | ||||||||||
|---|---|---|---|---|---|---|---|---|---|---|---|---|
| Men-owned | Women-owned | Equally owned | Percent of total | Men-owned | Women-owned | Equally owned | Percent of total | Men-owned | Women-owned | Equally owned | Percent of total | |
| percent | ||||||||||||
| 2005 | 62.46 | 17.59 | 19.95 | 87.06 | 63.16 | 18.03 | 18.81 | 11.21 | 67.43 | 17.88 | 14.69 | 1.73 |
| 2013 | 63.23 | 19.40 | 17.37 | 90.27 | 62.54 | 20.96 | 16.50 | 9.83 | 74.66 | 14.86 | 10.49 | 1.55 |
| Source: Statistics Canada, National Accounts Longitudinal Microdata File. | ||||||||||||
According to several studies,Note women-owned firms tend to have a stronger presence in the service industries. By disaggregating entrant cohorts based on the North American Industry Classification System (NAICS), a similar trend can be established for women-owned start-ups. The largest industry concentrations of women-owned entrants were observed in educational services; health care and social assistance; and arts, entertainment and recreation (Table 1).Note Also consistent with the literature is the finding that men-owned entrants were more represented in the transportation and warehousing, and construction industries. Equally owned start-ups were most represented in mining, quarrying, and oil and gas extraction; agriculture, forestry, fishing and hunting; real estate and rental and leasing; and management of companies and enterprises.
This distribution of entrants across industries remained mostly constant over time. From 2005 to 2013, only two industries experienced changes: transportation and warehousing, and health care and social assistance. In the case of the former, the share of men-owned entrants increased at the expense of both women-owned and equally owned entrants, while for the latter an increase in women-owned and equally owned entrants greater than that in men-owned entrants resulted in them representing a larger share of the industry in 2013 than in 2005.
This study found that less than one-fifth of new entrants were women-owned. Combined, women-owned and equally owned start-ups represented only about one-third of entrants. In addition, there were fewer women-owned start-ups, although the rate of entry is rising.
| Industry | Men-owned | Women-owned | Equally owned | |||
|---|---|---|---|---|---|---|
| Number of firms | Share of industry (percent) | Number of firms | Share of industry (percent) | Number of firms | Share of industry (percent) | |
| 11 – Agriculture, forestry, fishing and hunting | 8,162 | 64.4 | 1,169 | 9.2 | 3,342 | 26.4 |
| 21 – Mining, quarrying, and oil and gas extraction | 3,951 | 65.8 | 407 | 6.8 | 1,645 | 27.4 |
| 22 – Utilities | 187 | 71.6 | 28 | 10.7 | 46 | 17.6 |
| 23 – Construction | 53,666 | 75.7 | 4,946 | 7.0 | 12,265 | 17.3 |
| 31-33 – Manufacturing | 10,530 | 69.5 | 2,179 | 14.4 | 2,448 | 16.2 |
| 41 – Wholesale trade | 10,504 | 67.3 | 2,466 | 15.8 | 2,637 | 16.9 |
| 44-45 – Retail trade | 24,184 | 55.7 | 10,507 | 24.2 | 8,741 | 20.1 |
| 48-49 – Transportation and warehousing | 29,161 | 78.4 | 2,886 | 7.8 | 5,138 | 13.8 |
| 51 – Information and cultural industries | 5,042 | 69.2 | 1,351 | 18.6 | 890 | 12.2 |
| 52 – Finance and insurance | 5,972 | 60.1 | 2,001 | 20.2 | 1,957 | 19.7 |
| 53 – Real estate and rental and leasing | 9,937 | 56.9 | 3,559 | 20.4 | 3,983 | 22.8 |
| 54 – Professional, scientific and technical services | 53,696 | 59.4 | 17,884 | 19.8 | 18,781 | 20.8 |
| 55 – Management of companies and enterprises | 3,498 | 61.0 | 979 | 17.1 | 1,261 | 22.0 |
| 56 – Administrative and support, waste management and remediation services | 12,817 | 60.3 | 4,491 | 21.1 | 3,958 | 18.6 |
| 61 – Educational services | 2,120 | 43.3 | 1,746 | 35.7 | 1,029 | 21.0 |
| 62 – Health care and social assistance | 17,262 | 47.3 | 11,992 | 32.9 | 7,238 | 19.8 |
| 71 – Arts, entertainment and recreation | 3,054 | 54.0 | 1,632 | 28.8 | 974 | 17.2 |
| 72 – Accommodation and food services | 19,737 | 55.7 | 8,193 | 23.1 | 7,515 | 21.2 |
| 81 – Other services (except public administration) | 15,203 | 56.6 | 6509 | 24.2 | 5141 | 19.1 |
| Unclassified | 44,702 | 62.2 | 14,403 | 20.0 | 12,792 | 21.2 |
| Total | 333,385 | 62.4 | 99,328 | 18.6 | 101,781 | 19.0 |
| Source: Statistics Canada, National Accounts Longitudinal Microdata File. | ||||||
4 Survival analysis
4.1 Survival rates
This next section examines firms’ likelihood of survival given their entry into the market. First, a Kaplan-Meier survival curve was estimated for each majority gender of ownership, then two Cox proportional hazards models were run, first estimating hazard rates by majority gender of ownership only, and then by majority gender of ownership and industry.
The survival rate was measured for the 2005 cohort of start-up firms, which was the cohort that could be followed over the longest period in the data. It was estimated using the Kaplan-Meier hazard rate by majority gender of ownership.
The Kaplan-Meier estimator for the survival function was defined as
where is the number of start-ups that exited and is the number of start-ups that survived.
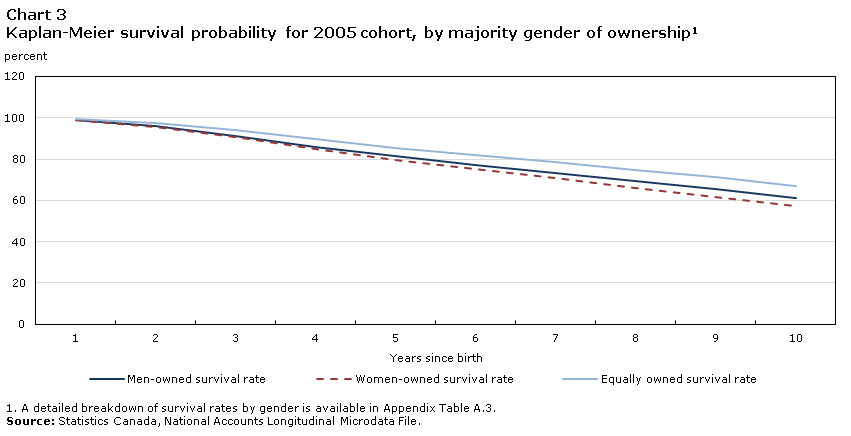
Chart 3 shows that for the first four years of the start-up’s existence, the survival rates of both men-owned and women-owned start-ups were somewhat similar (though they were statistically significantly different), then they diverged after. Interestingly, firms that were equally owned had a higher survival rate than men-owned or women-owned firms. Ten years after entry, 67.0% of the equally owned entrants from the 2005 cohorts were still alive, while 61.3% and 57.1% of the men-owned and women-owned entrants had survived, respectively. This indicates that in addition to lower entry counts for women-owned firms relative to men-owned and equally owned entrants, women-owned firms also faced lower survival rates than their counterparts. As a result, the proportion of women-owned firms decreased over time for that cohort.Note
Data table for Chart 3
| Year | Men-owned survival rate | Women-owned survival rate | Equally owned survival rate |
|---|---|---|---|
| percent | |||
| 1 | 99.10 | 98.86 | 99.52 |
| 2 | 95.83 | 95.49 | 97.35 |
| 3 | 91.20 | 90.58 | 93.94 |
| 4 | 86.06 | 84.94 | 89.63 |
| 5 | 81.60 | 79.72 | 85.34 |
| 6 | 77.27 | 75.07 | 81.85 |
| 7 | 73.09 | 70.58 | 78.44 |
| 8 | 69.13 | 66.11 | 74.47 |
| 9 | 65.35 | 61.78 | 71.16 |
| 10 | 61.30 | 57.06 | 67.00 |
|
|||
4.2 Model
To further assess how the gender of ownership and industry relate to entrants’ survival time, a baseline Cox proportional hazards model was estimated using the following specifications of the hazard function , the first one (Model 1) restricted and the second one (Model 2) unrestricted:Note
Model 1
is the baseline hazard rate. Since a firm’s size is generally positively linked to its survival rate (Macdonald 2012; Grekou and Liu 2018), the variable labourNote was added to the model. It is defined as the natural logarithm of the initial number of employees in the firm. The variable cohort controls for the cohort to which the firm belongs.
The categorical variable industry (industry was classified at the two-digit NAICS level) was then introduced in the model and estimated in the unrestricted specification:
Model 2
Controlling for industry differences is important, as some industries may have an inherently higher turnover rate for firms, and differences in industry composition across start-up gender lead to misleading results at the aggregate level.
4.3 Results
The results for Model 1 (restricted model) are summarized in Table 2. The hazard rates show that women-owned firms were 14.9% more likely to exit than men-owned firms, whereas equally owned firms were 24.5% less likely to exit than men-owned firms. As expected, the size of the firm was positively correlated with a higher probability of survival.Note
Interestingly, equally owned start-ups had a lower probability of exit than men-owned and women-owned firms. Not only are there fewer women-owned start-ups entering the market, but those that enter are also more likely to exit.
| Variables | Coefficient | Hazard rate | p-value |
|---|---|---|---|
| Women-owned | 0.139 | 1.149 | 0Note *** |
| Equally owned | -0.281 | 0.755 | 0Note *** |
|
|||
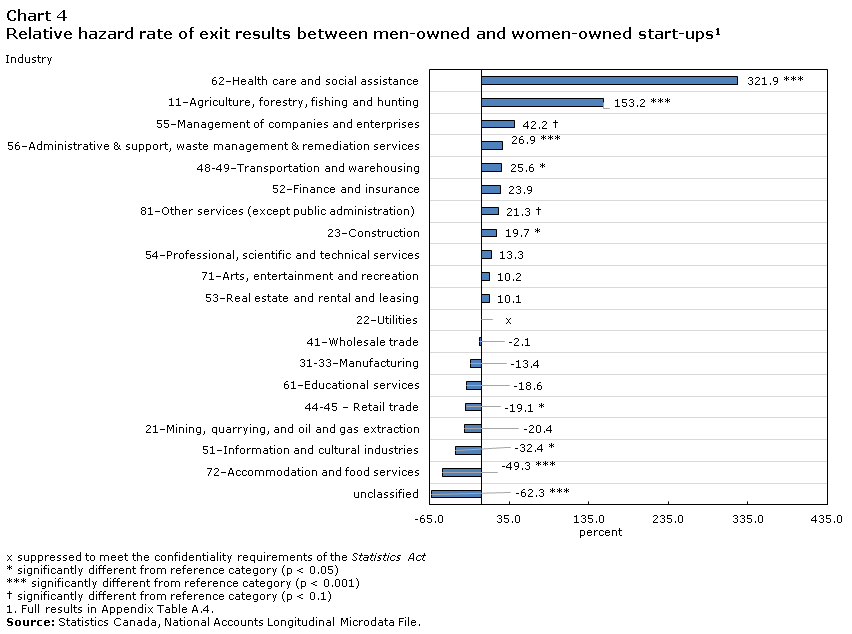
The results of Model 2 (unrestricted Cox proportional hazards model specification) within-industry differences between men-owned and women-owned start-ups and men-owned and equally owned start-ups are shown in charts 4 and 5, respectively.Note Women-owned start-ups had a lower and statistically significant (at the 5% level) hazard rate of exit relative to men-owned firms in retail trade and accommodation and food services. These service industries typically have a higher concentration of women-owned firms, whereas women-owned firms in industries with a lower concentration of women-owned start-ups were more likely to exit. These industries include construction; agriculture, forestry, fishing and hunting; administrative and support, waste management and remediation services; and transportation and warehousing. However, they were much more likely to exit in health care and social assistance, an industry in which they do have a large presence.Note
Data table for Chart 4
| Industry | Percent |
|---|---|
| 62–Health care and social assistance | 321.9Note *** |
| 11–Agriculture, forestry, fishing and hunting | 153.2Note *** |
| 55–Management of companies and enterprises | 42.2Chart 4 Note † |
| 56–Administrative & support, waste management & remediation services | 26.9Note *** |
| 48-49–Transportation and warehousing | 25.6Note * |
| 52–Finance and insurance | 23.9 |
| 81–Other services (except public administration) | 21.3Chart 4 Note † |
| 23–Construction | 19.7Note * |
| 54–Professional, scientific and technical services | 13.3 |
| 71–Arts, entertainment and recreation | 10.2 |
| 53–Real estate and rental and leasing | 10.1 |
| 22–Utilities | Note x: suppressed to meet the confidentiality requirements of the Statistics Act |
| 41–Wholesale trade | -2.1 |
| 31-33–Manufacturing | -13.4 |
| 61–Educational services | -18.6 |
| 44-45 – Retail trade | -19.1Note * |
| 21–Mining, quarrying, and oil and gas extraction | -20.4 |
| 51–Information and cultural industries | -32.4Note * |
| 72–Accommodation and food services | -49.3Note *** |
| unclassified | -62.3Note *** |
x suppressed to meet the confidentiality requirements of the Statistics Act
|
|
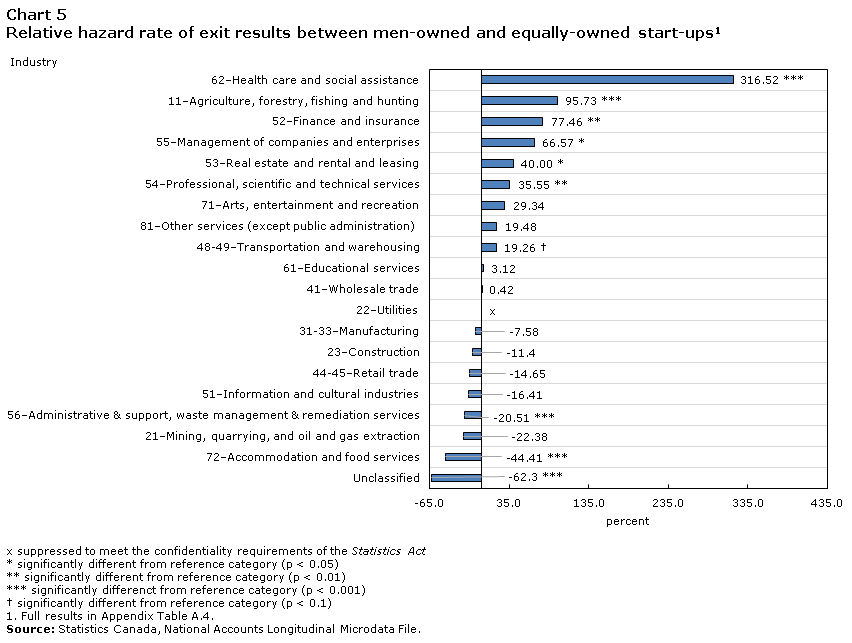
Equally owned start-ups were more likely to exit than men-owned start-ups in health care and social assistance; agriculture, forestry, fishing and hunting; finance and insurance; management of companies and enterprises; and professional, scientific and technical services. However, in administrative and support, waste management and remediation services, as well as in accommodation and food services, equally owned firms were less likely to exit than men-owned firms in their respective industries.
Data table for Chart 5
| Industry | Percent |
|---|---|
| 62–Health care and social assistance | 316.52Note *** |
| 11–Agriculture, forestry, fishing and hunting | 95.73Note *** |
| 52–Finance and insurance | 77.46Note ** |
| 55–Management of companies and enterprises | 66.57Note * |
| 53–Real estate and rental and leasing | 40.00Note * |
| 54–Professional, scientific and technical services | 35.55Note ** |
| 71–Arts, entertainment and recreation | 29.34 |
| 81–Other services (except public administration) | 19.48 |
| 48-49–Transportation and warehousing | 19.26Chart 5 Note † |
| 61–Educational services | 3.12 |
| 41–Wholesale trade | 0.42 |
| 22–Utilities | Note x: suppressed to meet the confidentiality requirements of the Statistics Act |
| 31-33–Manufacturing | -7.58 |
| 23–Construction | -11.38 |
| 44-45–Retail trade | -14.65 |
| 51–Information and cultural industries | -16.41 |
| 56–Administrative & support, waste management & remediation services | -20.51Note *** |
| 21–Mining, quarrying, and oil and gas extraction | -22.38 |
| 72–Accommodation and food services | -44.41Note *** |
| Unclassified | -62.30Note *** |
x suppressed to meet the confidentiality requirements of the Statistics Act
|
|
5 Performance of entrant cohorts by gender of ownership
The previous sections of this paper established that, in addition to being fewer, majority women-owned entrants tended to have a lower probability of survival than their men-owned and equally owned counterparts from 2005 to 2013. To better understand the underlying differences between entrants by majority ownership, the following section examines the average labour productivity for the first five years of all entrant cohorts with positive employment from 2005 to 2010, by gender of ownership.
Labour productivity is an indicator that reflects the effectiveness of labour use. This measure was derived by taking the firm’s value added in nominal terms and dividing it by the number of employees it has.Note Firms that are more productive tend to be larger and survive longer and are more likely to export (Melitz 2003; Bernard et al. 2003; Scarpetta et al. 2002; Esteve-Pérez, Máñez-Castillejo and Sanchis-Llopis 2008). Chart 6 shows that men-owned and equally owned start-ups had significantly higher labour productivity than women-owned start-ups initially. However, the labour productivity of equally owned start-ups trended lower than men-owned start-ups and diverged in later years.

Data table for Chart 6
| Years since birth | Men-owned | Women-owned | Equally owned |
|---|---|---|---|
| average value added per worker ($/worker) | |||
| 1 | 40,937.72 | 34,520.69 | 40,059.05 |
| 2 | 44,226.49 | 36,499.04 | 43,167.26 |
| 3 | 45,717.51 | 38,098.92 | 44,893.54 |
| 4 | 48,721.06 | 39,232.26 | 46,747.93 |
| 5 | 50,845.29 | 40,969.66 | 46,605.17 |
| Grand total | 230,448.06 | 189,320.57 | 221,472.95 |
| Source: Statistics Canada, National Accounts Longitudinal Microdata File. | |||
This time evolution graph shows that women-owned entrants appeared less productive overall. As a result, they are less competitive and would require more resources to produce the same amount of output as men-owned or equally owned start-ups.
5.1 Regression analysis
5.1.1 Model
To further quantify the sources of differences across start-up genders, two models were estimated one restricted and one unrestricted. First, the restricted model controlled only for gender, capital per worker, cohort and a time trend. The unrestricted model also controlled for industry and interaction effects between industry and gender. The unrestricted model was used to measure within-industry differences in labour productivity between the different majority genders of ownership. This made it possible to isolate differences previously attributed to gender in the aggregate numbers, rather than differences stemming from different majority genders of ownership having different industry compositions.
The restricted and unrestricted models are the following:
The variables gender and industry are categorical. The breakdown used for industry was the same one used in Table 1 (NAICS two-digit sector level). The variable capital is the log amount of tangible assets per worker the firm has, and t is a time trend. It is important to control for capital when measuring labour productivity, as capital can influence the production process and because as discussed in the introduction women-owned firms tend to have greater difficulty accessing financing. All cohorts from 2005 to 2013 were used, and cohort dummies were included.Note
5.1.2 Results
Table 3 shows labour productivity for the restricted specification used in this study. Women-owned and equally owned start-ups were 14.1% and 2.3% less productive on average than men-owned start-ups, respectively. As expected, capital per worker and start-up age were both positively related to labour productivity. These aggregate differences between genders were similar to those found in Chart 6.
| Variables | Coefficient | p-value |
|---|---|---|
| (Intercept) | 8.964 | 0Note *** |
| Women-owned | -0.141 | 0Note *** |
| Equally owned | -0.023 | 0Note *** |
| Capital | 0.145 | 0Note *** |
| Time | 0.046 | 0Note *** |
|
||
In the previous section, it was found that equally owned entrants had a lower probability of exit overall than men-owned or women-owned start-ups. However, labour productivity points to men-owned start-ups performing better overall than equally owned or women-owned start-ups. This could be because many equally owned firms are family-owned firms,Note which may benefit from risk sharing and do not follow similar profit-maximizing goals. A more detailed study on the characteristics of these owners and the number of owners per firm could be an opportunity for further examination.
Chart 7 shows the results of the unrestricted specification, where the within-industry differences between majority men-owned and women-owned start-ups are highlighted. When these results are contrasted with industry concentration, women-owned start-ups were more productive in industries with a higher concentration of women-owned businesses (see Table 1), particularly in retail trade, and accommodation and food services, but not in health care and social assistance. Health care and social assistance may not share the same production optimization as other industries because of the large number of doctors who are permitted by law to incorporate, following government-regulated costing schemes that vary by province. As was shown in the previous section, not only were women-owned start-ups more likely to survive in industries in which they were more concentrated, but this section shows that they were also more productive in these industries.

Data table for Chart 7
| Industry | Percent |
|---|---|
| 72–Accommodation and food services | 0.933Note *** |
| 44-45–Retail trade | 0.097Note *** |
| 61–Educational services | 0.035 |
| 71–Arts, entertainment and recreation | 0.026 |
| 22–Utilities | Note x: suppressed to meet the confidentiality requirements of the Statistics Act |
| 56–Administrative & support, waste management & remediation services | -0.044Note *** |
| 48-49–Transportation and warehousing | -0.051Note ** |
| 23–Construction | -0.169Note *** |
| 31-33–Manufacturing | -0.180Note *** |
| Unclassified | -0.265Note *** |
| 51–Information and cultural industries | -0.303Note *** |
| 41–Wholesale trade | -0.364Note *** |
| 81–Other services (except public administration) | -0.443Note *** |
| 53–Real estate and rental and leasing | -0.446Note *** |
| 11–Agriculture, forestry, fishing and hunting | -0.579Note *** |
| 21–Mining, quarrying, and oil and gas extraction | -0.765Note *** |
| 54–Professional, scientific and technical services | -0.825Note *** |
| 52–Finance and insurance | -0.943Note *** |
| 55–Management of companies and enterprises | -1.090Note *** |
| 62–Health care and social assistance | -1.709Note *** |
x suppressed to meet the confidentiality requirements of the Statistics Act
Source: Statistics Canada, National Accounts Longitudinal Microdata File. |
|
Chart 8 shows the results of the unrestricted specification but for within-industry differences between majority men-owned and equally owned start-ups. These results, in combination with the industry concentration, show that equally owned start-ups were also more productive in some of the industries in which they were more highly represented, such as in accommodation and food services and in retail trade.

Data table for Chart 8
| Industry | Percent |
|---|---|
| 72–Accommodation and food services | 0.926Note *** |
| 44-45–Retail trade | 0.104Note *** |
| 48-49–Transportation and warehousing | 0.074Note *** |
| 61–Educational services | 0.048 |
| 56–Administrative & support, waste management & remediation services | 0.033Note *** |
| 22–Utilities | Note x: suppressed to meet the confidentiality requirements of the Statistics Act |
| 31-33–Manufacturing | -0.061Note *** |
| 81–Other services (except public administration) | -0.079Note *** |
| 23–Construction | -0.094Note *** |
| 71–Arts, entertainment and recreation | -0.191Note *** |
| Unclassified | -0.196Note *** |
| 41–Wholesale trade | -0.322Note *** |
| 11–Agriculture, forestry, fishing and hunting | -0.367Note *** |
| 51–Information and cultural industries | -0.448Note *** |
| 53–Real estate and rental and leasing | -0.578Note *** |
| 54–Professional, scientific and technical services | -0.811Note *** |
| 21–Mining, quarrying, and oil and gas extraction | -0.819Note *** |
| 52–Finance and insurance | -0.958Note *** |
| 55–Management of companies and enterprises | -1.259Note *** |
| 62–Health care and social assistance | -1.526Note *** |
x suppressed to meet the confidentiality requirements of the Statistics Act
|
|
The following predominant result was derived from this analysis: women-owned start-ups tended to have a higher survival rate and better performance than men-owned start-ups in industries in which they were more concentrated namely, retail trade, and accommodation and food services, but not health care and social assistance. There is some question as to whether the health care and social assistance industry follows typical profit maximizing behaviours, as it is largely populated by health care practitioners who may incorporate in some provinces. Provinces follow different regulated costing schemes. Furthermore, the results for this industry may reflect differences in the composition of physician types between men and women. Women doctors also tended to be family physicians (Richards 2019) rather than specialists.
This paper acknowledges that there are more aspects to firm performance that were not observed or controlled for. Some of the literature suggests that women tend to enter entrepreneurship for non-financial reasons, such as flexible work hours (Moyser and Burlock 2018).
6 Conclusion
This paper uses recently developed administrative data on the gender of firm owners, as well as data on firm entry cohorts for CCPCs, to examine the evolution and performance of these cohorts of start-up firms from 2005 to 2013. In aggregate, men-owned firms represented the largest share of these start-ups (just under two-thirds). However, while the number of women entrants represented only one-fifth of the start-ups, their number and share of entrants increased throughout the period. In terms of size at entry, women’s share of micro and small entrants increased over the period, while men’s share of medium-sized entrants rose. Furthermore, the share of equally owned start-ups decreased across all size categories over the period.
When examining the survival and performance of these start-ups, some salient differences were observed across the three majority genders of ownership. Women-owned start-ups had an overall lower survival rate and lower labour productivity than equally owned and men-owned start-ups. When industry was controlled for, women-owned start-ups were more productive and more likely to survive in industries with a higher concentration of women-owned start-ups (i.e., retail trade, and accommodation and food services), relative to men-owned start-ups in the same industries. However, the women-owned start-ups in health care and social assistance, of which there was also a high concentration, were less productive and less likely to survive than men-owned start-ups in that industry.
While the aggregate results leave room for improvement in terms of performance and survival for women-owned start-ups, within-industry results show some promise.
More work is needed to establish the source of the barriers that remain in some industries and identify any industry-specific barriers to women-owned start-ups that may still remain. This paper shows that future research on the topic needs to account for these industry differences and that policies may need to target particular industries to be more efficient. In the future, the CEEDD data used in this paper may make it possible to further disaggregate and study additional characteristics of business owners that might also impact their survival (e.g., age or immigration status).
7 Appendix
7.1 Tables
| Year | Incorporated enterprises | CCPCs | CCPCs with assigned gender | Share of CCPCs with assigned gender |
|---|---|---|---|---|
| number | percent | |||
| 2005 | 1,698,522 | 1,625,297 | 1,170,707 | 72.0 |
| 2006 | 1,772,471 | 1,689,556 | 1,234,781 | 73.1 |
| 2007 | 1,852,656 | 1,762,830 | 1,300,655 | 73.8 |
| 2008 | 1,919,120 | 1,825,054 | 1,354,804 | 74.2 |
| 2009 | 1,951,750 | 1,858,202 | 1,390,136 | 74.8 |
| 2010 | 2,009,045 | 1,912,407 | 1,438,204 | 75.2 |
| 2011 | 2,066,152 | 1,965,429 | 1,485,997 | 75.6 |
| 2012 | 2,115,365 | 2,006,809 | 1,528,681 | 76.2 |
| 2013 | 2,152,136 | 2,038,808 | 1,560,880 | 76.6 |
|
Note: CCPC stands for Canadian-controlled private corporation. Source: Statistics Canada, National Accounts Longitudinal Microdata File. |
||||
| Year | Majority gender of ownership | ||||||
|---|---|---|---|---|---|---|---|
| Men | Women | Equal | Total | ||||
| Number of firms | Share (percent) | Number of firms | Share (percent) | Number of firms | Share (percent) | Number of firms | |
| 2005 | 786,131 | 68.1 | 187,474 | 16.2 | 180,250 | 15.6 | 1,153,855 |
| 2006 | 827,865 | 68.0 | 198,560 | 16.3 | 190,426 | 15.6 | 1,216,851 |
| 2007 | 873,445 | 67.9 | 211,431 | 16.4 | 201,610 | 15.7 | 1,286,486 |
| 2008 | 905,667 | 67.6 | 222,191 | 16.6 | 211,145 | 15.8 | 1,339,003 |
| 2009 | 924,818 | 67.4 | 230,195 | 16.8 | 216,189 | 15.8 | 1,371,202 |
| 2010 | 953,320 | 67.3 | 240,837 | 17.0 | 223,273 | 15.8 | 1,417,430 |
| 2011 | 979,962 | 67.0 | 251,188 | 17.2 | 231,464 | 15.8 | 1,462,614 |
| 2012 | 1,007,332 | 66.8 | 261,019 | 17.3 | 240,758 | 16.0 | 1,509,109 |
| 2013 | 1,026,296 | 66.6 | 268,800 | 17.4 | 246,552 | 16.0 | 1,541,648 |
| Average | 920,537 | 67.4 | 230,188 | 16.8 | 215,741 | 15.8 | 1,366,466 |
Source: Statistics Canada, National Accounts Longitudinal Microdata File. |
|||||||
| Year | Men-owned survival rate | Women-owned survival rate | Equally owned survival rate |
|---|---|---|---|
| percent | |||
| 1 | 99.1 | 98.9 | 99.5 |
| 2 | 95.8 | 95.5 | 97.4 |
| 3 | 91.2 | 90.6 | 93.9 |
| 4 | 86.1 | 84.9 | 89.6 |
| 5 | 81.6 | 79.7 | 85.3 |
| 6 | 77.3 | 75.1 | 81.9 |
| 7 | 73.1 | 70.6 | 78.4 |
| 8 | 69.1 | 66.1 | 74.5 |
| 9 | 65.3 | 61.8 | 71.2 |
| 10 | 61.3 | 57.1 | 67.0 |
| Source: Statistics Canada, National Accounts Longitudinal Microdata File. | |||
| Industry | Men-owned and women-owned coefficient | p-value | Men-owned and equally owned coefficient | p-value |
|---|---|---|---|---|
| 11 – Agriculture, forestry, fishing and hunting | 0.929 | 0.000Note *** | 0.672 | 0.000Note *** |
| 21 – Mining, quarrying, and oil and gas extraction | -0.228 | 0.278 | -0.253 | 0.119 |
| 22 – Utilities | Note x: suppressed to meet the confidentiality requirements of the Statistics Act | Note x: suppressed to meet the confidentiality requirements of the Statistics Act | Note x: suppressed to meet the confidentiality requirements of the Statistics Act | Note x: suppressed to meet the confidentiality requirements of the Statistics Act |
| 23 – Construction | 0.180 | 0.048Note * | -0.121 | 0.196 |
| 31-33 – Manufacturing | -0.144 | 0.243 | -0.079 | 0.545 |
| 41 – Wholesale trade | -0.021 | 0.859 | 0.004 | 0.974 |
| 44-45 – Retail trade | -0.212 | 0.017Note * | -0.158 | 0.101 |
| 48-49 – Transportation and warehousing | 0.228 | 0.028Note * | 0.176 | 0.093Table A.4 Note † |
| 51 – Information and cultural industries | -0.392 | 0.017Note * | -0.179 | 0.326 |
| 52 – Finance and insurance | 0.214 | 0.231 | 0.574 | 0.002Note ** |
| 53 – Real estate and rental and leasing | 0.096 | 0.471 | 0.337 | 0.016Note * |
| 54 – Professional, scientific and technical services | 0.125 | 0.154 | 0.304 | 0.001Note ** |
| 55 – Management of companies and enterprises | 0.352 | 0.097Table A.4 Note † | 0.510 | 0.015Note * |
| 56 – Administrative and support, waste management and remediation services | 0.238 | 0.000Note *** | -0.229 | 0.000Note *** |
| 61 – Educational services | -0.206 | 0.290 | 0.031 | 0.888 |
| 62 – Health care and social assistance | 1.440 | 0.000Note *** | 1.427 | 0.000Note *** |
| 71 – Arts, entertainment and recreation | 0.098 | 0.534 | 0.257 | 0.147 |
| 72 – Accommodation and food services | -0.678 | 0.000Note *** | -0.587 | 0.000Note *** |
| 81 – Other services (except public administration) | 0.193 | 0.052Table A.4 Note † | 0.178 | 0.103 |
| Unclassified | -0.976 | 0.000Note *** | -0.975 | 0.000Note *** |
x suppressed to meet the confidentiality requirements of the Statistics Act
|
||||
| Industry | Men-owned and women-owned percentage difference | p-value | Men-owned and equally owned percentage difference | p-value |
|---|---|---|---|---|
| 11 – Agriculture, forestry, fishing and hunting | -0.579 | 0.000Note *** | -0.367 | 0.000Note *** |
| 21 – Mining, quarrying, and oil and gas extraction | -0.765 | 0.000Note *** | -0.819 | 0.000Note *** |
| 22 – Utilities | Note x: suppressed to meet the confidentiality requirements of the Statistics Act | Note x: suppressed to meet the confidentiality requirements of the Statistics Act | Note x: suppressed to meet the confidentiality requirements of the Statistics Act | Note x: suppressed to meet the confidentiality requirements of the Statistics Act |
| 23 – Construction | -0.169 | 0.000Note *** | -0.094 | 0.000Note *** |
| 31-33 – Manufacturing | -0.180 | 0.000Note *** | -0.061 | 0.000Note *** |
| 41 – Wholesale trade | -0.364 | 0.000Note *** | -0.322 | 0.000Note *** |
| 44-45 – Retail trade | 0.097 | 0.000Note *** | 0.104 | 0.000Note *** |
| 48-49 – Transportation and warehousing | -0.051 | 0.002Note ** | 0.074 | 0.000Note *** |
| 51 – Information and cultural industries | -0.303 | 0.000Note *** | -0.448 | 0.000Note *** |
| 52 – Finance and insurance | -0.943 | 0.000Note *** | -0.958 | 0.000Note *** |
| 53 – Real estate and rental and leasing | -0.446 | 0.000Note *** | -0.578 | 0.000Note *** |
| 54 – Professional, scientific and technical services | -0.825 | 0.000Note *** | -0.811 | 0.000Note *** |
| 55 – Management of companies and enterprises | -1.090 | 0.000Note *** | -1.259 | 0.000Note *** |
| 56 – Administrative and support, waste management and remediation services | -0.044 | 0.000Note *** | 0.033 | 0.000Note *** |
| 61 – Educational services | 0.035 | 0.261 | 0.048 | 0.138 |
| 62 – Health care and social assistance | -1.709 | 0.000Note *** | -1.526 | 0.000Note *** |
| 71 – Arts, entertainment and recreation | 0.026 | 0.396 | -0.191 | 0.000Note *** |
| 72 – Accommodation and food services | 0.933 | 0.000Note *** | 0.926 | 0.000Note *** |
| 81 – Other services (except public administration) | -0.443 | 0.000Note *** | -0.079 | 0.000Note *** |
| Unclassified | -0.265 | 0.000Note *** | -0.196 | 0.000Note *** |
x suppressed to meet the confidentiality requirements of the Statistics Act
|
||||
References
Anna, A.L., G.N. Chandler, E. Jansen, and N.P. Mero. 2000. “Women business owners in traditional and non-traditional industries.” Journal of Business Venturing 15 (3): 279–303.
Baldwin, J.R., and A. Lafrance. 2011. Firm Turnover and Productivity Growth in Selected Canadian Service Industries, 2000 to 2007. Economic Analysis Research Paper Series, no. 72. Statistics Canada Catalogue no. 11F0027M. Ottawa: Statistics Canada.
Bates, T. 1995. “Self-employment entry across industry groups.” Journal of Business Venturing 10 (2): 143–156.
Bates, T. 2002. “Restricted access to markets characterizes women-owned businesses.” Journal of Business Venturing 17 (4): 313–324. Available at: 10.1016/S0883-9026(00)00066-5.
Bernard, A.B., J. Eaton, J.B. Jensen, and S. Kortum. 2003. “Plants and productivity in international trade.”American Economic Review 93 (4): 1268–1290.
Brusch, C.G. 1992. “Research on women business owners: Past trends, a new perspective and future directions.” Entrepreneurship Theory and Practice 16 (4): 5–30.
Ciobanu, O., and W. Wang. 2012. Firm Dynamics: Firm Entry and Exit in Canada, 2000 to 2008. The Canadian Economy in Transition Series, no. 22. Statistics Canada Catalogue no. 11-622-M. Ottawa: Statistics Canada.
Dixon, J., and A.-M. Rollin. 2014. The Distribution of Employment Growth Rates in Canada: The Role of High-growth and Rapidly Shrinking Firms. Economic Analysis Research Paper Series, no. 91. Statistics Canada Catalogue no. 11F0027M. Ottawa: Statistics Canada.
Du Rietz, A., and M. Henrekson. 2000. “Testing the female underperformance hypothesis.” Small Business Economics 14 (1): 1–10.
Esteve-Pérez, S., J.A. Máñez-Castillejo, and J.A. Sanchis-Llopis. 2008. “Does a ‘survival-by-exporting’ effect for SMEs exist?” Empirica (35): 81–104. Available at: https://doi.org/10.1007/s10663-007-9052-1.
Fairlie, R., and A. Robb. 2009. “Gender differences in business performance: Evidence from the Characteristics of Business Owners survey.” Small Business Economics 33 (4): 375–395.
Fischer, E. 1992. “Sex differences and small business performance among Canadian retailers and service providers.” Journal of Small Business and Entrepreneurship 9 (4): 2–13.
Grekou, D. 2020. Labour Market Experience, Gender Diversity and the Success of Women-owned Enterprises. Analytical Studies Branch Research Paper Series, no. 447. Statistics Canada Catalogue no. 11F00019M. Ottawa: Statistics Canada.
Grekou, D., and H. Liu. 2018. The Entry and Exit of Self-employment and Business Ownership in Canada. Analytical Studies Branch Research Paper Series, no. 407. Statistics Canada Catalogue no. 11F0019M. Ottawa: Statistics Canada.
Grekou, D., J. Li, and H. Liu. 2018a. The Measurement of Business Ownership by Gender in the Canadian Employer Employee Dynamics Database. Analytical Studies: Methods and Reference, no. 17. Statistics Canada Catalogue no. 11-633-X. Ottawa: Statistics Canada.
Grekou, D., J. Li, and H. Liu. 2018b. Women-owned Enterprises in Canada. Economic Insights, no. 83. Statistics Canada Catalogue no. 11-626-X. Ottawa: Statistics Canada.
Gu, W., and A. Lafrance. 2014. Productivity Growth in the Canadian Broadcasting and Telecommunications Industry: Evidence from Micro Data. Economic Analysis Research Paper Series, no. 89. Statistics Canada Catalogue no. 11F0027M. Ottawa: Statistics Canada.
Jeon, S.-H., and Y. Ostrovsky. 2016. Balancing Family and Work: Transition to Self-employment Among New Mothers. Analytical Studies Branch Research Paper Series, no. 385. Statistics Canada Catalogue no. 11F0019M. Ottawa: Statistics Canada.
Kalleberg, A., and K. Leicht. 1991. “Gender and organizational performance: Determinants of small business survival and success.” Academy of Management Journal 34 (1): 136–161.
Kalnins, A., and M. Williams. 2014. “When do female-owned businesses out-survive male-owned businesses? A disaggregated approach by industry and geography.” Journal of Business Venturing 29 (6): 822–835.
Liu, H., and J. Tang. 2017. “Age-productivity profiles of entrants and exits: Evidence from Canadian manufacturing.” Structural Change and Economic Dynamics 40: 26–36.
Macdonald, R. 2012. Firm Dynamics: The Death of New Canadian Firms: A Survival Analysis of the 2002 Cohort of Entrants to the Business Sector. The Canadian Economy in Transition Series, no. 28. Statistics Canada Catalogue no. 11-622-M. Ottawa: Statistics Canada.
Macdonald, R. 2014. Business Entry and Exit Rates in Canada: A 30-year Perspective. Economic Insights, no. 38. Statistics Canada Catalogue no. 11-626-X. Ottawa: Statistics Canada.
Marlow, S., and M. McAdam. 2013. “Gender and entrepreneurship: Advancing debate and challenging myths; exploring the mystery of the under-performing female entrepreneur.” International Journal of Entrepreneurial Behaviour & Research 19 (1): 114–124.
Melitz, M.J. 2003. “The impact of trade on intra-industry reallocations and aggregate industry productivity.”Econometrica 71 (6): 1695–1725.
Moyser, M. 2017. “Women and paid work.” Women in Canada: A Gender-based Statistical Report. Statistics Canada Catalogue no. 89-503-X. Ottawa: Statistics Canada.
Moyser, M., and A. Burlock. 2018. “Time use: Total work burden, unpaid work, and leisure.” Women in Canada: A Gender-based Statistical Report. Statistics Canada Catalogue no. 89-503-X. Ottawa: Statistics Canada.
Richards, E. 2019. Who Are the Working Women in Canada’s Top 1%? Analytical Studies Branch Research Paper Series, no. 414. Statistics Canada Catalogue no. 11F0019M. Ottawa: Statistics Canada.
Robb, A.M. 2002. “Entrepreneurial performance by women and minorities: The case of new firms.”Journal of Developmental Entrepreneurship 7 (4): 383.
Robb, A.M., and J. Watson. 2012. “Gender differences in firm performance: Evidence from new ventures in the United States.” Journal of Business Venturing 27 (5): 544–558.
Rollin, A.-M. 2012. Firm Dynamics: Employment Dynamics Arising from Firm Growth and Contraction in Canada, 2001 to 2009. The Canadian Economy in Transition Series, no. 28. Statistics Canada Catalogue no. 11-622-M. Ottawa: Statistics Canada.
Rosa, J.M., and D. Sylla. 2016. A Comparison of the Performance of Female-owned and Male-owned Small and Medium Enterprises. Report from the Centre for Special Business Projects.
Rosa, P., S. Carter, and D. Hamilton. 1996. “Gender as a determinant of small business performance: Insights from a British study.” Small Business Economics 8 (6): 436–478.
Scarpetta, S., P. Hemmings, T. Tressel, and J. Woo. 2002. The Role of Policy and Institutions for Productivity and Firm Dynamics: Evidence from Micro and Industry Data. OECD Working Paper no. 329.
Schumpeter, J. 1912. The Theory of Economic Development. Harvard Economic Studies, no. 46. Cambridge, Massachusetts: Harvard University Press.
Schumpeter, J. 1943. Capitalism, Socialism and Democracy. New York: Harper.
Watson, J. 2002. “Comparing the performance of male- and female-controlled businesses: Relating outputs to inputs.” Entrepreneurship Theory and Practice 26 (3): 91–100.
Watson, J., and S. Robinson. 2003. “Adjusting for risk in comparing the performance of male- and female-controlled SMEs.” Journal of Business Venturing 18 (6): 773–788.
- Date modified: