
Analytical Studies Branch Research Paper Series
Automation and Job Transformation in Canada: Who’s at Risk?

Archived Content
Information identified as archived is provided for reference, research or recordkeeping purposes. It is not subject to the Government of Canada Web Standards and has not been altered or updated since it was archived. Please "contact us" to request a format other than those available.
Abstract
Recent significant advances in artificial intelligence have raised questions about the role of workers in an era when robots and algorithms are increasingly able to perform many job duties, including those previously believed to be non-automatable. The COVID-19 pandemic have added to these concerns, as businesses may turn to new automation technology to perform a broader range of work activities traditionally done by human workers. While previous studies have estimated the share of Canadian workers at high risk of automation-related job transformation, this study is the first to examine in great detail the automation risks faced by different groups of workers. This study applies an approach similar to the one developed by Frey and Osborne (2013) and Arntz, Gregory and Zierahn (2016) to Canadian data. Results suggest that, overall, 10.6% of Canadian workers were at high risk (probability of 70% or higher) of automation-related job transformation in 2016, while 29.1% were at moderate risk (probability of between 50% and 70%). Several groups had a relatively higher share of workers who were at high risk, including those who were older (55 or above), had no postsecondary credentials or postsecondary credentials in certain fields, had low literacy or numeracy proficiency, had low employment income, or were employed part time, in small firms, in certain occupations (e.g., Office support occupations), or in the manufacturing sector. One specific finding of interest is that Business, management and public administration and Health and related fields graduates faced the highest automation-related job transformation risks among postsecondary certificate and diploma holders, but they were among the groups facing the lowest risks when looking at postsecondary degree holders.
Executive summary
The recent development of several artificial intelligence applications—such as driverless vehicles, robo-writers and computer-aided medical diagnostics—has led to concerns about the role of human workers in the future workforce. The COVID-19 pandemic has added to these concerns, as businesses may turn to new artificial intelligence technologies to perform work activities not traditionally regarded as automatable, such as social tasks. Although the risk of automation-related job transformation is typically not distributed equally across different groups of workers, the economic consequences of the COVID-19 pandemic may be far-reaching, and could affect workers across a broad range of industries (Muro, Maxim and Whiton 2020). While previous studies have estimated the share of Canadian workers at high risk of automation-related job transformation, this study is the first to examine in great detail the automation risks faced by different groups of workers.
This study adopts a methodology similar to the one developed by Frey and Osborne (2013) and Arntz, Gregory and Zierahn (2016), and applies it to the 2016 Longitudinal and International Study of Adults, Wave 3. Frey and Osborne (2013) estimated the probability that jobs held by workers could be fully automated, based largely on input from artificial intelligence experts. Arntz, Gregory and Zierahn (2016) expanded on this by estimating adjusted automation risks in a model that took into account a broad range of job tasks and worker and firm characteristics.
This study estimates the risk faced by paid Canadian workers, after accounting for tasks, and the risk faced by specific groups of workers. It is important to note that these risk estimates are largely based on the technological feasibility of automating job tasks. There are several reasons why employers may not immediately replace humans with robots, even if it is technologically feasible to do so. These reasons include financial, legal and institutional factors; shortages in complementary skills; and product demand‑side considerations. Consequently, a high risk of automation does not necessarily imply a high risk of job loss. At the very least, it could imply a certain degree of job transformation, which is the terminology used in this study.
Results suggest that, overall, 10.6% of Canadian workers were at high risk (probability of 70% or higher) of automation-related job transformation in 2016, while 29.1% were at moderate risk (probability of between 50% and 70%). Several groups had a relatively higher share of workers who were at high risk, including those who were older (55 or above), had no postsecondary credentials or postsecondary credentials in certain fields, had low literacy or numeracy proficiency, had low employment income, or were employed part time, in small firms, in certain occupations (e.g. Office support occupations), or in the manufacturing sector. One specific finding of interest is that Business, management and public administration and Health and related fields graduates faced the highest automation-related job transformation risks among postsecondary certificate and diploma holders, but they were among the groups facing the lowest risks when looking at postsecondary degree holders.
Future research could estimate the extent to which workers classified as being at risk of automation‑related job transformation were displaced from their job soon thereafter, or participated in retraining. Another avenue for follow‑up research could examine why certain groups of workers face a higher risk of automation-related job transformation. Finally, it could also be useful to investigate how artificial intelligence has resulted in emerging occupations, shifted the composition of existing occupations, or changed the tasks performed by workers.
1 Introduction
Technological advancement has been a feature of developing economies for millennia. With the onset of the industrial revolution in the 18th century, the speed of technological progress began to increase significantly. Most early industrial activities were fairly labour intensive, and new technology facilitated these tasks and allowed workers to focus on more cerebral goals (e.g., operating machines rather than performing the tasks that those machines could now do). This “creative destruction” of jobs has been championed by many economists as a means of achieving higher productivity for the economy as a whole through labour specialization (i.e., machines focus on performing difficult or routine physical tasks at a relatively low cost, while humans focus on tasks that require more judgment or other forms of advanced mental processes).
In the second half of the 20th century, digital technology emerged as an important driver of change in the workplace. The consensus from the literature is that, while the advent of computers in the workplace may have replaced certain jobs linked to routine calculations (e.g., bookkeepers), it has also created considerably more new jobs in areas that complement digital technology (e.g., computer programmers). For empirical evidence, see Autor, Levy and Murnane (2003), and Graetz and Michaels (2018).
More recently, another round of digital advances—this time in the practical applications of artificial intelligenceNote —has facilitated several tasks that were traditionally considered non-automatable. Recent advances in the development of driverless vehicles, robo‑writers and computer-aided medical diagnostics have led to speculation that technology will lead to widespread adoption of new forms of automation in the workplace. The fear by some is that there may be few tasks that humans perform that robots or algorithms cannot perform at a lower cost.
The COVID-19 pandemic has added to these concerns. The closure of workplaces and the susceptibility of workers to the virus may incentivize businesses to test whether new technologies can perform a broader range of work activities, such as social tasks (Leduc and Liu 2020). Moreover, since the COVID-19 pandemic has affected many different industries, the integration of automation technology in industries which may not have traditionally employed such technology may be far-reaching (Muro, Maxim and Whiton 2020). Therefore, the consequences could be felt by a broad range of workers, and at a faster pace than previously expected.
When the changes brought on by new technology will actually happen can only be determined with time. Some researchers have made predictions of occupational growth (Lamb 2016) and skill growth (RBC 2018) based on established forecasting techniques. But even the most carefully chosen statistical methods can fail to accurately predict the future. As an example, the high-tech sector experienced considerable growth throughout the 1990s. At the turn of the 21st century, when the sector was at its peak, it appeared to be the employer of the future. As it turned out, high-tech workers experienced large‑scale permanent layoffs in 2001 (Frenette 2007), while employment in traditional industries—such as construction, and mining, quarrying, and oil and gas extraction—expanded rapidly over the following decade (Statistics Canada 2020).
There are a few known facts about the implementation of automation in the manufacturing sector.Note Data on the use of robotics suggest a global increase in robot density, defined as the number of multipurpose industrial robots in operation per 10,000 people employed in the manufacturing sector. In the Americas, robot density rose by 7% annually, on average, between 2010 and 2016. This was lower than the annual growth rate in Asia (9%), but higher than the rate in Europe (5%). In 2016, Canada was in 13th place internationally with regard to robot density (145 robots in use per 10,000 employees). The Republic of Korea (631) was in first place, followed by Singapore (488) in second place. The United States (189) was in seventh place. Canada was ahead of France (132) in 18th place, and Australia (83) in 21st place. The worldwide average was 74 units per 10,000 employees.
This study will advance knowledge of automation risks in the Canadian workplace by attempting to answer the following question: “Which Canadian workers face greater automation‑related risks?” Understanding who is at risk is important for policy. As technology improves and more tasks become automated, it is likely that different types of workers will be affected along the way. When the earliest forms of technology were being implemented, manual labourers were likely the most affected. As digitization increasingly underpins most new forms of technological advancements, more cerebral tasks (and the human workers performing them) may be affected. Whether these workers will lose their jobs as a result of automation cannot be answered by any empirical approach. That being said, these workers may experience a certain degree of job transformation that results from performing different tasks.
The most often cited work on the degree of automation-related risks for jobs is the study by Frey and Osborne (2013), which estimated the degree to which occupations in the U.S. 2010 Standard Occupational Classification (SOC 2010) were susceptible to automation (or computerization). They found that 47% of all U.S. workers faced a probability higher than 70% of automation within the next 10 or 20 years. One critique of this approach is that it relies largely on an initial binary classification of selected occupations (i.e., fully automatable or not automatable), although some adjustments were made for a small number of tasks associated with each job.
In work for the Organisation for Economic Co-operation and Development (OECD), Arntz, Gregory and Zierahn (2016) estimated an adjusted version of the Frey and Osborne (2013) index that was more thorough in accounting for the fact that occupations comprise different tasks—some of which are automatable. The adjusted version also accounted for differences in firm and individual characteristics within occupations. Based on this approach, the authors found that only 9% of U.S. jobs were at high risk of automation (i.e., probability of automation higher than 70%). The authors also derived estimates for other OECD member countries, and found that 9% of Canadian jobs were at high risk of automation.
The current study will also adjust the Frey and Osborne (2013) index for tasks, similar to the study by Arntz, Gregory and Zierahn (2016). However, it will apply this approach to more recent Canadian data from the Longitudinal and International Study of Adults (LISA), Wave 3, conducted in 2016.Note More importantly, this study will also closely examine differences in automation risk across several worker and firm characteristics.Note
The next section presents the methods, and the following section presents the results. The study then concludes with a brief summary of the results, and with suggestions for follow‑up work in this area.
2 Methods
The objective of this study is to estimate the degree of automation risk faced by different groups of Canadian workers. This involves two steps. The first step is to select a method for determining the risk of automation. The second step is to apply the chosen method to recent Canadian data that are capable of supporting the derivation of the automation risk estimates by various worker and firm characteristics.
Estimating the degree of automation risk among the workforce is an emerging area of research. The study by Frey and Osborne (2013) is the most widely cited work in this area. It was based on the 2010 Occupational Information Network (O*NET) data file, which contains 913 occupations. These occupations correspond closely to the SOC 2010 structure. After six-digit SOC 2010 codes that were missing from O*NET were dropped, 702 codes remained. Working closely with a group of machine-learning and engineering researchers, Frey and Osborne (2013) began by subjectively labelling 70 of the remaining 702 SOC 2010 codes as automatable (1) or not automatable (0). The 70 occupations were hand-picked based on a high degree of confidence, following consultations with the experts.Note Note Next, the relationship between the probability of being automatable and nine O*NET task variables was modelled. These nine task variables captured three “engineering bottlenecks to computerisation” (Frey and Osborne 2013, p. 23), namely, perception and manipulation, creativity, and social intelligence.Note The predicted probabilities were then assigned to the 702 occupations. The O*NET data were then linked to the U.S. Bureau of Labor Statistics’ 2010 Quarterly Census of Employment and Wages to estimate the proportion of the U.S. workforce with jobs that were at high risk (at least 70%) of automation. Overall, 47% of U.S. workers had jobs that fell under this category.
Arntz, Gregory and Zierahn (2016) critiqued the approach of Frey and Osborne (2013) because of the largely binary occupation description. In their view, jobs with the same occupational code may be heterogeneous because of different tasks required, different types of workers performing those tasks, and different firms employing the workers. Frey and Osborne (2013) accounted for differences in only nine tasks, and did not account for worker or employer characteristics. Arntz, Gregory and Zierahn (2016) began by applying the Frey and Osborne (2013) risk probabilities to the 2012 Programme for the International Assessment of Adult Competencies (PIAAC) and found that 38% of U.S. workers had jobs at high risk of automation. Next, they regressed the probabilities on 25 O*NET task variables, and several worker-level and firm-level characteristics, using a fractional response model.Note The predicted probabilities from the model varied not only by occupation, but also by worker within occupations. In contrast to the results of Frey and Osborne (2013), Arntz, Gregory and Zierahn (2016) found that only 9% of U.S. and Canadian workers had jobs that were at high risk of automation.Note
This study’s approach largely follows the one by Arntz, Gregory and Zierahn (2016). First, the Frey and Osborne (2013) automation risk probabilities were assigned to workers in the 2016 LISA, based on their occupation. Since the Frey and Osborne (2013) data are based on the SOC 2010, and LISA data are based on the 2011 National Occupational Classification (NOC 2011), an SOC 2010 to NOC 2011 concordance was applied.Note The matching was based on the similarity of the occupational titles. Of the 500 NOC 2011 codes, 5 had to be dropped since they did not have a U.S. equivalent, while a further 12 had to be dropped because none of the corresponding SOC 2010 codes were populated with automation risk data based on the Frey and Osborne approach. Of the remaining 483 codes, 233 were matched to only one SOC 2010 (i.e., only one six-digit SOC 2010 code matched to one or more four-digit NOC 2011 codes). In these cases, the automation risk associated with the SOC 2010 code by the Frey and Osborne approach was also assigned to the corresponding NOC 2011 code. The remaining 250 NOC 2011 codes matched to more than one SOC 2010 code, in which case an unweighted average of the automation risk values across SOC 2010 codes was taken.Note
Once each of the 483 NOC 2011 codes were assigned an automation risk from the work by Frey and Osborne (2013), they were matched to the 2016 LISA data file by the NOC 2011 code. The sample was limited to paid workersNote aged 18 or older with valid responses for all of the variables used in the analysis (described below). This resulted in a sample of 2,267.
The automation risk from Frey and Osborne (2013) was then regressed on the following 25 task frequencies in LISA, using a probit fractional response model: cooperating or collaborating, sharing information, instructing, making speeches, selling products or services, advising people, planning and organizing own activities, planning and organizing activities of others, planning and organizing own time, persuading or influencing people, negotiating with people, solving problems of less than 5 minutes, solving problems of less than 30 minutes, performing physical work for a long period of time, using skill or accuracy with hands or fingers, reading directions or instructions, reading journals or scholarly publications, reading books, reading manuals or reference materials, writing articles for newspapers or newsletters, filling in forms, using advanced mathematics, using the Internet for work-related issues, using a programming language, and participating in real-time discussions on the Internet.Note Note
From this model, the predicted probability of facing a high risk (70% or more) of automationNote was recovered for each individual in the sample, and used to produce automation risk estimates for the full sample of workers and for various subsamples. Table A.1 in the appendix provides sample statistics for many of the variables used to derive these subsamples, including sex, age, highest level of completed education, field of study (among postsecondary graduates), literacy and numeracy,Note immigration status, disability status, work hours, union membership or collective bargaining agreement coverage, and firm size. In other appendix tables, results are also broken down by occupation, industry and percentile of employment income.
Differences in the automation risk faced by the various groups of workers are unconditionally derived. For example, differences by sex in the risk of automation will result in part from differences by sex in key factors related to automation risk (educational attainment, age, etc.). Therefore, these results will show to what extent the jobs of different groups of workers are at high risk of automation, given the workers’ characteristics. This is useful for identifying workers at greater risk. Further analysis would be needed to uncover the main reasons behind these differences.
Note that all of the estimates used in the study are based on 1,000 bootstrap weights because of the stratified, multistage, multi-phase sampling approach used in the 2016 LISA.Note
The decision to include different variables in the model affects the interpretation of the resulting automation risk estimates. The original Frey and Osborne risk estimates were simply based on the technological feasibility of automating the occupation. However, experts were asked to assign the feasibility at the occupational level. Frey and Osborne (2013) adjusted for some differences in occupational tasks, but Arntz, Gregory and Zierahn (2016) went further. These adjustments for tasks still resulted in automation risk estimates that were based on the technological feasibility of automation, but they were more precise since they were based on job tasks rather than on occupations.
There are several reasons why employers may not immediately replace humans with robots, even if it is technologically feasible to do so.
First, firms must have the capacity to invest in the technology. This may largely depend on firm size, which Arntz, Gregory and Zierahn (2016) take into account. However, firm size may not fully capture the firm’s investment capabilities. Next, there are legal restrictions to consider. This is particularly relevant for government-regulated industries, such as public transportation or healthcare. Even with legal approval, institutional factors may slow down the adoption of automated technology. For example, union contracts may have a no-layoff stipulation or an expensive buyout clause that effectively increases the costs of adopting the new technology. Arntz, Gregory and Zierahn (2016) account for the government sector, but not for unions. Of course, legal restrictions may also affect non-government sectors, depending on the product in question. The new technology may also require skilled human labour to operate, and this may not always be available. Employers must also consider their clientele’s appetite for automated technology. In the end, society may need to reach a certain comfort level with driverless public transit or robo-doctors. Many of the factors above are likely unobservable. Arntz, Gregory and Zierahn (2016) also include worker characteristics, such as sex, age and education level. It is not clear what role these factors play in the model, other than to try to account for unobserved heterogeneity.
In contrast, adjusting for the tasks related to each occupation plays a clearer role in the interpretation of the automation risks estimates. Specifically, the task-adjusted estimates relate strictly to the technological feasibility of automating the occupation as a whole (i.e., by accounting for its inherent tasks). Beyond that, it may be challenging to try to account for the actual probability that firms will adopt automation technology. Consequently, this study opts to simply adjust for a broad range of tasks, and interprets the results as the risk of automation-related job transformation. In other words, workers at higher risk may be more likely to experience job transformation, which may or may not involve job loss. The degree of job transformation will depend on the degree of adoption, based on the firm’s financial ability to invest in the technology, and the legal and societal constraints placed upon them. Adding to this complex decision is the COVID-19 pandemic and the uncertainties it has created around having human workers in the workplace. The threat of further waves of the disease or of future pandemics may expedite investments in new technology in an effort to reduce risks.
3 Results
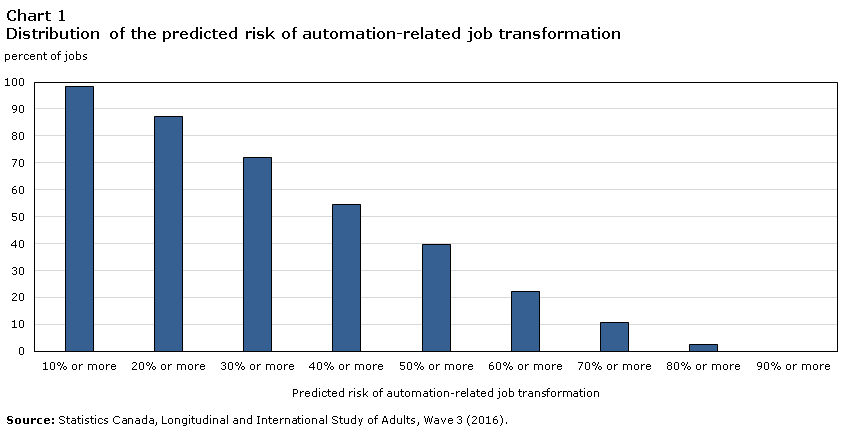
The distribution of the predicted risk of automation-related job transformation faced by Canadian workers in 2016 appears in Chart 1. The majority of workers faced at least some risk—the predicted risk was at least 10% for 98.2% of the paid workforce. However, only 10.6% were at high risk (70% or more), and about one-quarter (29.1%) of workers were at moderate risk (50% to 70%).
Data table for Chart 1
| Predicted risk of automation-related job transformation |
Percent of jobs |
|---|---|
| percent | |
| 10% or more | 98.2 |
| 20% or more | 87.3 |
| 30% or more | 71.9 |
| 40% or more | 54.4 |
| 50% or more | 39.7 |
| 60% or more | 22.1 |
| 70% or more | 10.6 |
| 80% or more | 2.6 |
| 90% or more | 0.0 |
| Source: Statistics Canada, Longitudinal and International Study of Adults, Wave 3 (2016). | |
The remainder of this study will focus on the share of workers in different groups who were at high risk of automation-related job transformation (i.e., 70% or more, in line with Frey and Osborne [2013] and Arntz, Gregory and Zierahn [2016]).Note
The subgroup analysis begins with occupations since they largely determine the automation risks and, therefore, provide good context for the results to follow. Table A.2 in the appendix shows these shares by two-digit NOC 2011 code, and these shares are also shown in descending order in Chart 2.Note
The Office support occupations group—which mainly consists of different types of clerks and receptionists—had the highest concentration of workers who were at high risk of job transformation, at 35.7%. This was almost twice as high as for any other occupation. Next, 20.0%Note of workers in the Service supervisors and specialized service occupations group (food service supervisors, chefs, butchers, hairstylists, tailors, shoe repairers, etc.) were at high risk, followed by 19.7% of workers in Industrial, electrical and construction trades. Also facing above-average risks were the Sales representatives and salespersons—wholesale and retail trade group, at 14.7%; Service representatives and other customer and personal services occupations, at 13.7% (e.g., food and beverage services, travel and accommodation services, security guards, customer service representatives); and Maintenance and equipment operation trades, at 13.2%. Thus, occupations facing above-average risks of automation-related job transformation were largely associated with non‑professional administrative functions (e.g., clerk or salesperson), and various trades, whether in personal services (e.g., butcher) or in heavy industrial trades (e.g., electrician).
At the other end of the spectrum were several professional occupations in which virtually no one faced a high risk of automation-related job transformation. These included Professional occupations in law and social, community and government services; Professional occupations in education services; and Specialized middle management occupations in administrative services, financial and business services, and communications (except broadcasting). All were at 0.0%. Other occupations at low risk included Professional occupations in business and finance (0.8%), and Professional occupations in natural and applied sciences (0.9%).

Data table for Chart 2
| Occupation | Predicted share of workers |
|---|---|
| percent | |
| Office support occupations | 35.7 |
| Service supervisors and specialized service occupations | 20.0 |
| Industrial, electrical and construction trades | 19.7 |
| Sales representatives and salespersons—wholesale and retail trade | 14.7 |
| Service representatives and other customer and personal services occupations | 13.7 |
| Maintenance and equipment operation trades | 13.2 |
| Administrative and financial supervisors and administrative occupations | 11.3 |
| Technical occupations in health | 8.2 |
| Paraprofessional occupations in legal, social, community and education services | 6.4 |
| Technical occupations related to natural and applied sciences | 4.4 |
| Retail sales supervisors and specialized sales occupations | 1.8 |
| Professional occupations in natural and applied sciences | 0.9 |
| Professional occupations in business and finance | 0.8 |
| Specialized middle management occupations | 0.0 |
| Professional occupations in education services | 0.0 |
| Professional occupations in law and social, community and government services | 0.0 |
|
Note: Specialized middle management occupations in administrative services, financial and business services, and communications (except broadcasting). Source: Statistics Canada, Longitudinal and International Study of Adults, Wave 3 (2016). |
|
Table A.3 in the appendix shows the predicted share of workers at high risk of automation-related job transformation along various dimensions. Men and women were equally likely to face a high risk (10.7% and 10.6%, respectively), which is interesting since women were more likely to be in Office support occupations, which faced the highest risks. Indeed, 7.8% of women in the analytical sample worked in Office support occupations, compared with only 0.9% of men. This is somewhat counterbalanced by the fact that the occupational group with the third-highest level of risk, Industrial, electrical and construction trades, was male dominated (4.1% of men in the sample worked in such occupations, compared with only 0.3% of women).
The risk of automation-related job transformation varied more by age group (Table A.3 and Chart 3). Specifically, 13.3% of workers between the ages of 18 and 24, and 14.6% of those 55 or older, were in jobs that are at high risk. In contrast, 7.6% of workers aged 25 to 34, and 10.1% of workers aged 35 to 54, were in jobs at high risk. Differences between the middle age groups (ages 25 to 34 and 35 to 54) and the 55-or-older group were statistically significant at 5%. Differences between the 18-to-24 age group and the 35-to-54 age group were not statistically significant. The difference between the 18-to-24 age group and the 25-to-34 age group was significant only at 10%. With this in mind, this chart’s U-shape is perhaps unsurprising. Generally, young workers have not completed their education and, as a result, may end up performing tasks that are routine in nature and are thus highly susceptible to automation. Conversely, older workers have generally been out of school for some time, so they may not have had the opportunity to train for more modern jobs that are less susceptible to automation. In this case, it may be the job that is more at risk than the worker occupying it, since older workers may retire before automation has significantly affected the job.

Data table for Chart 3
| Age group (years) | Predicted share of workers |
|---|---|
| percent | |
| 18 to 24 | 13.3 |
| 25 to 34 | 7.6 |
| 35 to 54 | 10.1 |
| 55 or older | 14.6 |
| Source: Statistics Canada, Longitudinal and International Study of Adults, Wave 3 (2016). | |
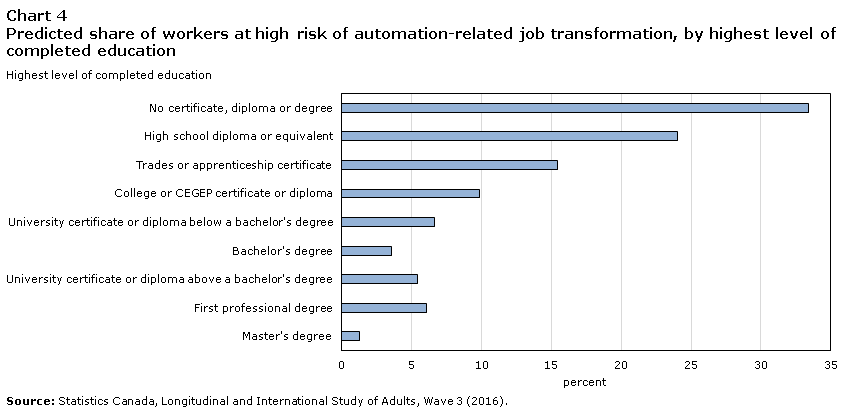
Large differences in the probability of facing a high risk of automation-related job transformation also existed by highest level of completed education (Chart 4). Generally, more highly educated workers faced a lower risk. While 33.4% of workers with no certificate, diploma or degree, and 24.1% of workers with a high school diploma, faced a high risk, only 3.6% of workers with a bachelor’s degree and 1.3% with a master’s degree were in the same position.Note The differences between workers with a high school diploma or less and workers with a bachelor’s or master’s degree were statistically significant at 0.1%. Since more highly educated workers were more likely to be professionally employed (see Chart 2), it follows that they faced lower risks of automation-related job transformation.
Data table for Chart 4
| Highest level of completed education |
Predicted share of workers |
|---|---|
| percent | |
| Master's degree | 1.3 |
| First professional degree | 6.1 |
| University certificate or diploma above a bachelor's degree | 5.5 |
| Bachelor's degree | 3.6 |
| University certificate or diploma below a bachelor's degree | 6.7 |
| College or CEGEP certificate or diploma | 9.9 |
| Trades or apprenticeship certificate | 15.4 |
| High school diploma or equivalent | 24.1 |
| No certificate, diploma or degree | 33.4 |
| Source: Statistics Canada, Longitudinal and International Study of Adults, Wave 3 (2016). | |
Although some results could be generated by field of study, this was limited by small sample sizes (fewer than 50) in certain cases (Table A.3). Nevertheless, some interesting insights emerge. For example, among workers with a postsecondary certificate or diploma, Mathematics, computer and information sciences graduates, and Personal, protective and transportation services graduates were the least likely to be at high risk of automation-related job transformation (both under 7.0%). At the opposite end of the spectrum, Business, management and public administration graduates, and Health and related fields graduates were the most likely to be at high risk (over 12.0% in both cases).
Among workers with a postsecondary degree,Note graduates from every discipline that could be examined faced below-average risks (in all cases, under 5.0% of graduates were at high risk). Workers who graduated from Education (1.0%), Health and related fields (1.8%), and Business, management and public administration (2.2%) programs had the lowest probability of facing a high risk.
Another interesting finding is that Business, management and public administration and Health and related fields graduates faced the highest automation-related job transformation risks among postsecondary certificate and diploma holders, but they were among the groups facing the lowest risks when looking at postsecondary degree holders. This might imply differences in the share of these graduates who landed jobs related to their education, or differences in the types of jobs that were related to the programs.
For example, college business programs are varied, but include office administration, which is part of Office support occupations (and ranked highest in automation risk according Chart 2).Note
Literacy and numeracy are also important factors in the risk of automation-related job transformation. Since both are so highly correlated with the level of educational attainment, these factors are estimated by level of education (Table A.3). Among workers with no postsecondary qualifications, or with a postsecondary certificate, diploma or degree, those with a proficiency level of 3 or above (out of a maximum level of 5) were considerably less likely to be at high risk of automation-related job transformation, although the results are not always statistically significant. All results were significant at the 5% level, with the exception of numeracy among those with no postsecondary qualifications, and literacy among those with a postsecondary degree (both not significant at 10%).
The automation risks are also broken down in Table A.3 by immigration status, disability status and union membership (or coverage by a collective bargaining agreement). The predicted automation risks between the various categories were small and, in each case, not statistically significant at the 10% level.
The remaining work-related characteristics shown in Table A.3 reveal some interesting differences. For example, 25.7% of part-time workers were at high risk of automation-related job transformation, compared with only 8.7% of full-time workers (the difference was significant at 0.1%).
Workers at high risk were also more likely to earn low employment income. Approximately one-quarter (26.8%) of workers in the bottom 10% of the distribution of employment income were at high risk. In contrast, only 2.1% of workers in the top 10% of the employment income distribution were at high risk. In fact, there is a clear, negative and monotonic relationship between employment income and the probability of being at high risk of automation-related job transformation (Chart 5). All differences between those in the bottom 10% of the distribution and the other groups were statistically significant at the 1% level, with the exception of those in the second-to-bottom group (between the 10th and 25th percentiles— significant at 5%).

Data table for Chart 5
| Percentile of employment income | Predicted share of workers |
|---|---|
| percent | |
| Below 10th | 26.8 |
| 10th to below 25th | 16.6 |
| 25th to below 50th | 13.7 |
| 50th to below 75th | 5.5 |
| 75th to below 90th | 3.1 |
| 90th or above | 2.1 |
| Source: Statistics Canada, Longitudinal and International Study of Adults, Wave 3 (2016). | |
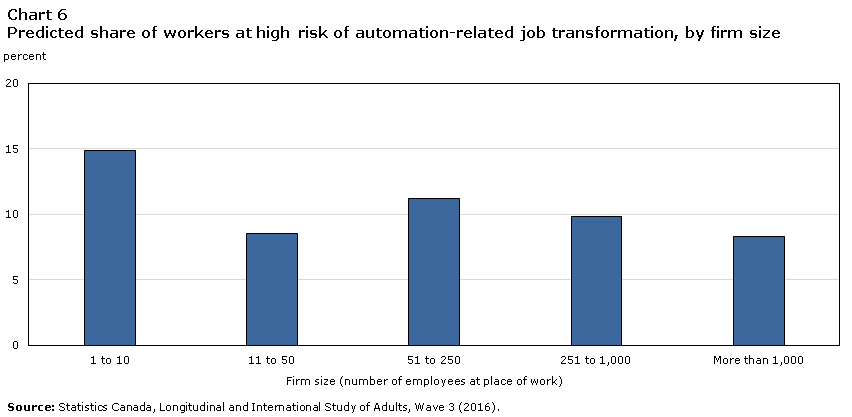
Adopting automation-enabled technology in the workplace may involve considerable financial investment by firms. Larger firms may have an advantage in securing the capital stock required. Therefore, automation may already be in place in those firms, leaving human workers to perform non-automatable tasks. The results shown in Chart 6 are mostly consistent with this line of thinking, as 14.9% of workers in small firms (those with 10 employees or fewer) faced a high risk of automation-related job transformation, compared with only 8.3% of workers in large firms (firms with 1,000 employees or more). This difference was statistically significant at the 5% level. However, if firms with 10 employees or fewer are excluded, there is little to no relationship between firm size and the probability of facing a high risk of automation-related job transformation.
Data table for Chart 6
| Firm size (number of employees at place of work) |
Predicted share of workers |
|---|---|
| percent | |
| 1 to 10 | 14.9 |
| 11 to 50 | 8.6 |
| 51 to 250 | 11.2 |
| 251 to 1,000 | 9.8 |
| More than 1,000 | 8.3 |
| Source: Statistics Canada, Longitudinal and International Study of Adults, Wave 3 (2016). | |
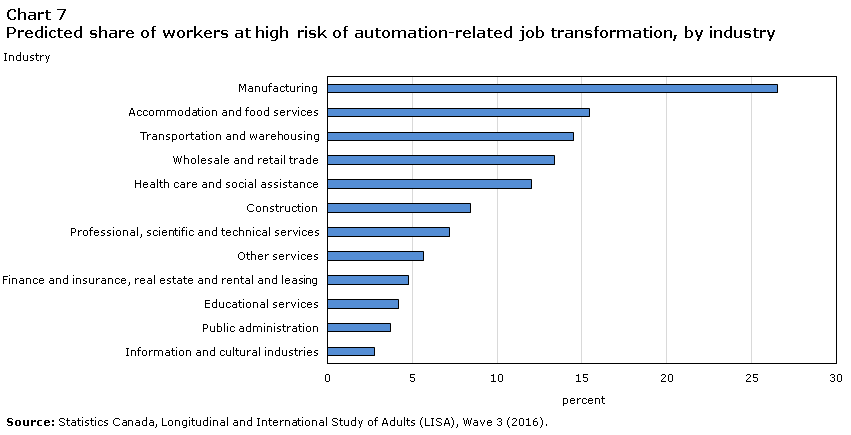
The differences in the risks faced by workers in various industries were also considerable (Chart 7). For example, workers in the Manufacturing industry faced the highest risk (26.6% probability of facing a high risk), which was significantly higher than that of workers in all other industries at the 5% level, with the exception of workers in Accommodation and food services (15.4%, significantly different from Manufacturing at the 10% level). At the opposite end of the spectrum, groups with a low share of workers at high risk included those in Information and cultural industries (2.8%); Public administration (3.7%); Educational services (4.2%); and Finance and insurance, real estate and rental and leasing (4.8%).
Data table for Chart 7
| Industry | Predicted share of workers |
|---|---|
| percent | |
| Manufacturing | 26.6 |
| Accommodation and food services | 15.4 |
| Transportation and warehousing | 14.5 |
| Wholesale and retail trade | 13.4 |
| Health care and social assistance | 12.0 |
| Construction | 8.4 |
| Professional, scientific and technical services | 7.2 |
| Other services | 5.6 |
| Finance and insurance, real estate and rental and leasing | 4.8 |
| Educational services | 4.2 |
| Public administration | 3.7 |
| Information and cultural industries | 2.8 |
| Source: Statistics Canada, Longitudinal and International Study of Adults (LISA), Wave 3 (2016). | |
4 Conclusion
The goal of this study was to identify the characteristics of Canadian workers at high risk of automation‑related job transformation, based on an approach similar to the one developed by Frey and Osborne (2013) and Arntz, Gregory and Zierahn (2016).
Overall, 10.6% of Canadian workers were at high risk (probability of 70% or higher) of automation-related job transformation in 2016, while 29.1% were at moderate risk (probability of between 50% and 70%). Several groups had a relatively higher share of workers who were at high risk, including those who were older (55 or above), had no postsecondary credentials or postsecondary credentials in certain fields, had low literacy or numeracy proficiency, had low employment income, or were employed part time, in small firms, in certain occupations (e.g., Office support occupations), or in the manufacturing sector. One specific finding of interest is that Business, management and public administration and Health and related fields graduates faced the highest automation-related job transformation risks among postsecondary certificate and diploma holders, but they were among the groups facing the lowest risks when looking at postsecondary degree holders.
Since these risks are based solely on the feasibility of adopting technology for automation, it is unclear how these results relate to the probability of job loss. Additionally, the extent to which businesses invest in automation technologies as a response to the COVID-19 pandemic is still unknown. Therefore, a useful next step for research would be to estimate the extent to which workers classified as being at risk of automation-related job transformation were displaced from their job soon thereafter. Moreover, how many of those affected workers adjusted by retraining, as opposed to finding another job directly?
Future research could also investigate the underlying reasons why the risk of automation is higher among certain groups of workers.
Finally, it could also be useful to investigate how artificial intelligence has resulted in emerging occupations, shifted the composition of existing occupations, or changed the tasks performed by workers.
5 Appendix: Tables
| Statistics | |
|---|---|
| percent | |
| Female | 51.3 |
| Age group (years) | |
| 18 to 24 | 6.0 |
| 25 to 34 | 21.2 |
| 35 to 54 | 53.1 |
| 55 or older | 19.6 |
| Highest level of completed education | |
| No certificate, diploma or degree | 2.8 |
| High school diploma or equivalent | 16.6 |
| Trades or apprenticeship certificate | 9.0 |
| College or CEGEP certificate or diploma | 26.9 |
| University transfer program | 0.2 |
| University certificate or diploma below a bachelor's degree | 4.3 |
| Bachelor's degree | 23.3 |
| University certificate or diploma above a bachelor's degree | 4.5 |
| First professional degree | 2.2 |
| Master's degree | 9.1 |
| Doctoral degree | 1.1 |
| mean | |
| Literacy | 293.3 |
| Numeracy | 285.6 |
| percent | |
| Immigration status | |
| Canadian-born | 79.4 |
| Long-term immigrant (10 or more years in Canada) | 13.7 |
| Recent immigrant (less than 10 years in Canada) | 6.9 |
| Disabled | 14.3 |
| Part-time worker | 11.6 |
| Union member or covered by a collective bargaining agreement | 29.3 |
| Firm size (number of employees at place of work) | |
| 1 to 10 | 20.2 |
| 11 to 50 | 31.0 |
| 51 to 250 | 25.4 |
| 251 to 1,000 | 13.7 |
| More than 1,000 | 9.7 |
| number | |
| Sample size | 2,267 |
| Source: Statistics Canada, Longitudinal and International Study of Adults, Wave 3 (2016). | |
| Occupation titleTable A.2 Note 1 | Predicted share of workers | |
|---|---|---|
| percent | bootstrap standard error | |
| Office support occupations | 35.7 | 6.1 |
| Service supervisors and specialized service occupations | 20.0 | 7.8 |
| Industrial, electrical and construction trades | 19.7 | 7.9 |
| Sales representatives and salespersons—wholesale and retail trade | 14.7 | 4.1 |
| Service representatives and other customer and personal services occupations | 13.7 | 4.1 |
| Maintenance and equipment operation trades | 13.2 | 4.8 |
| Administrative and financial supervisors and administrative occupations | 11.3 | 2.6 |
| Technical occupations in health | 8.2 | 3.4 |
| Paraprofessional occupations in legal, social, community and education services | 6.4 | 3.2 |
| Technical occupations related to natural and applied sciences | 4.4 | 2.0 |
| Retail sales supervisors and specialized sales occupations | 1.8 | 1.3 |
| Professional occupations in natural and applied sciences | 0.9 | 0.9 |
| Professional occupations in business and finance | 0.8 | 0.7 |
| Specialized middle management occupationsTable A.2 Note 2 | 0.0 | 0.0 |
| Professional occupations in education services | 0.0 | 0.0 |
| Professional occupations in law and social, community and government services | 0.0 | 0.0 |
|
||
| Predicted share of workers | ||
|---|---|---|
| percent | bootstrap standard error |
|
| Sex | ||
| Male | 10.7 | 1.2 |
| Female | 10.6 | 1.1 |
| Age group (years) | ||
| 18 to 24 | 13.3 | 2.9 |
| 25 to 34 | 7.6 | 1.4 |
| 35 to 54 | 10.1 | 1.1 |
| 55 or older | 14.6 | 2.0 |
| Highest level of completed education | ||
| No certificate, diploma or degree | 33.4 | 7.5 |
| High school diploma or equivalent | 24.1 | 2.9 |
| Trades or apprenticeship certificate | 15.4 | 2.7 |
| College or CEGEP certificate or diploma | 9.9 | 1.5 |
| University transfer program | Table A.3 Note ‡ | Table A.3 Note ‡ |
| University certificate or diploma below a bachelor's degree | 6.7 | 2.6 |
| Bachelor's degree | 3.6 | 0.7 |
| University certificate or diploma above a bachelor's degree | 5.5 | 3.3 |
| First professional degree | 6.1 | 3.5 |
| Master's degree | 1.3 | 1.0 |
| Doctoral degree | Table A.3 Note ‡ | Table A.3 Note ‡ |
| Field of study (among postsecondary certificate or diploma holders) | ||
| Personal improvement | Table A.3 Note ‡ | Table A.3 Note ‡ |
| Education | Table A.3 Note ‡ | Table A.3 Note ‡ |
| Visual and performing arts and communications technologies | Table A.3 Note ‡ | Table A.3 Note ‡ |
| Humanities | Table A.3 Note ‡ | Table A.3 Note ‡ |
| Social and behavioural sciences and law | 10.0 | 4.3 |
| Business, management and public administration | 13.2 | 2.6 |
| Physical and life sciences and technologies | Table A.3 Note ‡ | Table A.3 Note ‡ |
| Mathematics, computer and information sciences | 3.1 | 2.0 |
| Architecture, engineering and related technologies | 9.6 | 2.1 |
| Agriculture, natural resources and conservation | Table A.3 Note ‡ | Table A.3 Note ‡ |
| Health and related fields | 12.9 | 4.4 |
| Personal, protective and transportation services | 6.6 | 3.0 |
| Other / not stated | Table A.3 Note ‡ | Table A.3 Note ‡ |
| Field of study (among postsecondary degree holders) | ||
| Personal improvement | Table A.3 Note ‡ | Table A.3 Note ‡ |
| Education | 1.0 | 0.8 |
| Visual and performing arts and communications technologies | Table A.3 Note ‡ | Table A.3 Note ‡ |
| Humanities | 4.6 | 2.2 |
| Social and behavioural sciences and law | 3.9 | 1.6 |
| Business, management and public administration | 2.2 | 1.0 |
| Physical and life sciences and technologies | 4.7 | 2.6 |
| Mathematics, computer and information sciences | Table A.3 Note ‡ | Table A.3 Note ‡ |
| Architecture, engineering and related technologies | 3.1 | 1.8 |
| Agriculture, natural resources and conservation | Table A.3 Note ‡ | Table A.3 Note ‡ |
| Health and related fields | 1.8 | 1.9 |
| Personal, protective and transportation services | Table A.3 Note ‡ | Table A.3 Note ‡ |
| Other / not stated | Table A.3 Note ‡ | Table A.3 Note ‡ |
| No postsecondary qualifications | ||
| Literacy proficiency level below 3 | 32.4 | 3.8 |
| Literacy proficiency level 3 or above | 18.4 | 3.6 |
| Numeracy proficiency level below 3 | 28.7 | 3.3 |
| Numeracy proficiency level 3 or above | 20.5 | 4.7 |
| Postsecondary certificate or diploma | ||
| Literacy proficiency level below 3 | 14.8 | 2.3 |
| Literacy proficiency level 3 or above | 8.1 | 1.2 |
| Numeracy proficiency level below 3 | 15.0 | 2.1 |
| Numeracy proficiency level 3 or above | 7.1 | 1.1 |
| Postsecondary degree | ||
| Literacy proficiency level below 3 | 4.5 | 1.7 |
| Literacy proficiency level 3 or above | 2.8 | 0.6 |
| Numeracy proficiency level below 3 | 7.7 | 2.3 |
| Numeracy proficiency level 3 or above | 1.9 | 0.5 |
| Immigration status | ||
| Canadian-born | 10.7 | 0.9 |
| Long-term immigrant (10 or more years in Canada) | 10.3 | 2.1 |
| Recent immigrant (less than 10 years in Canada) | 10.5 | 3.1 |
| Disabled | ||
| Yes | 10.5 | 0.8 |
| No | 11.4 | 2.1 |
| Hours worked per week | ||
| Less than 30, but more than 0 (part-time) | 25.7 | 3.4 |
| 30 or more (full-time) | 8.7 | 0.8 |
| Union member or covered by a collective bargaining agreement | ||
| Yes | 11.9 | 1.5 |
| No | 10.1 | 0.9 |
| Employment income percentile | ||
| Below 10th | 26.8 | 3.9 |
| 10th to below 25th | 16.6 | 2.6 |
| 25th to below 50th | 13.7 | 1.8 |
| 50th to below 75th | 5.5 | 1.0 |
| 75th to below 90th | 3.1 | 0.9 |
| 90th or above | 2.1 | 1.0 |
| Firm size (number of employees at place of work) | ||
| 1 to 10 | 14.9 | 1.9 |
| 11 to 50 | 8.6 | 1.1 |
| 51 to 250 | 11.2 | 1.6 |
| 251 to 1,000 | 9.8 | 2.3 |
| More than 1,000 | 8.3 | 2.1 |
| IndustryTable A.3 Note 1 | ||
| Construction | 8.4 | 3.8 |
| Manufacturing | 26.6 | 3.8 |
| Wholesale and retail trade | 13.4 | 2.1 |
| Transportation and warehousing | 14.5 | 4.8 |
| Finance and insurance, real estate and rental and leasing | 4.8 | 1.6 |
| Professional, scientific and technical services | 7.2 | 2.3 |
| Educational services | 4.2 | 1.5 |
| Health care and social assistance | 12.0 | 2.4 |
| Information and cultural industries | 2.8 | 1.4 |
| Accommodation and food services | 15.4 | 5.5 |
| Other services | 5.6 | 3.1 |
| Public administration | 3.7 | 1.0 |
Source: Statistics Canada, Longitudinal and International Study of Adults, Wave 3 (2016). |
||
References
Arntz, M., T. Gregory, and U. Zierahn. 2016. The Risk of Automation for Jobs in OECD Countries: A Comparative Analysis. OECD Social, Employment and Migration Working Papers, no. 189. Paris: OECD Publishing.
Autor, D., H. Levy, and R. Murnane. 2003. “The skill content of recent technological change: An empirical exploration.” The Quarterly Journal of Economics 118 (4): 1279–1333.
Frenette, M. 2007. Life After the High-tech Downturn: Permanent Layoffs and Earnings Losses of Displaced Workers. Analytical Studies Branch Research Paper Series, no. 302. Statistics Canada Catalogue no. 11F0019M. Ottawa: Statistics Canada.
Frenette, M. 2019. Obtaining a Bachelor’s Degree from a College: Earnings Outlook and Prospects for Graduate Studies. Analytical Studies Branch Research Paper Series, no. 428. Statistics Canada Catalogue no. 11F0019M. Ottawa: Statistics Canada.
Frey, C.B., and M.A. Osborne. 2013. The Future of Employment: How Susceptible Are Jobs to Computerisation? Oxford Martin Programme on the Impacts of Future Technology. Oxford: Oxford Martin School, University of Oxford.
Graetz, G., and G. Michaels. 2018. “Robots at work.” The Review of Economics and Statistics 100 (5): 753–768.
IFR (International Federation of Robotics). 2018. “Robot density rises globally.” IFR Press Releases. February 7. (accessed February 10, 2020).
Lamb, C. 2016. The Talented Mr. Robot: The Impact of Automation on Canada’s Workforce. Brookfield Institute for Innovation + Entrepreneurship. Toronto: Ryerson University.
Leduc, S. and Z. Liu. 2020. “Can pandemic-induced job uncertainty stimulate automation?” Federal Reserve Bank of San Francisco Working Paper 2020-19.
Lexico. 2020. “Artificial intelligence,” US Dictionary. (accessed February 10, 2020).
Manyika, J., M. Chui, M. Miremadi, J. Bughin, K. George, P. Willmott, and M. Dewhurst. 2017. A Future that Works: Automation, Employment, and Productivity. New York: McKinsey Global Institute.
Muro, M., R. Maxim and J. Whiton. 2020. “The robots are ready as the COVID-19 recession spreads.” The Brookings Institute.
Nedelkoska, L., and G. Quintini. 2018. Automation, Skills and Training. OECD Social, Employment and Migration Working Papers, no. 202. Paris: OECD Publishing.
Oschinski, M., and R. Wyonch. 2017. Future Shock? The Impact of Automation on Canada’s Labour Market. C.D. Howe Institute Commentary, no. 472. Toronto: C.D. Howe Institute.
RBC. 2018. Humans Wanted: How Canadian Youth Can Thrive in the Age of Disruption. Toronto: RBC, Office of the CEO.
Statistics Canada. 2018. Longitudinal and International Study of Adults (LISA): Detailed information for 2016 (Wave 3). Last updated December 3, 2018. (accessed February 10, 2020).
Statistics Canada. 2020. Table 14-10-0202-01 Employment by industry, annual. Last updated February 7, 2020.
Wooldridge, J.M. 2010. Econometric Analysis of Cross Section and Panel Data. Second edition. Cambridge, Massachusetts, and London, England: The MIT Press.
- Date modified: