
Analytical Studies Branch Research Paper Series
Are Refugees More Likely to Leave Initial Destinations than Economic Immigrants? Recent Evidence from Canadian Longitudinal Administrative Data

Archived Content
Information identified as archived is provided for reference, research or recordkeeping purposes. It is not subject to the Government of Canada Web Standards and has not been altered or updated since it was archived. Please "contact us" to request a format other than those available.
Abstract
Refugee dispersal policy, adopted in a number of developed countries, is often criticized as being ineffective since it is believed that refugees who are assigned to smaller cities quickly leave their initial destination and move to larger immigrant gateway cities. However, quantitative research on the secondary migration of refugees, compared with other entry classes of immigrants, is limited. This study compares long-term secondary migration in Canada by immigrant admission category, with a focus on the size of the initial city of settlement. The analysis of the Longitudinal Immigration Database found that, although resettled refugees had a higher overall secondary migration rate than economic immigrants, the difference was mostly accounted for by the fact that refugees tended to settle in smaller cities initially than economic immigrants. The majority of immigrants stayed in their initial city of residence, regardless of admission category. These findings shed light on the mobility of different categories of immigrants.
Executive summary
Unlike economic and family class immigrants, who mostly make their own choice about where to settle in Canada, the initial geographic location of refugees is strongly influenced by government resettlement programs. Government-assisted refugees (GARs) are assigned to one of many designated communities based on a pre-approved regional quota of refugee allocation and the match between a refugee’s needs and community resources. Privately sponsored refugees (PSRs) are received by their sponsors, who are scattered across the country. While previous research suggests that refugees, especially GARs, are more likely to undertake secondary migration than other immigrants, no large-scale quantitative study has compared the rates of departure from initial destination cities for different immigrant categories in the long term.
This study asks two sets of questions. First, are refugees more likely to leave their initial destination city than economic immigrants when group differences in sociodemographic and contextual characteristics are taken into account? Among refugees, are GARs more likely to leave their initial destination city than PSRs? Second, to what extent does the impact of unemployment on secondary migration vary by admission category? Among refugees, are GARs more likely than PSRs to leave their initial destination city when they experience unemployment?
This study uses the Longitudinal Immigration Database. The analysis focuses on immigrants aged 20 to 54 at the time of landing who arrived in Canada from 2000 to 2014. It follows the immigrants’ mobility status longitudinally from their year of arrival to their 10th year in Canada. Census metropolitan areas (CMAs) and census agglomerations (CAs) are used as geographic units (cities) to measure the immigrants’ secondary migration. This study handles the boundary changes of CMAs and CAs over time by constructing consistent boundaries.
The results show that refugees were more likely to undertake secondary migration than economic immigrants during their first 10 years in Canada. However, the difference was mostly accounted for by the fact that refugees tended to settle initially in smaller cities than economic immigrants. PSRs’ higher propensity to migrate than economic immigrants was fully explained by their tendency to settle in cities other than the Toronto, Montréal and Vancouver CMAs. GARs were slightly more likely to leave their initial destination than economic immigrants and PSRs, even after a number of measurable characteristics were taken into account. Overall, the majority stayed in their initial city of residence, regardless of admission category.
Multivariate analysis indicates that experiencing unemployment in the previous year similarly increased the likelihood of both economic immigrants and GARs leaving their initial destination city. For PSRs, unemployment was not significantly associated with leaving the initial destination city, probably because they were more attached to their adopted community.
The observation that resettled refugees are not substantially different from economic immigrants in their tendency to move away from small cities is noteworthy since many refugees’ initial destinations are not self-chosen. This study’s findings shed light on the geographic mobility of different categories of immigrants and inform discussions regarding appropriate resettlement policies.
1 Introduction
Many immigrant-receiving countries are interested in a more balanced geographic distribution of refugees to reduce the settlement-related burden of immigrant gateway cities, and to enhance the ethnocultural diversity and economic growth of non-gateway cities (Di Biase and Bauder 2004; Krahn, Derwing and Abu-Laban 2005).
In Canada, the geographic dispersal of refugees is achieved both directly and indirectly through the nation’s two main resettlement programs: government assistance and private sponsorship. The former directly affects refugees’ initial destination. Government-assisted refugees (GARs) are assigned to one of many designated communities, based mostly on a pre-approved regional quota of refugee allocation and the match between a refugee’s needs and community resources (Simich, Beiser and Mawani 2002).Note Private sponsorship also influences refugee destination since privately sponsored refugees (PSRs) are received by their sponsors, who are scattered across the country (Hou 2017).
While previous research suggests some refugees, especially GARs, quickly leave their initial destination for employment-related reasons, no large-scale quantitative study has assessed refugees’ departures from their initial destination cities, or the impact of unemployment on secondary migration (Fang, Sapeha and Neil 2018; Simich 2003). Most empirical studies on secondary migration are about interprovincial movement, focusing on departure from initial destination province. Research on secondary migration at a lower unit of geography (e.g., the city level) is hampered by a lack of suitable data. Given that small communities across Canada view refugee settlement as a promising strategy to mitigate population decline and proactively recruit refugees (as seen in the resettlement of Syrian refugees from 2015 to 2017), it is important to find empirical evidence of refugee mobility at these lower geographic levels. Furthermore, the geographic mobility of refugees has strong implications for government policies that are designed to achieve a more balanced geographic distribution of immigrants in general.
This study asks two sets of questions. First, are refugees more likely to leave their initial destination city than economic immigrants, when group differences in sociodemographic and contextual characteristics are taken into account? Among refugees, are GARs more likely to leave their initial destination city than PSRs? Second, to what extent does the impact of unemployment on secondary migration vary by admission category? Among refugees, are GARs more responsive to unemployment than PSRs in leaving their initial destination city?
This study makes three contributions to the literature on internal migration and refugee secondary migration.
First, it is one of the first to investigate secondary migration using the city as the geographic unit of analysis. With the Longitudinal Immigration Database (IMDB)—which contains administrative data with landing records of all immigrants who landed in Canada since 1980, linked to annual tax records—this study handles city boundary changes over time by constructing consistent boundaries. Previous research that used provinces as the geographic units of analysis did not need to account for boundary changes.
Second, the IMDB data make it possible to directly identify resettled refugees and pinpoint the timing of secondary migration. The data contain detailed admission categories of refugees (e.g., PSR, GAR). Because specific admission category information was lacking, many previous international studies simply inferred a refugee population based on immigrants’ country of origin and year of arrival (Åslund 2000; Edin, Fredriksson and Åslund 2004; Khuu and Bean 2019). Moreover, the IMDB contains place of residence data (at lower units of geography, such as city and postal code) for immigrants for each year, which allows for a better identification of the timing of secondary migration. This improves on the existing research on immigrant internal migration, which tends to use cross-sectional census data and identifies recent interstate and interprovincial migration only between censuses.
Third, this study examines the individual experience of unemployment as a factor of secondary migration by taking advantage of the individual annual tax records in the IMDB. Previous research often used aggregate labour market data only (e.g., regional unemployment rates) as a proxy of the economic reason for migration. Although this study controls for such contextual characteristics, studying individual unemployment can directly examine the effect of individual unemployment as a push factor for secondary migration.
2 Data, measures and methods
2.1 Data
This study used the IMDB, which combines the landing records and annual tax information of immigrants who arrived in Canada in 1980 and onward (Evra and Prokopenko 2018). Immigrants who have filed at least one tax return since 1982 are included in the database. The landing records contain immigrant characteristics at the time of landing, such as age, education, marital status, source country, official language capabilities and admission category (e.g., economic class, family class, and refugee). Tax records provide information on annual wages and salaries, self‑employment income and other income, current marital status, tax deductions for postsecondary education, and place of residence. The most recent IMDB data cover landing and tax information up to 2016.
The analysis focused on immigrants aged 20 to 54 at the time of landing in Canada. It followed their mobility status longitudinally from their year of arrival until their 10th year in Canada. Using this age range ensured that most immigrants were still in prime working age during the follow-up period, since employment status was a key predictor of mobility in this study. The study sample was restricted to immigrants who landed in Canada between 2000 and 2014.Note The sample size of the selected immigrant cohorts ranged from 129,960 for the 2000 arrivals to 158,690 for the 2014 arrivals.Note
2.2 Measures
Census metropolitan areas (CMAs) and census agglomerations (CAs) were used as the geographic units to measure immigrants’ secondary migration.Note This was an advantage over most previous studies, which relied on provinces and states as geographic measurement units (CIC 2000; Haan, Arbuckle and Prokopenko 2017; Mossaad et al. 2019; Okonny-Myers 2010; van Huystee and St Jean 2014). Since the rate of internal migration tends to decrease with the size of geographic units, provincial-level and state-level analysis would not capture most internal mobility among immigrants. Further, immigrant distribution and mobility across CMAs and CAs shed light on the efficacy of policies that steer immigrants from major gateway cities to smaller cities. Compared with smaller geographic areas (e.g., municipalities), a CMA or a CA is an appropriate unit of local labour market. A move across CMAs or CAs would have greater implications on labour market access and social interactions with friends and relatives than mostly residential moves across municipalities within a CMA or CA.Note
One challenge of using CMAs and CAs to study mobility was that their boundaries may have changed from one census to another. For example, the IMDB tax file data change geographic boundaries of CMAs and CAs when a new census is conducted. This study created consistent CMA and CA boundaries, using boundaries from the 2011 Census as the base. First, using the Postal Code Conversion File, an immigrant’s postal code of residence—as provided in the tax file—was assigned to the smallest standard geographic unit: a dissemination area (DA) (for the 2001 Census and the more recent censuses) or an enumeration area (EA) (for censuses before 2001).Note The EA or DA was then matched to a corresponding CMA or CA from the 2011 Census, based on a set of historical boundary conversion files provided by Statistics Canada. This approach to creating consistent CMA and CA boundaries worked well for the 1996 Census and later censuses. However, there were some problems with earlier years because many postal codes do not have a unique EA code, and some provided EA codes could not be matched to the historical boundary conversion files. Therefore, this study focused on immigrants and refugees who arrived in Canada in the 2000s and early 2010s.
The dependent variable was the incidence of internal migration in a specific year (t), defined as the year when an immigrant left the initial destination of resettlement. The initial destination was the CMA or CA where an immigrant resided in the calendar year of their arrival (hereafter the “landing year”) if they filed an income tax return in that year, or the CMA or CA where an immigrant resided in the year after arrival (the first full year after immigration) if they did not file income tax in the landing year. In the study sample, about 93% of immigrants who filed an income tax return in the first full year after immigration also did so in the landing year. Therefore, the initial destination of the majority was the place of residence in the landing year.
The focal independent variable was immigrant admission category, which consists of five groups: economic class, family class, GARs, PSRs and other refugees (mostly in-Canada asylum seekers and their dependants). Although it was not a focus of this paper, the family class was included to get a complete picture of all immigrant classes. In the study sample of 2,092,950 immigrants, 1,276,690 (61.0%) were economic immigrants, 592,370 (28.3%) were family class immigrants, 53,280 (2.5%) were GARs, 33,520 (1.6%) were PSRs and 137,090 (6.6%) were other refugees.
The multivariate analysis used four sets of covariates to account for observed differences by admission category in the likelihood of leaving the initial destination. The first set was the size of the initial destination, coded into six groups: the three gateway cities of Toronto, Montréal and Vancouver; medium-sized CMAs with populations over 500,000 (Ottawa, Calgary, Edmonton, Hamilton, Winnipeg, city of Québec); small CMAs with populations between 100,000 and 500,000 (e.g., Victoria, Saskatoon, Halifax); and small urban areas. Immigrants who initially settled in rural areas were excluded because it is difficult to create consistent boundaries for scattered rural areas. Very few immigrants, particularly refugees, initially settled in rural areas (Table 1).
The second set of covariates contains years since immigration and sociodemographic characteristics at the time of arrival. Years since immigration were coded as a set of single-year dummy variables. The analysis restricted observations to the first 10 years after arrival to reduce out-of-range predictions for arrival cohorts with fewer than 10 years of observations. The likelihood of leaving the initial destination was generally small 10 years after immigration.Note Sociodemographic characteristics at the time of arrival included age at immigration, gender, education, official language and source region. The education variable has four categories: less than high school, high school graduation, some postsecondary education and bachelor’s degree or higher. Official language skills were based on knowledge of official languages at arrival: English and/or French, and neither English nor French. The source region was coded into 11 categories: Western developed countries (the United States, Western and Northern Europe, Australia, New Zealand), the Caribbean and Central America, South America, Southern Europe, Eastern Europe, Africa, Southern Asia, Southeast Asia, East Asia, West Asia, and others.
| Economic class | Family class | Government-assisted refugees | Privately sponsored refugees | Other refugees | |
|---|---|---|---|---|---|
| percent | |||||
| Initial destination | |||||
| Montréal | 17.8 | 13.1 | 5.6 | 5.0 | 20.4 |
| Toronto | 34.0 | 39.0 | 15.9 | 28.9 | 52.3 |
| Vancouver | 14.6 | 14.0 | 11.1 | 6.7 | 4.8 |
| Medium-sized census metropolitan areas | 18.8 | 16.7 | 34.0 | 37.5 | 13.0 |
| Small census metropolitan areas | 8.2 | 9.6 | 23.6 | 15.1 | 7.8 |
| Small urban areas | 4.0 | 4.1 | 9.6 | 6.0 | 1.4 |
| Rural areas | 2.7 | 3.5 | 0.4 | 0.9 | 0.3 |
| Source region | |||||
| Western developed countries | 7.9 | 11.8 | 0.1 | 0.0 | 0.3 |
| Caribbean and Central America | 3.2 | 9.3 | 0.5 | 0.2 | 12.9 |
| South America | 3.7 | 4.7 | 12.8 | 2.1 | 11.8 |
| Southern Europe | 0.9 | 1.9 | 1.6 | 0.5 | 1.6 |
| Eastern Europe | 8.4 | 5.4 | 7.0 | 0.9 | 5.8 |
| Africa | 11.5 | 9.8 | 30.5 | 44.8 | 22.0 |
| Southern Asia | 18.7 | 25.5 | 6.7 | 2.6 | 23.1 |
| Southeast Asia | 15.4 | 10.2 | 5.6 | 1.4 | 1.0 |
| East Asia | 21.7 | 14.2 | 0.2 | 0.1 | 9.8 |
| West Asia | 8.6 | 6.8 | 35.3 | 47.5 | 11.6 |
| Others | 0.1 | 0.4 | 0.0 | 0.0 | 0.3 |
| Highest level of education at landing | |||||
| Less than high school | 11.3 | 34.8 | 72.9 | 69.7 | 48.0 |
| High school graduation | 11.5 | 19.2 | 11.3 | 13.0 | 19.6 |
| Some postsecondary education | 12.6 | 12.0 | 5.3 | 7.9 | 14.3 |
| Bachelor's degree or higher | 64.6 | 34.0 | 10.5 | 9.4 | 18.1 |
| Knowledge of official languages | |||||
| Neither English nor French | 17.8 | 29.0 | 67.7 | 53.2 | 14.7 |
| English and/or French | 82.2 | 71.0 | 32.3 | 46.8 | 85.4 |
| Source: Statistics Canada, Longitudinal Immigration Database. | |||||
The third set of covariates covers post-immigration marital status, schooling and labour market activities. These are time-varying variables, measured annually in each tax year before an immigrant’s mobility status is determined. Marital status has three categories: married or common law; divorced, separated or widowed; and single. The school attendance variable was coded “1” if an immigrant attended full-time school in the last tax year, and “0” otherwise.Note Labour market activity in the last year was coded as unemployed, employed, and not in the labour force. “Unemployed” included individuals who received at least $100 in employment insurance income (government transfer payment to unemployed individuals) in a given tax year.Note “Employed” included individuals who received at least $100 in employment income and no employment insurance or less than $100 in employment insurance income. The residual group was defined as “not in the labour force.”
The fourth set of covariates captures the social and economic contexts of the initial destination. One indicator is the percentage of immigrants of the same origin region in the CMA or CA where an immigrant initially settled. This indicator was included to examine the role of ethnic enclaves in retaining immigrants. The other indicator is the percentage of unemployed individuals among the Canadian-born population and immigrants who arrived in Canada more than 20 years ago. This indicator was used to examine the possible effect of job opportunities in the local labour market on retaining immigrants. Both indicators are time-varying and were measured in the tax year before mobility status is determined.
2.3 Methods
The first step was to derive descriptive statistics on the distribution of immigrants by the size of their initial destination cities and the differences by admission category in selected sociodemographic characteristics. The share of immigrants who remained in their initial destination, by years since immigration, is presented by immigrant category and initial city size. These statistics illustrate the importance of the size of the initial destination when accounting for differences by admission category in the likelihood of secondary migration.
Since migration status is determined on a yearly basis, discrete-time event history models were used to estimate the likelihood and timing of secondary migration. The multivariate models focused on the first instance of departure. Immigrants were followed up to the year they left their initial destination, or, if they remained, to the latest year of observation (or the 10th year after immigration, whichever came first).
Three event history models were run sequentially to estimate the probability of immigrants leaving their initial destination city. Model 1 contained a set of dummy variables for years since immigration from year 2 to year 10 and the admission category variable. It tested the overall differences in the likelihood of economic immigrants, family class immigrants, GARs, PSRs and other refugees leaving their initial destination. Model 2 added the selected covariates, including size of initial destination, sociodemographic characteristics at landing, post-immigration marital status, school attendance and labour market activity, local ethnic enclave, and labour market conditions. Model 3 added the interaction terms between post-immigration labour market activity and admission category to see whether refugees were more or less responsive to unemployment than economic immigrants.
Models 2 and 3 were multi-level, with both individual-level and community-level variables. Since dependency among observations within a local community (CMA or CA) can underestimate standard errors of the regression coefficients, robust variance estimation was used to take into account cluster effects (Steenbergen and Jones 2002). Such a model is equivalent to a fixed‑intercept model with level-1 covariates and level-2 predictors within the framework of hierarchical linear models (Raudenbush et al. 2000).
3 Results
3.1 A first look
This analysis first explores the landing and post-migration characteristics of the sample. Table 1 shows a notable divide between the gateway cities (Toronto, Vancouver and Montréal) and non‑gateway cities, by admission category. The majority (66%) of economic and family class immigrants settled in one of the three gateway cities, while more than half of resettled refugees (GARs and PSRs) resided in medium-sized centres or small metropolitan areas (58% and 53%, respectively). Within the refugee population, there was a wide geographic variation. Other refugees, who were not subject to government dispersal policy, were even more likely to settle in the three gateway cities (73%) than economic and family class immigrants. Between the two groups of resettled refugees, PSRs were more likely to settle in the gateway cities (41%) than GARs (33%).
Admission categories also reflected source regions. Africa and West Asia were the dominant source regions for resettled refugees who arrived from 2000 to 2014, comprising 66% and 92% of GARs and PSRs, respectively. Asia (Southern, Southeast and East) was the source region for 56% of economic immigrants, and 52% of family class immigrants came from South Asia, East Asia and Western developed countries.
Human capital profiles also varied by admission category. Overall, economic immigrants were the most highly educated, with 65% possessing a bachelor’s degree or higher at the time of arrival, followed by family class immigrants (34%). Resettled refugees were less educated; 70% or more of GARs and PSRs had not completed high school at arrival. These refugees were also disadvantaged in terms of official language skills. At arrival, 68% of GARs and 53% of PSRs knew neither English nor French. Conversely, the majority of economic and family class immigrants knew one of the official languages.
Table 2 displays post-migration characteristics of immigrants by admission category. While these characteristics can vary in each tax year, the characteristics in years 2 and 5 are presented as snapshots of initial-stage and mid-stage resettlement. The variations in the time-varying individual characteristics between the five admission categories are of note, especially two years after arrival. Economic immigrants and other refugees were far more likely to have attended school in year 1 (12% and 10%, respectively) than resettled refugees. However, the gaps between these admission groups rapidly decreased by year 5, as the rate of school attendance dropped for economic immigrants and other refugees, and increased for resettled refugees.
| Economic class | Family class | Government-assisted refugees | Privately sponsored refugees | Other refugees | |
|---|---|---|---|---|---|
| percent | |||||
| Second year after immigration | |||||
| Attended school in the previous year | 11.9 | 6.9 | 4.1 | 4.6 | 10.0 |
| Not in the labour force in the previous year | 24.1 | 20.7 | 56.9 | 23.2 | 26.3 |
| Unemployed in the previous year | 12.1 | 24.9 | 3.6 | 12.4 | 17.0 |
| Regional unemployment rate | 11.1 | 10.9 | 11.9 | 10.6 | 10.8 |
| Percentage of own-group immigrants | 4.7 | 4.4 | 1.9 | 2.6 | 3.7 |
| Fifth year after immigration | |||||
| Attended school in the previous year | 9.3 | 6.1 | 7.3 | 6.7 | 7.5 |
| Not in the labour force in the previous year | 17.0 | 18.4 | 36.6 | 22.5 | 21.3 |
| Unemployed in the previous year | 21.8 | 28.8 | 18.9 | 24.2 | 21.7 |
| Regional unemployment rate | 11.0 | 10.9 | 11.7 | 10.4 | 11.3 |
| Percentage of own-group immigrants | 5.3 | 4.8 | 2.1 | 2.7 | 4.2 |
| Source: Statistics Canada, Longitudinal Immigration Database. | |||||
Similarly, individual labour market activities in year 2 varied greatly by admission category. While the non-labour force participation rates for economic immigrants, family class immigrants, PSRs and other refugees ranged from 21% to 26%, more than half (57%) of GARs were not in the labour force. Many GARs may have been taking language training, or may have chosen not to engage in employment to retain their eligibility to receive monthly income assistance from the government during their first year in Canada. The relatively low non-labour force participation rates of PSRs may reflect sponsors’ efforts to make them economically independent during their first 12 months in Canada, the period when sponsors are legally responsible for PSRs’ finances. This is consistent with an IMDB analysis conducted by Kaida, Hou and Stick (2019); they found that the employment rates of PSRs during their first year in Canada were comparable to those of economic immigrants. The variations in non-labour force participation rates shrank by year 5, although GARs were still less likely to be in the labour force than other immigrants.
There was also a clear difference in the incidence of unemployment by admission category. GARs’ unemployment rates in year 1 were low, likely because many were not yet in the labour force and, therefore, were not looking for employment. The unemployment rates of economic immigrants, PSRs and other refugees were comparable (12.1%, 12.4% and 17%, respectively), and were lower than those of family class immigrants. In year 5, the unemployment rates rose across all admission categories, likely because more immigrants and refugees had worked long enough to qualify for employment insurance when unemployed.
Contextual characteristics differed to a lesser extent between admission groups. Regional unemployment rates varied little in both year 2 and year 5. Resettled refugees tended to have fewer co‑national immigrants in their city of residence (the mean share of co-national immigrants in the same city was around 2% for GARs and PSRs) than economic and family class immigrants, and the percentages of co-national immigrants in the city of residence hardly changed three years later (year 5).
3.2 Secondary migration by initial destination city size
Charts 1 to 4 display the proportions of immigrants who remained in their initial destination city, by years after immigration and admission category. These charts show the retention rates by size of the destination city: all destinations combined (Chart 1), the three gateway cities (Toronto, Montréal, Vancouver) (Chart 2), medium-sized centres (Chart 3) and small metropolitan areas (Chart 4).
First, refugees overall were less likely to remain in their initial destination city than economic and family class immigrants. However, three-quarters of refugees still lived in their initial destination city 10 years after arrival (Chart 1). Second, the size of an initial destination city mattered when accounting for variations in immigrant retention rates by admission category. In the three gateway cities, the variation in retention rates by admission category was virtually non-existent (Chart 2). More than 85% of immigrants remained in their initial destination city 10 years after arrival for all admission categories. Immigrants were slightly less likely to remain in medium-sized centres than in gateway cities. Three-quarters of economic immigrants and resettled refugees who arrived in medium-sized centres stayed there, while the retention rate was slightly higher among family class immigrants (Chart 3). In small metropolitan areas, retention rates varied widely by admission category (Chart 4). Economic immigrants and GARs followed a similar pattern and were the least likely to remain in their initial destination city throughout their first 10 years. PSRs and other refugees were more likely to stay in their initial destination city, with 69% and 67%, respectively, still living in their initial destination city in year 10. Family class immigrants were the most likely to remain in these areas.

Data table for Chart 1
| Years since landing | Economic class | Family class | Government-assisted refugees | Privately sponsored refugees | Other refugees |
|---|---|---|---|---|---|
| proportion | |||||
| 2 | 0.919 | 0.935 | 0.882 | 0.902 | 0.935 |
| 3 | 0.894 | 0.915 | 0.847 | 0.875 | 0.915 |
| 4 | 0.876 | 0.900 | 0.817 | 0.853 | 0.899 |
| 5 | 0.864 | 0.889 | 0.794 | 0.837 | 0.884 |
| 6 | 0.854 | 0.879 | 0.781 | 0.821 | 0.872 |
| 7 | 0.846 | 0.872 | 0.771 | 0.814 | 0.861 |
| 8 | 0.839 | 0.865 | 0.762 | 0.800 | 0.853 |
| 9 | 0.833 | 0.859 | 0.752 | 0.789 | 0.845 |
| 10 | 0.827 | 0.853 | 0.742 | 0.780 | 0.837 |
| Source: Statistics Canada, Longitudinal Immigration Database, 2000 to 2016. | |||||

Data table for Chart 2
| Years since landing | Economic class | Family class | Government-assisted refugees | Privately sponsored refugees | Other refugees |
|---|---|---|---|---|---|
| proportion | |||||
| 2 | 0.941 | 0.955 | 0.936 | 0.944 | 0.950 |
| 3 | 0.921 | 0.941 | 0.916 | 0.927 | 0.934 |
| 4 | 0.907 | 0.929 | 0.901 | 0.915 | 0.921 |
| 5 | 0.896 | 0.920 | 0.889 | 0.901 | 0.908 |
| 6 | 0.888 | 0.912 | 0.885 | 0.893 | 0.897 |
| 7 | 0.883 | 0.906 | 0.881 | 0.887 | 0.888 |
| 8 | 0.877 | 0.899 | 0.879 | 0.880 | 0.881 |
| 9 | 0.870 | 0.894 | 0.877 | 0.867 | 0.874 |
| 10 | 0.864 | 0.889 | 0.871 | 0.861 | 0.866 |
| Source: Statistics Canada, Longitudinal Immigration Database, 2000 to 2016. | |||||

Data table for Chart 3
| Years since landing | Economic class | Family class | Government-assisted refugees | Privately sponsored refugees | Other refugees |
|---|---|---|---|---|---|
| proportion | |||||
| 2 | 0.914 | 0.925 | 0.901 | 0.909 | 0.912 |
| 3 | 0.886 | 0.904 | 0.873 | 0.885 | 0.888 |
| 4 | 0.866 | 0.887 | 0.847 | 0.859 | 0.869 |
| 5 | 0.850 | 0.875 | 0.827 | 0.845 | 0.853 |
| 6 | 0.835 | 0.864 | 0.816 | 0.834 | 0.837 |
| 7 | 0.821 | 0.854 | 0.810 | 0.825 | 0.822 |
| 8 | 0.808 | 0.845 | 0.803 | 0.812 | 0.815 |
| 9 | 0.797 | 0.837 | 0.790 | 0.800 | 0.806 |
| 10 | 0.786 | 0.832 | 0.779 | 0.793 | 0.799 |
|
Note: Medium-sized census metropolitan areas have populations over 500,000. Source: Statistics Canada, Longitudinal Immigration Database, 2000 to 2016. |
|||||
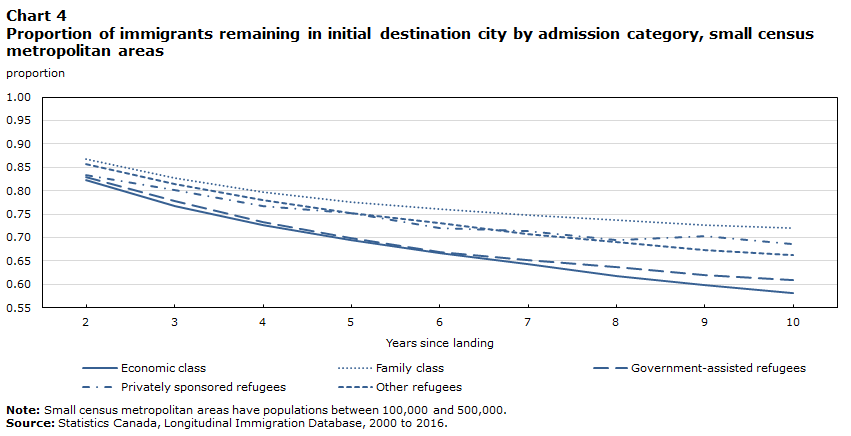
Data table for Chart 4
| Years since landing | Economic class | Family class | Government-assisted refugees | Privately sponsored refugees | Other refugees |
|---|---|---|---|---|---|
| proportion | |||||
| 2 | 0.822 | 0.867 | 0.829 | 0.833 | 0.856 |
| 3 | 0.768 | 0.828 | 0.779 | 0.801 | 0.814 |
| 4 | 0.728 | 0.798 | 0.734 | 0.768 | 0.780 |
| 5 | 0.694 | 0.776 | 0.699 | 0.752 | 0.752 |
| 6 | 0.667 | 0.760 | 0.669 | 0.720 | 0.730 |
| 7 | 0.643 | 0.747 | 0.652 | 0.714 | 0.706 |
| 8 | 0.618 | 0.737 | 0.638 | 0.695 | 0.689 |
| 9 | 0.599 | 0.726 | 0.621 | 0.702 | 0.673 |
| 10 | 0.582 | 0.719 | 0.609 | 0.686 | 0.662 |
|
Note: Small census metropolitan areas have populations between 100,000 and 500,000. Source: Statistics Canada, Longitudinal Immigration Database, 2000 to 2016. |
|||||
3.3 Event history analysis predicting secondary migration
The results for secondary migration in Chart 1 (all initial destinations) were based on observed data; differences in measurable characteristics of immigrants from different admission categories were not considered. However, as shown in Tables 1 and 2, immigrants from different admission categories differed in their demographic, socioeconomic and contextual characteristics, and this may partly explain why certain categories were more likely to leave their initial destination city than others. Discrete-time event history models were used to examine the probability of secondary migration by admission category and the differential impacts of unemployment by admission category, while controlling for measurable group differences (Table 3).
When no individual or contextual characteristics of immigrants were taken into account (Model 1), both groups of resettled refugees had a higher likelihood of leaving their initial destination than economic immigrants, as the positive and statistically significant coefficients for GARs and PSRs suggest, consistent with Chart 1 (all destinations).
After measurable covariates were controlled for, as in Model 2, PSRs were less likely to leave their initial destination than economic immigrants (p < 0.05). This suggests that PSRs’ higher likelihood of secondary migration found in Model 1 can be largely explained by the fact that they were more likely to settle in smaller-sized cities initially, and by differences in other characteristics. With the control variables in the model, GARs’ coefficient was still positive and statistically different from zero (Model 2). However, the statistical significance of coefficients does not tell the whole story. Chart 5 displays predicted probabilities of remaining in the initial destination by admission category, based on Model 2 results. To calculate the probabilities, the values for the covariates were set at means (for continuous variables) or proportions (for categorical variables) for all immigrant groups combined.
Chart 5 suggests that GARs’ estimated probability of remaining in their initial destination differed little from that of economic immigrants. Similarly, the difference between PSRs and economic immigrants in the estimated likelihood of staying in their initial destination was small. Overall, the predicted retention rates for economic immigrants and resettled refugees were similar and remained fairly high (over 75%) throughout the first 10 years.

Data table for Chart 5
| Years since landing | Economic class | Government-assisted refugees | Privately sponsored refugees | Other refugees |
|---|---|---|---|---|
| proportion | ||||
| 2 | 0.921 | 0.918 | 0.923 | 0.927 |
| 3 | 0.889 | 0.885 | 0.892 | 0.897 |
| 4 | 0.863 | 0.858 | 0.866 | 0.873 |
| 5 | 0.841 | 0.835 | 0.845 | 0.852 |
| 6 | 0.823 | 0.816 | 0.827 | 0.835 |
| 7 | 0.807 | 0.800 | 0.812 | 0.820 |
| 8 | 0.793 | 0.786 | 0.798 | 0.807 |
| 9 | 0.781 | 0.773 | 0.786 | 0.796 |
| 10 | 0.770 | 0.762 | 0.775 | 0.785 |
| Source: Statistics Canada, Longitudinal Immigration Database, 2000 to 2016. | ||||
Model 3 adds interaction terms between admission category and labour market activities in the previous year to test whether resettled refugees were more or less likely to respond to unemployment. Chart 6 presents a graph of predicted probabilities of remaining in the initial destination for unemployed and employed GARs, PSRs and economic immigrants in years 2 to 10, based on the results of Model 3.
The main effect of unemployment was positive and significant, which indicates that, for economic immigrants, unemployment is associated with a greater likelihood of leaving the initial destination. The interaction term between GARs and unemployment was virtually zero (Table 3, Model 3), which indicates that unemployment experience had no greater impact on secondary migration for GARs than for economic immigrants. As shown in Chart 6, the gaps between unemployed and employed economic immigrants and GARs were similar throughout the first 10 years after landing. Meanwhile, the interaction term between PSRs and unemployment was negative and significant. The predicted effect of unemployment shows that unemployment was not significantly associated with secondary migration for PSRs, but, for economic immigrants, it was associated with a great likelihood of leaving the initial destination.
It is worth noting that the predicted probabilities of staying in the initial destination differ little for all employed and unemployed immigrants, regardless of admission category, as demonstrated in Chart 6. Over 70% of employed and unemployed immigrants remained in their initial destination in year 10, and the difference in their likelihood of leaving their initial destination by employment status was small for GARs and PSRs, and for economic immigrants.
| Model 1 | Model 2 | Model 3 | |
|---|---|---|---|
| coefficient | |||
| Years since migration (reference: year 1) | |||
| Year 2 | -2.45Note *** | -1.78Note *** | -1.81Note *** |
| Year 3 | -3.37Note *** | -2.66Note *** | -2.69Note *** |
| Year 4 | -3.56Note *** | -2.82Note *** | -2.85Note *** |
| Year 5 | -3.76Note *** | -2.98Note *** | -3.01Note *** |
| Year 6 | -3.93Note *** | -3.12Note *** | -3.15Note *** |
| Year 7 | -4.10Note *** | -3.27Note *** | -3.30Note *** |
| Year 8 | -4.23Note *** | -3.38Note *** | -3.41Note *** |
| Year 9 | -4.34Note *** | -3.47Note *** | -3.50Note *** |
| Year 10 | -4.45Note *** | -3.57Note *** | -3.60Note *** |
| Admission category (reference: economic class) | |||
| Family class | -0.17Note *** | -0.20Note *** | -0.13Note *** |
| Government-assisted refugees | 0.42Note *** | 0.04Note *** | 0.15Note *** |
| Privately sponsored refugees | 0.19Note *** | -0.03Note * | 0.05Note ** |
| Other refugees | -0.11Note *** | -0.08Note *** | -0.02Note * |
| Initial destination (reference: Toronto) | |||
| Montréal | Note ...: not applicable | -0.19Note *** | -0.19Note *** |
| Vancouver | Note ...: not applicable | 0.05Note *** | 0.05Note *** |
| Medium-sized census metropolitan areas | Note ...: not applicable | 0.20Note *** | 0.21Note *** |
| Small census metropolitan areas | Note ...: not applicable | 0.84Note *** | 0.84Note *** |
| Small urban areas | Note ...: not applicable | 1.28Note *** | 1.28Note *** |
| Age at landing | Note ...: not applicable | -0.02Note *** | -0.02Note *** |
| Gender (reference: male) | |||
| Female | Note ...: not applicable | -0.17Note *** | -0.17Note *** |
| Marital status (reference: married or common law) | |||
| Divorced, separated or widowed | Note ...: not applicable | 0.38Note *** | 0.38Note *** |
| Never married, single | Note ...: not applicable | 0.28Note *** | 0.28Note *** |
| Education (reference: bachelor's degree or higher) | |||
| Less than high school | Note ...: not applicable | -0.27Note *** | -0.27Note *** |
| High school graduation | Note ...: not applicable | -0.21Note *** | -0.21Note *** |
| Some postsecondary education | Note ...: not applicable | -0.19Note *** | -0.19Note *** |
| Knowledge of official languages | Note ...: not applicable | 0.04Note *** | 0.04Note *** |
| Region of origin (reference: West Asia) | |||
| Western developed countries | Note ...: not applicable | -0.01 | -0.02 |
| Caribbean and Central America | Note ...: not applicable | -0.32Note *** | -0.33Note *** |
| South America | Note ...: not applicable | -0.10Note *** | -0.11Note *** |
| Southern Europe | Note ...: not applicable | -0.54Note *** | -0.55Note *** |
| Eastern Europe | Note ...: not applicable | -0.24Note *** | -0.24Note *** |
| Africa | Note ...: not applicable | 0.14Note *** | 0.13Note *** |
| Southern Asia | Note ...: not applicable | 0.46Note *** | 0.46Note *** |
| Southeast Asia | Note ...: not applicable | -0.50Note *** | -0.50Note *** |
| East Asia | Note ...: not applicable | 0.45Note *** | 0.44Note *** |
| Other countries | Note ...: not applicable | -0.70Note *** | -0.71Note *** |
| Attended school | Note ...: not applicable | 0.24Note *** | 0.24Note *** |
| Employment status (reference: employed) | |||
| Not in the labour force | Note ...: not applicable | 0.20Note *** | 0.28Note *** |
| Unemployed | Note ...: not applicable | 0.03Note *** | 0.08Note *** |
| Regional unemployment rate | Note ...: not applicable | 0.01Note *** | 0.01Note *** |
| Percentage of own-group immigrants | Note ...: not applicable | -0.09Note *** | -0.09Note *** |
| Not in the labour force × family class | Note ...: not applicable | Note ...: not applicable | -0.16Note *** |
| Not in the labour force × GARs | Note ...: not applicable | Note ...: not applicable | -0.31Note *** |
| Not in the labour force × PSRs | Note ...: not applicable | Note ...: not applicable | -0.30Note *** |
| Not in the labour force × other refugees | Note ...: not applicable | Note ...: not applicable | -0.29Note *** |
| Unemployed × family class | Note ...: not applicable | Note ...: not applicable | -0.15Note *** |
| Unemployed × GARs | Note ...: not applicable | Note ...: not applicable | 0.00 |
| Unemployed × PSRs | Note ...: not applicable | Note ...: not applicable | -0.11Note ** |
| Unemployed × other refugees | Note ...: not applicable | Note ...: not applicable | 0.03 |
... not applicable
Source: Statistics Canada, Longitudinal Immigration Database, 2000 to 2016. |
|||

Data table for Chart 6
| Years since landing | Economic immigrants, unemployed | Economic immigrants, employed | Government-assisted refugees, unemployed | Government-assisted refugees, employed | Privately sponsored refugees, unemployed | Privately sponsored refugees, employed |
|---|---|---|---|---|---|---|
| proportion | ||||||
| 2 | 0.92 | 0.93 | 0.91 | 0.92 | 0.93 | 0.93 |
| 3 | 0.89 | 0.90 | 0.88 | 0.88 | 0.90 | 0.89 |
| 4 | 0.87 | 0.88 | 0.85 | 0.86 | 0.87 | 0.87 |
| 5 | 0.84 | 0.86 | 0.82 | 0.83 | 0.85 | 0.85 |
| 6 | 0.83 | 0.84 | 0.80 | 0.82 | 0.84 | 0.83 |
| 7 | 0.81 | 0.82 | 0.78 | 0.80 | 0.82 | 0.82 |
| 8 | 0.80 | 0.81 | 0.77 | 0.79 | 0.81 | 0.80 |
| 9 | 0.79 | 0.80 | 0.76 | 0.77 | 0.80 | 0.79 |
| 10 | 0.78 | 0.79 | 0.74 | 0.76 | 0.79 | 0.78 |
| Source: Statistics Canada, Longitudinal Immigration Database, 2000 to 2016. | ||||||
4 Conclusion and discussion
This study compares the propensity of resettled refugees (government-assisted refugees [GARs] and privately sponsored refugees [PSRs]) and economic immigrants to leave their initial city of destination. Using data from the Longitudinal Immigration Database, this study improves upon previous studies by analyzing the timing of secondary migration of a broader arrival cohort of immigrants (2000 to 2014) at lower levels of geography (census metropolitan areas [CMAs] and census agglomerations [CAs]) for a longer period (the first 10 years after arrival).
The results show that refugees are more likely than economic immigrants to undertake secondary migration during their first 10 years in Canada. However, this is mostly explained by the fact that refugees tend to settle in smaller cities initially. PSRs’ higher propensity to migrate than economic immigrants is fully explained by their tendency to settle in non-gateway cities. GARs are slightly more likely to leave their initial destination than economic immigrants and PSRs, even after a number of measurable characteristics are taken into account.
Event history analysis shows that an experience of unemployment in the previous year similarly increases the likelihood of leaving the initial destination city for both economic immigrants and GARs. For PSRs, unemployment is not significantly associated with leaving the initial destination, probably because PSRs are more attached to their adopted community.
More importantly, the predicted probabilities of secondary migration highlight that, regardless of admission category, the majority of immigrants remain in their initial destination even 10 years after arrival. Previous studies tended to suggest that policies designed to steer immigrants away from gateway cities would be ineffective because immigrants prefer larger cities and have the right to move wherever they want. However, this study’s results show that most new immigrants stay in their initial destination.
The observation that resettled refugees are not substantially different from economic immigrants is particularly noteworthy, given that many refugees’ initial destinations are not self-chosen but assigned by the government. Without this assignment, most refugees would probably never set foot in small cities where they have no economic or social connections.
Overall, the findings are consistent with Åslund’s study (2000) on secondary migration in Sweden: the refugee dispersal policy does not necessarily lead to secondary migration. Most refugees stay in their initial destination city. These findings improve understanding of the mobility of different categories of immigrants, and inform discussions regarding appropriate resettlement policies.
References
Åslund, O. 2000. Immigrant Settlement Policies and Subsequent Migration. Department of Economics, Working Paper no. 2000:23. Uppsala, Sweden: Uppsala University.
CIC (Citizenship and Immigration Canada). 2000. The Interprovincial Migration of Immigrants to Canada. Ottawa: Citizenship and Immigration Canada. IMDB Profile Series. Ottawa, Ontario: Citizenship and Immigration Canada, Strategic Policy, Planning and Research. Available at: http://publications.gc.ca/collections/Collection/MP22-18-4-2000E.pdf (accessed July 3, 2019).
CIC (Citizenship and Immigration Canada). 2009. OP 5 Overseas Selection and Processing of Convention Refugees Abroad Class and Members of the Humanitarian-protected Persons Abroad Classes. Available at: http://www.cic.gc.ca/EnGLish/resources/manuals/op/op05-eng.pdf (accessed November 19, 2019).
Di Biase, S., and H. Bauder. 2004. Immigrants in Ontario: Linking Spatial Settlement Patterns and Labour Force Characteristics. Guelph, Ontario: Department of Geography, University of Guelph. Available at: http://www.geography.ryerson.ca/hbauder/Immigrant%20Labour/Settlement%20in%20Ontario_report.pdf (accessed July 3, 2019).
Edin, P.A., P. Fredriksson and O. Åslund. 2004. “Settlement policies and the economic success of immigrants.” Journal of Population Economics 17(1): 133–155.
Evra, R. and E. Prokopenko. 2018. “Longitudinal Immigration Database (IMDB) Technical Report, 2016”. Statistics Canada, Analytical Studies: Methods and References. Catalogue no. 11-633-X No. 019. Ottawa: Statistics Canada.
Fang, T., H. Sapeha and K. Neil. 2018. “Integration and retention of refugees in smaller communities.” International Migration 56(6): 83–99.
Haan, M., J. Arbuckle and E. Prokopenko. 2017. “Individual and community-level determinants of retention of Anglophone and Francophone immigrants across Canada.” Canadian Studies in Population 44(1–2): 59–76.
Hou, F. 2017. The Resettlement of Vietnamese Refugees Across Canada over Three Decades. WIDER Working Paper, no. 2017/188. Helsinki: The United Nations University World Institute for Development Economics Research (UNU-WIDER).
Kaida, L., F. Hou and M. Stick. 2019. “The long-term economic integration of resettled refugees in Canada: A comparison of privately sponsored refugees and government-assisted refugees.” Journal of Ethnic and Migration Studies. https://doi.org/10.1080/1369183X.2019.1623017.
Khuu, N.-T., and F.D. Bean. 2019. International Migrants, Governmental Context of Reception, and Second-Generation Educational Integration. Paper presented at the Population Association of America, Austin, Texas, April 10–13.
Krahn, H., T.M. Derwing and B. Abu‐Laban. 2005. “The retention of newcomers in second‐ and third‐tier Canadian cities.” International Migration Review 39(4): 872–894.
Mossaad, N., J. Ferwerda, J. Weinstein, D. Lawrence, and J. Hainmueller. 2019. In Search of Opportunity and Community: The Secondary Migration of Refugees in the United States. Paper presented at the Population Association of America, Austin, Texas, April 10–13.
Okonny-Myers, I. 2010. Interprovincial Mobility of Immigrants in Canada. Ottawa, Ontario: Citizenship and Immigration Canada, Research and Evaluation. Available at: https://www.canada.ca/content/dam/ircc/migration/ircc/english/pdf/research-stats/interprov-mobility.pdf (accessed July 3, 2019).
Raudenbush, S.W., A.S. Bryk, Y.F. Cheong and R.T. Congdo. 2000. HLM5 Hierarchical Linear and Nonlinear Modeling. Lincolnwood, Illinois: Scientific Software International, Inc.
Simich, L. 2003. “Negotiating boundaries of refugee resettlement: A study of settlement patterns and social support.” The Canadian Review of Sociology and Anthropology 40(5): 575–591.
Simich, L., M. Beiser and F. Mawani. 2002. “Paved with good intentions: Canada’s refugee destining policy and paths of secondary migration.” Canadian Public Policy 28(4): 597–607.
Steenbergen, M.R., and B.S. Jones. 2002. “Modeling multilevel data structure.” American Journal of Political Science 46: 218–237.
van Huystee, M., and B. St Jean. 2014. Interprovincial Mobility of Immigrants in Canada 2006–2011. IMDB Research Series. Ottawa, Ontario: Citizenship and Immigration Canada, Research and Evaluation. Available at: https://www.canada.ca/content/dam/ircc/migration/ircc/english/resources/research/documents/pdf/mobility2006-2011.pdf (accessed July 3, 2019).
- Date modified: