
Analytical Studies Branch Research Paper Series
Frontier Firms, Productivity Dispersion and Aggregate Productivity Growth in Canada

Archived Content
Information identified as archived is provided for reference, research or recordkeeping purposes. It is not subject to the Government of Canada Web Standards and has not been altered or updated since it was archived. Please "contact us" to request a format other than those available.
Acknowledgements
The author would like to thank D. Grekou, D. Leung, H. Liu, R. Macdonald, W. Wang and A. Sharpe for helpful discussions.
Abstract
Labour productivity growth in the business sector in Canada started to decline in 2000, from 2.3% per year in the period from 1991 to 2000 to 1.0% per year in the period from 2000 to 2015. This paper examines how innovation, innovation diffusion across firms, and business dynamism affected the productivity slowdown. The decline in aggregate labour productivity after 2000 was found to be caused by a decline in productivity growth in both frontier firms (defined as the top 10% of the most productive firms in an industry) and—mainly—non-frontier firms (defined as all other firms). The decline in labour productivity growth of non-frontier firms after 2000 accounted for 2.95 percentage points, or 90%, of a 3.21-percentage-point decline in aggregate labour productivity growth between the periods of 1991 to 2000 and 2000 to 2015. This paper also found that the decline in aggregate labour productivity growth was caused by a decline in technical change by frontier firms and, to a lesser extent, by a decline in catch-up of non-frontier firms to frontier firms after 2000. These results suggest that the pace of innovation in frontier firms and the rate of innovation diffusion from frontier firms to non-frontier firms both declined in Canada after 2000, contributing to aggregate productivity slowdown in that period. However, the relative importance of innovation and innovation diffusion is sensitive to the methods used. Finally, this paper found that resource reallocation declined in Canadian firms after 2000, contributing to the decline in aggregate labour productivity growth in the business sector in that period.
Executive summary
Labour productivity growth has slowed in Canada since 2000. This decline in productivity growth also occurred in other developed countries. Labour productivity growth after 2004 has been the weakest on record in most member countries of the Organisation for Economic Co-operation and Development (OECD) since 1950 (OECD 2015).
This paper examines the role of structural factors in the post-2000 productivity growth slowdown in Canada. First, it examines the role that innovation in frontier firms and innovation diffusion from frontier firms to non-frontier firms played in the decline in productivity growth after 2000. The relative impact of innovation and innovation diffusion on the productivity slowdown has been a subject of debate in previous studies. According to Gordon (2016), the slow pace of innovation caused the productivity slowdown in developed countries. However, the OECD presented empirical evidence that the main cause of the productivity slowdown was not a slowing pace of innovation in frontier firms, but rather a slowing pace of innovation diffusion from frontier firms to non-frontier firms that occurred in the early 2000s.
Second, this paper examines the role of changes in business dynamism and changes in resource allocation in the productivity slowdown. Previous studies for Canada, the United States and other developed countries found evidence of declining business start-ups, declining gross job creation and destruction, and rising resource misallocation in the 2000s. However, the extent to which changes in business dynamism and changes in resource allocation contributed to the productivity slowdown is not known.
This paper found that labour productivity growth of frontier firms was higher than that of non-frontier firms. However, labour productivity growth declined for both frontier and non-frontier firms after 2000. The pace of innovation and the pace of innovation diffusion from frontier to non-frontier firms both declined in Canada after 2000.
The decline in innovation in frontier firms and the decline in innovation diffusion from frontier firms to non-frontier firms both contributed to the post-2000 productivity slowdown in Canada. However, their relative importance is sensitive to the methods used for analysis. The largest contributor to the productivity slowdown from a decomposition analysis was the decline in innovation diffusion after 2000. The decline in labour productivity growth of non-frontier firms after 2000 accounted for 2.95 percentage points, or 90%, of a 3.21-percentage-point decline in aggregate labour productivity growth between the periods of 1991 to 2000 and 2000 to 2015. The decline in labour productivity growth of frontier firms accounted for 0.36 percentage points, or 10%, of the decline in aggregate labour productivity growth. In contrast, the largest contributor to productivity slowdown from a stochastic frontier analysis, was a decline in innovation at frontier firms.
There was a decline in business start-ups and business dynamism in Canada over time, and this decline contributed to the decline in aggregate labour productivity growth after 2000. Improved resource reallocation contributed significantly to aggregate labour productivity growth for the period of 1991 to 2000, but the effect of reallocation was essentially zero for the period of 2000 to 2015. The decline in aggregate labour productivity growth after 2000 was caused by the decline in the contribution of resource reallocation after 2000.
In summary, the decline in aggregate labour productivity growth in Canada after 2000 was found to be caused by a decline in innovation in frontier firms, a decline in innovation diffusion from frontier firms to non-frontier firms, and a decline in the effect of resource reallocation and business dynamism on productivity growth.
Frontier firms in this paper are defined as the most productive firms in Canada. It is possible that frontier firms in Canada are less productive than global frontier firms. Therefore, the declining productivity growth of frontier firms may reflect a lack of innovation diffusion from global frontier firms to firms operating in Canada.
1 Introduction
Productivity growth has slowed in Canada and other developed countries since the early 2000s. For example, labour productivity in the United States had been growing at an average rate of 2.1%, year over year. Then, in 2004, the productivity growth rate began to decline, falling to an average of 1.2% per year from 2004 to 2014 (Manyika et al. 2017; Murray 2018). Labour productivity growth in Canada started to decline in 2000, from 1.7% per year in the period from 1980 to 2000 to 1.0% per year in the period from 2000 to 2015 (Gu 2018).Note This decline in productivity growth also occurred in other developed countries. Labour productivity growth after 2004 has been the weakest on record in most member countries of the Organisation for Economic Co-operation and Development (OECD) since 1950 (OECD 2015).
Previous studies have identified a number of explanations for this trend. While the slowdown in productivity growth after 2000 is partly the result of cyclical factors—such as slow output growth and the burst of the dot-com bubble in the early 2000s, and the 2008-to-2009 global financial crisis—a number of structural factors have also been suggested as explanations for this slowdown (Baily and Montalbano 2016; Cette, Corde and Lecat 2017; OECD 2015; Murray 2018). These structural factors include a slower pace of innovation and technological progress, a slowdown in innovation diffusion, changes in competitive intensity, a decline in business dynamism, and resource misallocation—possibly caused by the sharp decline in real interest rates.
This paper examines the role of structural factors in the post-2000 productivity growth slowdown in Canada. First, this paper examines the role that innovation in frontier firms and innovation diffusion from frontier firms to non-frontier firms played in the decline in productivity growth after 2000. According to Gordon (2016), the slow pace of innovation caused the productivity slowdown in developed countries, and current technological advances such as digital technologies, robots and cloud computing are not great enough to drive strong productivity growth. Historical innovations such as steam engines and electricity had far greater impacts on productivity growth than current technological changes. As an alternative explanation for the productivity slowdown, the OECD (2015) presented empirical evidence that the main cause of the productivity slowdown was not a slowing pace of innovation by frontier firms, but rather a slowing pace of innovation diffusion from frontier firms to non-frontier firms in the early 2000s (Andrews, Criscuolo and Gal 2015; OECD 2015).
Second, this paper examines the role of changes in business dynamism and changes in resource allocation in the productivity slowdown. Previous studies for Canada, the United States and other developed countries found evidence of declining business start-ups, declining gross job creation and destruction, and rising resource misallocation in the 2000s (Decker et al. 2016 for the United States; Cao et al. 2017 and Macdonald 2014 for Canada). However, the extent to which changes in business dynamism and changes in resource allocation contributed to the productivity slowdown is not known.
To assess the relative impact of innovation and innovation diffusion on the productivity slowdown, this paper divides all firms in an industry into frontier and non-frontier firms in terms of labour productivity levels, and decomposes aggregate productivity growth into contributions from frontier firms and non-frontier firms. Frontier firms are defined as the top 10% of the most productive firms in an industry. Non-frontier firms include all other firms. Changes in productivity growth of frontier firms over time are used to assess the pace of innovation over time. Changes in productivity growth of non-frontier firms are used to assess the pace of innovation diffusion over time.
The stochastic frontier production function approach was also used as an alternative to this accounting approach to assess the role of innovation in frontier firms and innovation diffusion from frontier firms to non-frontier firms in the productivity slowdown. The stochastic frontier production function approach decomposes productivity growth into technical change and technical efficiency change. Technical change is calculated as the productivity growth of the most productive firms that form the production frontier, and technical efficiency change is calculated as the change in the productivity gap between average firms and the most productive firms over time. It is a measure of non-frontier firms’ ability to catch up to frontier firms. For the purpose of this paper, technical change is interpreted as the pace of innovation in frontier firms, and technical efficiency change represents the rate of innovation diffusion from frontier firms to non-frontier firms.
Previous studies have examined the productivity growth difference between frontier and non-frontier firms, and its implication for aggregate productivity growth. The OECD (2017) found that the dispersion in productivity growth between the best-performing and the worst-performing firms increased in several OECD countries, including Canada, since 2000. Andrews, Criscuolo and Gal (2015) found that the productivity growth of global frontier firms remained robust after 2004, when aggregate productivity growth in advanced economies began to slow. The OECD (2017) and Andrews, Criscuolo and Gal (2015) interpreted this as evidence that the main source of the productivity slowdown was not a slowing pace of innovation by the most globally advanced firms, but rather a slowing pace at which innovations spread throughout the economy (Andrews, Criscuolo and Gal 2015).
Haldane (2017) examined productivity dispersion in the United Kingdom and concluded that the decline in productivity growth in the United Kingdom after the financial crisis, compared with that of the early 2000s, was the result of the poor productivity growth of non-frontier firms. The productivity growth of frontier firms in the United Kingdom was robust after the financial crisis. Cette, Corde and Lecat (2017) found that robust productivity growth of frontier firms in France increased after 2000, and that the pace of innovation did not decline in the 2000s. However, no evidence was found that innovation diffusion from frontier firms to non-frontier firms slowed after 2000 in France.
Most previous studies focused on productivity dispersion and productivity growth of frontier and non-frontier firms in the 2000s, and used this information to provide evidence on the role of innovation and diffusion in aggregate productivity growth in the 2000s. But, as Andrews, Criscuolo and Gal (2015) noted, this data limitation makes it difficult to address the issue of whether productivity growth of frontier and non-frontier firms slowed after 2000, compared with the period before 2000. Therefore, evidence for the 2000s cannot be used alone to examine the role of innovation and innovation diffusion in the post-2000 productivity slowdown. This paper addresses this data limitation by using data over a longer period, including data for both before and after 2000. This provides direct evidence on the role of innovation and innovation diffusion in aggregate productivity growth in the 2000s.
The rest of the paper is organized as follows. Section 2 presents the data used for the analysis. Section 3 presents productivity dispersion of frontier and non-frontier firms, and the firms’ contributions to aggregate productivity growth. Section 4 uses the stochastic frontier approach to decompose productivity growth into technical change (identified as innovation in frontier firms) and technical efficiency change (identified as innovation diffusion from frontier to non-frontier firms). Section 5 examines the effect of resource reallocation on productivity growth over time, and its contribution to the decline in aggregate productivity growth after 2000. Section 6 concludes.
2 Data sources
The data used for this paper are from Statistics Canada’s T2–LEAP longitudinal firm-level database. This database was created by linking two administrative databases: the Longitudinal Employment Analysis Program (LEAP) file and the T2 file.
The LEAP file is a database that includes all employers in Canada, both incorporated and unincorporated, that register a payroll deduction account with the Canada Revenue Agency (CRA). The LEAP file contains longitudinal firm identification numbers, which are used to examine the growth, entry and exit of firms. The firms in the LEAP file have been assigned to industries according to the North American Industry Classification System (NAICS).
The LEAP file was linked to the T2 file, which includes all incorporated firms that file a T2 tax return with the CRA. The linked T2–LEAP file provides data on total sales, payroll, net income and assets for all incorporated firms in Canada. A derived measure of average employment, called average labour units (ALUs), is estimated and added to the file. A firm’s ALUs are calculated as the ratio of the firm’s total payroll to average annual worker wages in that firm’s industry, size, class and province.Note
The database was cleaned for outliers, using a method based on the outliers principle developed by Tukey (1977). This method deletes values located beyond quartile 1 (and 3), which are less (and more) than three times the interquartile spread of labour productivity levels at the three-digit NAICS industry classification level in a year. About 1% of the observations were classified as outliers using this method, and they were removed from this paper’s analysis.
This paper focuses on incorporated businesses in Canada. Businesses in the agriculture, forestry and fishing, health, and education sectors are excluded since measures of output, inputs and productivity are less robust for those sectors. Therefore, this paper examines labour productivity and multifactor productivity (MFP) in the non-farm market sector. Labour productivity is defined as real gross output per worker. MFP is defined as gross output per unit of combined capital, labour and intermediate inputs. Capital input for measuring MFP is estimated as the book values of tangible assets, deflated by an industry capital stock deflator. Intermediate input is measured as sales minus the sum of payroll and capital income (estimated as net income before taxes).
Labour productivity, output and employment are available for the period of 1991 to 2015. MFP and related output and input measures are available for the period of 2000 to 2015 as robust values of tangible assets, and intermediate inputs are available only after 2000.
Labour productivity (gross output per worker) of the non-farm market sector—derived from the T2–LEAP microdata file—shows similar trends as labour productivity (gross output per hour worked) for the business sector, derived from the Statistics Canada industry productivity database. Both estimates of aggregate labour productivity growth declined after 2000. Aggregate labour productivity of the business sector derived from the industry productivity database declined from 2.96% per year for the period from 1991 to 2000 to 0.74% per year for the period from 2000 to 2015. Aggregate labour productivity growth of the non-farm market sector derived from the T2–LEAP file showed a similarly large decline after 2000—from 2.9% per year to -0.07% per year between the two periods.Note
The post-2000 decline in labour productivity growth in Canada has been well documented in previous studies, and numerous studies have focused on the causes of this large decline (e.g., Gu 2018; Sharpe and Tsang 2018). Those studies concluded that the rapid productivity growth in the 1990s can be traced to trade liberalization and the adoption of information and communications technology (ICT) in that period. The slow labour productivity growth after 2000 is related to slower growth in MFP, slower growth in demand, and a decline in the contribution of exporters and large multinational firms in the early 2000s (Baldwin, Gu and Yan 2013; Rao and Li 2013; Baldwin and Gu 2004; Trefler 2004). A decline in MFP growth in the mining sector caused by increased costs for the extraction of natural resources also contributed to the slow productivity growth in the 2000s (Gu 2018).
3 Productivity dispersion and aggregate productivity growth
This section has two main objectives. First, it presents trends in the productivity growth of frontier and non-frontier firms. The productivity growth of frontier firms is commonly associated with innovation and technical change. The productivity growth of non-frontier firms is associated with innovation diffusion from frontier firms to non-frontier firms, or catch-up of non-frontier firms to frontier firms. Second, this section decomposes aggregate productivity growth into contributions of frontier and non-frontier firms. The evidence on contributions of frontier and non-frontier firms enables an assessment of the roles of innovation in frontier firms and innovation diffusion from frontier to non-frontier firms on aggregate productivity growth over time, and their contributions to the decline in productivity growth in Canada after 2000.
The analysis will focus on two periods: 1991 to 2000 and 2000 to 2015. Short-term changes in productivity can be caused by cyclical factors that arise from changes in the use of capital and slow output growth. This was the case in the early 2000s and the early 1990s (Baldwin, Gu and Yan 2013). Focusing on these relatively long periods (1991 to 2000 and 2000 to 2015) removes the cyclical factors’ effect on productivity growth, and therefore identifies the effects of structural factors—such as innovation and technological diffusion—on productivity growth.
Frontier firms are defined as the top 10% of the most productive firms, in terms of labour productivity levels within the three-digit NAICS 2007 classification level. All other firms within a three-digit NAICS industry code are defined as non-frontier firms. There are a total of 87 industries in the non-farm market sector at the three-digit NAICS level of industry aggregation.
3.1 Productivity of frontier and non-frontier firms
This subsection presents the productivity of frontier and non-frontier firms and changes in productivity dispersion in the non-farm market sector in Canada from 1991 to 2015. Both labour and MFP are examined.
Labour productivity (gross output per worker) is presented for the period of 1991 to 2015. MFP (gross output per unit of combined capital, labour and intermediate inputs) is presented for the period after 2000 since the robust estimates of capital stock and intermediate inputs are available only after 2000.
The productivity of frontier and non-frontier firms in logarithm is estimated as each group’s median productivity values. The log difference in productivity between frontier and non-frontier firms is used to measure productivity dispersion. The log difference in productivity between frontier and non-frontier firms at the three-digit NAICS level is aggregated to the log productivity difference at the two-digit NAICS level and for the non-farm market sector, using a simple mean. Therefore, the log difference in productivity at the two-digit NAICS level, or for the non-farm market sector, represents the productivity dispersion in an average three-digit NAICS industry.
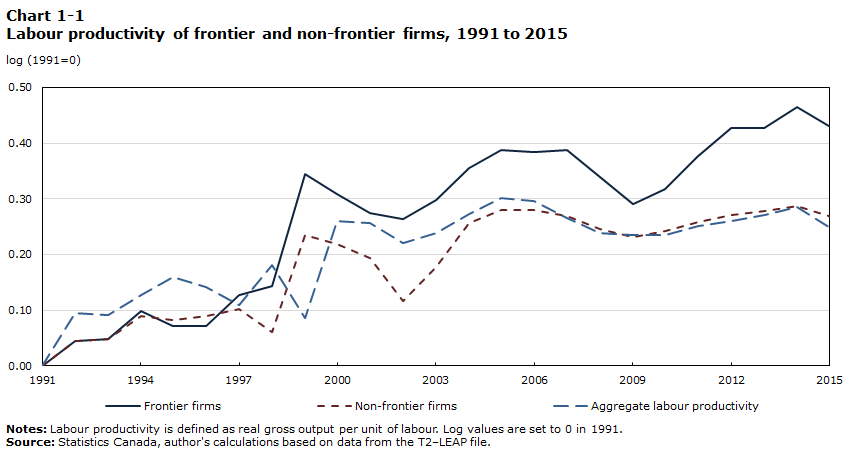
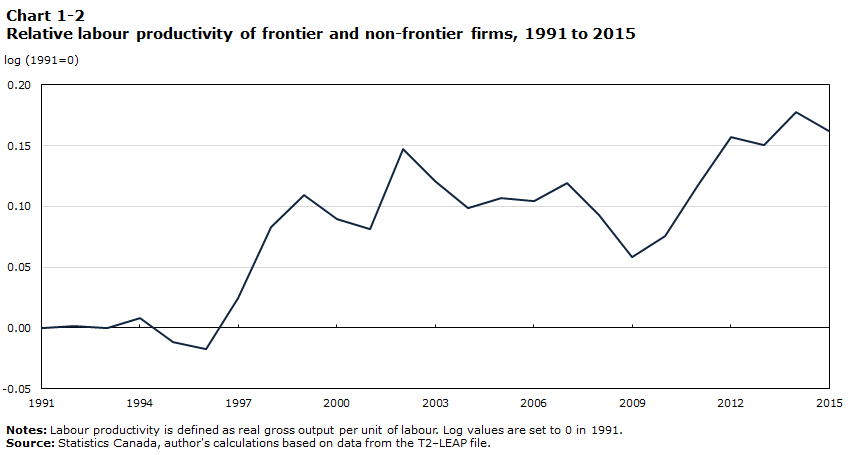
Chart 1-1 presents the labour productivity of frontier and non-frontier firms, and aggregate labour productivity in the non-farm market sector for the period of 1991 to 2015. Chart 1-2 presents the log difference in labour productivity levels between frontier and non-frontier firms over that period. The values are set to zero in 1991 in both charts. The values of the log productivity of frontier and non-frontier firms in a year represent the cumulative log growth in productivity of those two types of firms since 1991.
Over the period of 1991 to 2015, the labour productivity of frontier firms increased faster than that of non-frontier firms in average Canadian industries. The labour productivity of frontier firms increased by a cumulative 0.43 log points, or 54%, over the period from 1991 to 2015. The labour productivity of non-frontier firms increased by 0.27 log points, or 31%, in the same period.Note
The increase in the relative productivity of frontier firms compared with that of non-frontier firms occurred in the second half of the 1990s and in the period after 2009, as shown in Chart 1-2. The productivity dispersion did not change much in the early 1990s and the early 2000s. The pause in the overall trend toward productivity divergence between frontier and non-frontier firms in the early 1990s and the early 2000s was caused by the cyclical factors that arose from slow demand growth and a decline in capacity utilization. This affected exporters and multinationals more than other firms, at least in the manufacturing sector (Baldwin, Gu and Yan 2013). The subsequent increase in the productivity growth gap between frontier and non-frontier firms in the second half of the 1990s and after 2009 was partially caused by increases in capacity utilization in the manufacturing industry, and likely also in other industries (Gu 2018).
To remove the effects of those cyclical factors and focus on the effects of structural factors—such as innovation and innovation diffusion—on productivity growth, this paper focuses on productivity growth for two relatively long periods: 1991 to 2000 and 2000 to 2015. The year 2000 corresponds to the turning point when productivity growth in Canada declined.
Annual average labour productivity growth of frontier and non-frontier firms for 1991 to 2000 and 2000 to 2015 can be calculated using the data in Chart 1-1. Labour productivity growth of frontier firms was higher than that of non-frontier firms in both periods. Labour productivity growth of both frontier and non-frontier firms declined after 2000. The decline was similar for both groups. Labour productivity growth for both groups experienced approximately a 2-percentage-point decline between 1991 to 2000 and 2000 to 2015. Labour productivity growth of frontier firms declined from 3.43% per year in 1991 to 2000 to 1.05% per year in 2000 to 2015. Labour productivity growth of non-frontier firms declined from 2.44% per year to 0.51% per year between the two periods.
Data table for Chart 1-1
| Frontier firms | Non-frontier firms | Aggregate labour productivity | |
|---|---|---|---|
| log (1991=0) | |||
| 1991 | 0.0000 | 0.0000 | 0.0000 |
| 1992 | 0.0456 | 0.0442 | 0.0953 |
| 1993 | 0.0491 | 0.0489 | 0.0916 |
| 1994 | 0.0979 | 0.0898 | 0.1279 |
| 1995 | 0.0711 | 0.0824 | 0.1591 |
| 1996 | 0.0717 | 0.0889 | 0.1409 |
| 1997 | 0.1265 | 0.1017 | 0.1096 |
| 1998 | 0.1437 | 0.0611 | 0.1807 |
| 1999 | 0.3442 | 0.2347 | 0.0868 |
| 2000 | 0.3090 | 0.2193 | 0.2596 |
| 2001 | 0.2741 | 0.1931 | 0.2571 |
| 2002 | 0.2633 | 0.1162 | 0.2213 |
| 2003 | 0.2987 | 0.1782 | 0.2382 |
| 2004 | 0.3547 | 0.2562 | 0.2726 |
| 2005 | 0.3871 | 0.2804 | 0.3017 |
| 2006 | 0.3839 | 0.2799 | 0.2969 |
| 2007 | 0.3880 | 0.2687 | 0.2652 |
| 2008 | 0.3384 | 0.2456 | 0.2388 |
| 2009 | 0.2900 | 0.2319 | 0.2352 |
| 2010 | 0.3183 | 0.2429 | 0.2350 |
| 2011 | 0.3766 | 0.2589 | 0.2520 |
| 2012 | 0.4273 | 0.2706 | 0.2593 |
| 2013 | 0.4274 | 0.2773 | 0.2706 |
| 2014 | 0.4651 | 0.2876 | 0.2846 |
| 2015 | 0.4313 | 0.2694 | 0.2497 |
|
Notes: Labour productivity is defined as real gross output per unit of labour. Log values are set to 0 in 1991. Source: Statistics Canada, author's calculations based on data from the T2–LEAP file. |
|||
Data table for Chart 1-2
| Relative difference | |
|---|---|
| log (1991=0) | |
| 1991 | 0.0000 |
| 1992 | 0.0015 |
| 1993 | 0.0002 |
| 1994 | 0.0081 |
| 1995 | -0.0113 |
| 1996 | -0.0172 |
| 1997 | 0.0248 |
| 1998 | 0.0826 |
| 1999 | 0.1095 |
| 2000 | 0.0897 |
| 2001 | 0.0810 |
| 2002 | 0.1471 |
| 2003 | 0.1205 |
| 2004 | 0.0985 |
| 2005 | 0.1067 |
| 2006 | 0.1041 |
| 2007 | 0.1193 |
| 2008 | 0.0929 |
| 2009 | 0.0580 |
| 2010 | 0.0754 |
| 2011 | 0.1177 |
| 2012 | 0.1568 |
| 2013 | 0.1502 |
| 2014 | 0.1775 |
| 2015 | 0.1619 |
|
Notes: Labour productivity is defined as real gross output per unit of labour. Log values are set to 0 in 1991. Source: Statistics Canada, author's calculations based on data from the T2–LEAP file. |
|
Before 2000, productivity growth in Canada was rapid. The rapid progress in ICT and the adoption of ICT and associated changes by business organizations were the main force behind this rapid productivity growth (Gu and Willox 2018; Ho, Rao and Tang 2004). Trade liberation and the implementation of the Canada–U.S. Free Trade Agreement and the North American Free Trade Agreement also contributed to productivity growth (Trefler 2004, Baldwin and Gu 2004). As a result, productivity growth of frontier and non-frontier firms was high for the period from 1991 to 2000.
Productivity growth declined after 2000 for frontier and non-frontier firms. To the extent that productivity growth of frontier firms captures innovation and productivity, growth of non-frontier firms captures innovation diffusion. Evidence suggests that the pace of innovation and the pace of innovation diffusion from frontier to non-frontier firms both declined in Canada after 2000.
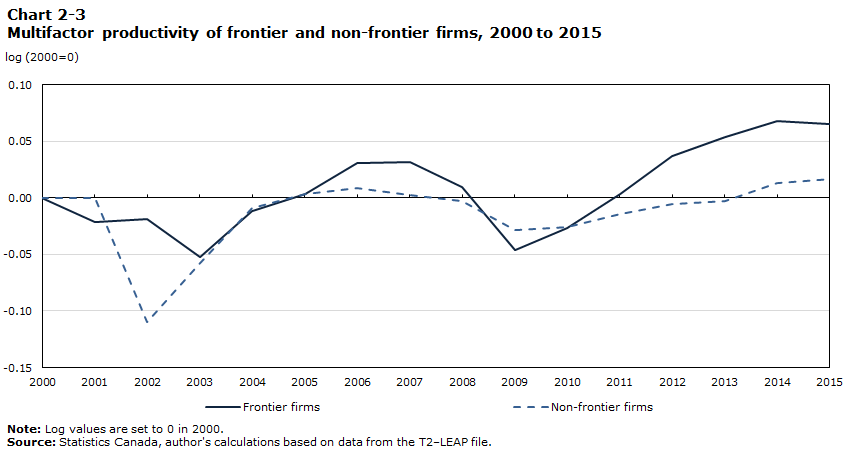
Charts 2-1, 2-2 and 2-3 compare the capital/labour ratio, intermediate input / labour ratio, and MFP of frontier and non-frontier firms over the period from 2000 to 2015. The frontier firms in these charts are defined as the top 10% of firms in terms of labour productivity levels.
Chart 2-1 shows that the capital/labour ratio increased for both frontier and non-frontier firms over the period from 2000 to 2015. This increase was similar for frontier and non-frontier firms. Chart 2-2 shows that the intermediate input / labour ratio experienced little change for both frontier and non-frontier firms from 2000 to 2015. Because of similar changes in capital and intermediate input intensities in frontier and non-frontier firms, most of the divergence in labour productivity between frontier and non-frontier firms for the period of 2000 to 2015 was because of divergence in MFP, as shown in Chart 2-3.

Data table for Chart 2-1
| Frontier firms | Non-frontier firms | |
|---|---|---|
| log (2000=0) | ||
| 2000 | 0.0000 | 0.0000 |
| 2001 | 0.0220 | -0.0235 |
| 2002 | -0.0059 | 0.0493 |
| 2003 | 0.1680 | 0.0977 |
| 2004 | 0.1246 | 0.1174 |
| 2005 | 0.1612 | 0.1452 |
| 2006 | 0.0452 | 0.1335 |
| 2007 | 0.1027 | 0.1210 |
| 2008 | 0.0716 | 0.1087 |
| 2009 | 0.1590 | 0.1584 |
| 2010 | 0.1915 | 0.1924 |
| 2011 | 0.2394 | 0.2042 |
| 2012 | 0.2436 | 0.2099 |
| 2013 | 0.2235 | 0.2257 |
| 2014 | 0.2747 | 0.2193 |
| 2015 | 0.2242 | 0.2000 |
|
Note: Log values are set to 0 in 2000. Source: Statistics Canada, author's calculations based on data from the T2–LEAP file. |
||

Data table for Chart 2-2
| Frontier firms | Non-frontier firms | |
|---|---|---|
| log (2000=0) | ||
| 2000 | 0.0000 | 0.0000 |
| 2001 | -0.0403 | -0.0461 |
| 2002 | -0.0550 | -0.0102 |
| 2003 | 0.0035 | -0.0148 |
| 2004 | 0.0612 | 0.0401 |
| 2005 | 0.0788 | 0.0513 |
| 2006 | 0.0729 | 0.0448 |
| 2007 | 0.0518 | 0.0404 |
| 2008 | 0.0081 | 0.0080 |
| 2009 | -0.0218 | 0.0081 |
| 2010 | -0.0221 | 0.0066 |
| 2011 | 0.0149 | 0.0115 |
| 2012 | 0.0486 | 0.0145 |
| 2013 | 0.0233 | 0.0141 |
| 2014 | 0.0484 | 0.0056 |
| 2015 | 0.0070 | -0.0304 |
|
Note: Log values are set to 0 in 2000. Source: Statistics Canada, author's calculations based on data from the T2–LEAP file. |
||
Data table for Chart 2-3
| Frontier firms | Non-frontier firms | |
|---|---|---|
| log (2000=0) | ||
| 2000 | 0.0000 | 0.0000 |
| 2001 | -0.0213 | 0.0003 |
| 2002 | -0.0190 | -0.1099 |
| 2003 | -0.0519 | -0.0575 |
| 2004 | -0.0118 | -0.0093 |
| 2005 | 0.0037 | 0.0030 |
| 2006 | 0.0311 | 0.0083 |
| 2007 | 0.0313 | 0.0022 |
| 2008 | 0.0094 | -0.0029 |
| 2009 | -0.0465 | -0.0287 |
| 2010 | -0.0262 | -0.0255 |
| 2011 | 0.0034 | -0.0146 |
| 2012 | 0.0374 | -0.0058 |
| 2013 | 0.0541 | -0.0027 |
| 2014 | 0.0676 | 0.0131 |
| 2015 | 0.0654 | 0.0164 |
|
Note: Log values are set to 0 in 2000. Source: Statistics Canada, author's calculations based on data from the T2–LEAP file. |
||
Table 1 presents labour productivity growth of frontier and non-frontier firms at the two-digit NAICS level for 1991 to 2015. For 1991 to 2015, labour productivity growth of frontier firms was higher than that of non-frontier firms in almost all industries except in three service industries: arts, entertainment and recreation; accommodation and food services; and other services. The biggest productivity growth difference between frontier and non-frontier firms was in utilities; mining and oil and gas extraction; broadcasting and telecommunications; construction; and finance, insurance and real estate.
| Industry | Frontier firms | Non-frontier firms | Frontier firms less non-frontier firms |
|---|---|---|---|
| percent per year | |||
| Mining and oil and gas extraction | 2.16 | -0.28 | 2.44 |
| Utilities | 7.76 | 4.17 | 3.59 |
| Construction | 1.68 | 0.43 | 1.25 |
| Manufacturing | 1.41 | 1.40 | 0.01 |
| Wholesale and retail trade | 2.40 | 1.46 | 0.94 |
| Transportation and warehousing | 1.79 | 1.25 | 0.54 |
| Information and culture | 1.74 | 1.01 | 0.73 |
| Broadcasting and telecommunications | 2.05 | 0.49 | 1.55 |
| Finance, insurance and real estate | 1.48 | 0.34 | 1.14 |
| Arts, entertainment and recreation | 0.56 | 0.76 | -0.20 |
| Accommodation and food services | 0.29 | 0.53 | -0.24 |
| Other services | 0.65 | 0.98 | -0.33 |
| All | 1.80 | 1.12 | 0.67 |
|
Note: Frontier firms are defined as the top 10% of the most productive firms in a three-digit industry of the North American Industry Classification System and in a year. Source: Statistics Canada, author's calculations based on data from the T2–LEAP file. |
|||
This labour productivity divergence occurred in both periods (1991 to 2000 and 2000 to 2015), as shown in Table 2. The productivity growth gap between frontier and non-frontier firms in the two periods was not correlated across industries. This suggests that different forces shaped the productivity divergence in those two periods. For example, the productivity divergence in the late 1990s could have been caused by the adoption of ICT, while the productivity divergence in the late 2000s could have been caused by the use of digital technologies.
| Frontier firms | Non-frontier firms | Frontier firms less non-frontier firms |
|
|---|---|---|---|
| percent per year | |||
| 1991 to 2000 | |||
| Mining and oil and gas extraction | 5.24 | 2.25 | 3.00 |
| Utilities | 17.69 | 6.45 | 11.24 |
| Construction | 4.03 | 2.69 | 1.34 |
| Manufacturing | 2.41 | 1.91 | 0.50 |
| Wholesale and retail trade | 4.54 | 3.27 | 1.28 |
| Transportation and warehousing | 3.75 | 3.39 | 0.36 |
| Information and culture | 1.61 | 1.61 | 0.01 |
| Broadcasting and telecommunications | 4.57 | 1.35 | 3.23 |
| Finance, insurance and real estate | 1.46 | 1.41 | 0.05 |
| Arts, entertainment and recreation | 1.16 | 2.47 | -1.31 |
| Accommodation and food services | 2.10 | 1.31 | 0.79 |
| Other services | 1.80 | 1.88 | -0.08 |
| All | 3.43 | 2.44 | 1.00 |
| 2000 to 2015 | |||
| Mining and oil and gas extraction | 0.83 | -1.57 | 2.40 |
| Utilities | 3.31 | 2.58 | 0.72 |
| Construction | 0.85 | -0.70 | 1.55 |
| Manufacturing | 0.73 | 0.81 | -0.08 |
| Wholesale and retail trade | 1.17 | 0.40 | 0.77 |
| Transportation and warehousing | 0.65 | -0.02 | 0.67 |
| Information and culture | 0.89 | 0.68 | 0.20 |
| Broadcasting and telecommunications | 2.99 | 2.23 | 0.76 |
| Finance, insurance and real estate | 1.98 | 0.12 | 1.86 |
| Arts, entertainment and recreation | 0.30 | -0.66 | 0.96 |
| Accommodation and food services | -0.36 | 0.24 | -0.60 |
| Other services | 0.70 | 0.54 | 0.16 |
| All | 1.51 | 0.51 | 0.54 |
|
Note: Frontier firms are defined as the top 10% of the most productive firms in a three-digit industry of the North American Industry Classification System and in a year. Source: Statistics Canada, author's calculations based on data from the T2–LEAP file. |
|||
3.2 Contribution of frontier and non-frontier firms to aggregate labour productivity growth
This subsection decomposes aggregate labour productivity growth into contributions of frontier and non-frontier firms. The aggregate labour productivity growth in an industry can be decomposed into three components: contribution from frontier firms, contribution from non-frontier firms, and contribution from share changes of frontier and non-frontier firms.
Specifically, aggregate labour productivity in year ( ) is equal to a weighted average of labour productivity of frontier and non-frontier firms:
where is the share of frontier firms in employment in year , is the share of non-frontier firms in total employment in year , is the labour productivity of frontier firms in year , and is the labour productivity of non-frontier firms in year .
The change in aggregate labour productivity between year and year can be written as:
where a bar over a variable presents the average values of the variable in years and . The first term on the right is the contribution of frontier firms to aggregate labour productivity growth, which is estimated as the change in labour productivity of the frontier firms over two years, multiplied by the shares of frontier firms in total employment averaged over two years. The second term is the contribution of non-frontier firms to aggregate labour productivity growth, which is equal to the change in labour productivity of the non-frontier firms multiplied by the shares of non-frontier firms in total employment. The third term is the contribution of the share changes of frontier and non-frontier firms. This contribution is positive when there is a shift in the shares of employment toward frontier firms, which tend to be more productive.
The decomposition is expressed in labour productivity levels. To implement the decomposition, labour productivity will be expressed in logarithms to reduce the impact of extreme values on the estimates, a practice that is commonly used in labour productivity decomposition (e.g., see Foster, Haltiwanger and Krizan 2001; Baldwin and Gu 2006; OECD 2017).
To ensure that the sum of three components in the decomposition is equal to aggregate labour productivity growth, the labour productivity of frontier and non-frontier firms is calculated as a weighted average of labour productivity in that group of firms, using employment as weights. This differs from the analysis of productivity dispersion of frontier and non-frontier firms in Subsection 3.1, where the productivity of a group of firms was estimated as the median value of that group.
The decomposition of aggregate labour productivity into the contributions of frontier and non-frontier firms is done at the three-digit NAICS level. The results are then aggregated to the two-digit NAICS level and to the non-farm market sector, using industry employment as weights.
Table 3 presents average shares of frontier firms in employment, and gross output by industry. Frontier firms accounted for about 8% of total employment and about 30% of gross output in Canadian industries for the period of 1991 to 2015.
The share of frontier firms in employment declined from 10% in 1991 to 6% in 2015. The fact that the share of frontier firms in total employment was the same as their share in the number of firms (at 10%) in 1991 suggests that frontier firms were similar in size to non-frontier firms in terms of employment in 1991. However, by 2015, the share of frontier firms in total employment was smaller than their share in the number of firms. This suggests that frontier firms were smaller than non-frontier firms in terms of employment in 2015.
The shares of frontier firms in employment differed across industries, as shown in Table 3. The shares in total employment were smaller than 10% in most industries. The frontier firms were smaller than the non-frontier firms in terms of employment in almost all industries, except mining and oil and gas extraction, manufacturing, and broadcasting and telecommunications.
| Industry | Share of employment | Share of gross output |
|---|---|---|
| percent | ||
| Mining and oil and gas extraction | 16.54 | 43.67 |
| Utilities | 8.95 | 47.56 |
| Construction | 4.33 | 20.18 |
| Manufacturing | 17.21 | 48.11 |
| Wholesale and retail trade | 7.27 | 29.16 |
| Transportation and warehousing | 5.31 | 31.46 |
| Information and culture | 6.46 | 25.29 |
| Broadcasting and telecommunications | 12.70 | 36.86 |
| Finance, insurance and real estate | 3.81 | 27.22 |
| Arts, entertainment and recreation | 5.27 | 37.11 |
| Accommodation and food services | 2.23 | 7.68 |
| Other services | 4.59 | 21.23 |
| All | 7.89 | 31.29 |
|
Note: Frontier firms are defined as the top 10% of the most productive firms in a three-digit industry of the North American Industry Classification System and in a year. Source: Statistics Canada, author's calculations based on data from the T2–LEAP file. |
||
The share of frontier firms in gross output was about 30% in the period of 1991 to 2015, and was virtually unchanged over that period. In addition, shares were more than 10% in all industries except accommodation and food services. When size is measured by gross output, frontier firms were larger than non-frontier firms in almost all industries except accommodation and food services. In the accommodation and food services industry, frontier firms were smaller than non-frontier firms in terms of gross output.
Table 4 presents a decomposition of aggregate labour productivity growth in the non-farm market sector into the contributions of frontier and non-frontier firms. Frontier firms accounted for 11% of aggregate labour productivity growth in the period of 1991 to 2000, and 9% of aggregate labour productivity growth in the period of 2000 to 2015. The contributions of frontier firms to aggregate labour productivity were higher than their shares in employment because of the relatively high productivity growth of the frontier firms compared with that of non-frontier firms.
| 1991 to 2000 | 2000 to 2015 | 2000 to 2015 less 1991 to 2000 |
|
|---|---|---|---|
| percent per year | |||
| Aggregate labour productivity growth | 3.55 | 0.34 | -3.21 |
| Contributions of | |||
| Frontier firms | 0.39 | 0.03 | -0.36 |
| Non-frontier firms | 3.30 | 0.35 | -2.95 |
| Share changes | -0.14 | -0.04 | 0.10 |
| Addendum | |||
| Labour productivity growth | |||
| Frontier firms | 3.43 | 1.51 | -1.92 |
| Non-frontier firms | 2.44 | 0.51 | -1.93 |
| percent | |||
| Share of frontier firms in employment | 8.74 | 7.06 | Note ...: not applicable |
|
... not applicable Note: Frontier firms are defined as the top 10% of the most productive firms in a three-digit industry of the North American Industry Classification System and in a year. Source: Statistics Canada, author's calculations based on data from the T2–LEAP file. |
|||
| Aggregate labour productivity growth |
Frontier firms | Non-frontier firms | Share changes | |
|---|---|---|---|---|
| percent per year | ||||
| 1991 to 2000 | ||||
| Mining and oil and gas extraction | 3.74 | 0.95 | 3.41 | -0.62 |
| Utilities | -9.62 | 1.79 | -5.84 | -5.57 |
| Construction | 2.24 | 0.18 | 2.16 | -0.10 |
| Manufacturing | 4.15 | 0.38 | 3.10 | 0.67 |
| Wholesale and retail trade | 5.03 | 0.55 | 4.98 | -0.49 |
| Transportation and warehousing | 4.14 | 0.44 | 3.42 | 0.28 |
| Information and culture | 5.74 | 0.40 | 5.58 | -0.25 |
| Broadcasting and telecommunications | 2.35 | 0.53 | 2.75 | -0.92 |
| Finance, insurance and real estate | 2.09 | 0.07 | 1.99 | 0.02 |
| Arts, entertainment and recreation | 1.61 | 0.41 | 0.94 | 0.26 |
| Accommodation and food services | 1.85 | 0.08 | 1.84 | -0.08 |
| Other services | 4.07 | 0.18 | 4.05 | -0.16 |
| All | 3.55 | 0.39 | 3.30 | -0.14 |
| 2000 to 2015 | ||||
| Mining and oil and gas extraction | -3.63 | 0.29 | -3.00 | -0.92 |
| Utilities | 12.21 | -0.04 | 12.73 | -0.48 |
| Construction | -0.43 | -0.03 | -0.32 | -0.08 |
| Manufacturing | 1.82 | 0.32 | 1.53 | -0.04 |
| Wholesale and retail trade | -0.19 | -0.17 | -0.36 | 0.33 |
| Transportation and warehousing | 0.30 | -0.19 | 0.42 | 0.07 |
| Information and culture | -0.26 | 0.16 | -0.46 | 0.05 |
| Broadcasting and telecommunications | 0.21 | 0.13 | 0.72 | -0.64 |
| Finance, insurance and real estate | 0.02 | 0.05 | 0.08 | -0.11 |
| Arts, entertainment and recreation | 0.25 | -0.02 | 0.32 | -0.05 |
| Accommodation and food services | -0.18 | -0.02 | -0.15 | 0.00 |
| Other services | 0.70 | 0.10 | 0.95 | -0.36 |
| All | 0.34 | 0.03 | 0.35 | -0.04 |
|
Note: Frontier firms are defined as the top 10% of the most productive firms in a three-digit industry of the North American Industry Classification System and in a year. Source: Statistics Canada, author's calculations based on data from the T2–LEAP file. |
||||
The contributions of frontier and non-frontier firms to aggregate labour productivity growth declined after 2000. This suggests that the contributions of innovation and innovation diffusion to aggregate labour productivity growth both declined after 2000. The decline in innovation in frontier firms and the decline in innovation diffusion from frontier firms to non-frontier firms both contributed to the productivity slowdown after 2000 in Canada.
Most of the decline in labour productivity growth is from the decline in the contribution of non-frontier firms. The decline in innovation diffusion had more of an impact on the post-2000 productivity slowdown in Canada than the decline in innovation. The decline in labour productivity growth of non-frontier firms after 2000 accounted for 2.95 percentage points, or about 90%, of a 3.21-percentage-point decline in aggregate labour productivity growth in that period. The decline in labour productivity growth of frontier firms contributed about 10% of aggregate labour productivity growth after 2000.
Table 5 presents the decomposition of aggregate labour productivity growth into the contributions of frontier and non-frontier firms at the two-digit NAICS industry level for the periods of 1991 to 2000 and 2000 to 2015. Table 6 presents the contributions of frontier and non-frontier firms to the decline in aggregate labour productivity growth between the two periods.
| Industry | Aggregate labour productivity growth | Frontier firms | Non-frontier firms | Share changes |
|---|---|---|---|---|
| percent per year | ||||
| Mining and oil and gas extraction | -7.37 | -0.66 | -6.41 | -0.30 |
| Utilities | 21.83 | -1.84 | 18.58 | 5.08 |
| Construction | -2.67 | -0.21 | -2.48 | 0.02 |
| Manufacturing | -2.33 | -0.06 | -1.57 | -0.70 |
| Wholesale and retail trade | -5.23 | -0.72 | -5.34 | 0.83 |
| Transportation and warehousing | -3.84 | -0.63 | -3.00 | -0.20 |
| Information and culture | -5.99 | -0.25 | -6.04 | 0.30 |
| Broadcasting and telecommunications | -2.14 | -0.39 | -2.03 | 0.28 |
| Finance, insurance and real estate | -2.07 | -0.02 | -1.92 | -0.13 |
| Arts, entertainment and recreation | -1.36 | -0.43 | -0.62 | -0.31 |
| Accommodation and food services | -2.03 | -0.11 | -1.99 | 0.07 |
| Other services | -3.38 | -0.08 | -3.10 | -0.20 |
| All | -3.21 | -0.36 | -2.95 | 0.10 |
|
Note: Frontier firms are defined as the top 10% of the most productive firms in a three-digit industry of the North American Industry Classification System and in a year. Source: Statistics Canada, author's calculations based on data from the T2–LEAP file. |
||||
Labour productivity growth declined after 2000 in almost all industries. Both frontier and non-frontier firms contributed to this decline in labour productivity since the productivity growth of both groups of firms declined after 2000 in almost all industries. This suggests that innovation and innovation diffusion both declined, contributing to the decline in productivity growth after 2000 in almost all industries in Canada.
Although the relative importance of innovation and innovation diffusion for productivity growth is sensitive to the classification of frontier and non-frontier firms, the overall conclusion that declines in innovation and in innovation diffusion contributed to the post-2000 decline in productivity growth is not. The same results hold when frontier firms are defined as the top 5%, top 15% or top 20% of firms in terms of productivity levels.
To further assess the robustness of the results, an alternative approach—stochastic frontier analysis—will be used in the next section to examine the contribution to aggregate labour productivity growth of innovation in frontier firms and the catch-up of non-frontier firms to frontier firms.
4 Technical change of frontier firms and catch-up of non-frontier firms
This section uses the stochastic frontier approach of Meeusen and van den Broeck (1977) and Aigner, Lovell and Schmidt (1977) to decompose aggregate productivity growth into technical change and technical efficiency change. The stochastic frontier approach provides an alternative decomposition of productivity growth into the contributions of innovation in frontier firms and innovation diffusion from frontier to non-frontier firms.
The stochastic frontier production function establishes a statistical relationship between inputs and outputs for the most efficient, or frontier, firms.Note A shift in the frontier production function represents the productivity growth of the frontier firms. The residuals in the stochastic frontier production function measure the productivity of average firms, relative to the frontier firms.
Specifically, the stochastic frontier production function can be written as:
where represents the logarithm of gross output of firm in year ; is a vector of inputs in logarithm; is a full set of year dummy variables; is a full set of industry dummy variables; and are the parameters to be estimated. The composite error term is a sum of two components: a normally distributed error term that represents measurement and specification errors, and a one-sided normally distributed disturbance that represents inefficiency.
In previous studies on productivity dispersion and productivity growth dynamics, the residual is interpreted as the productivity of average firms relative to frontier firms (Bartelsman and Wolf 2017, Foster et al. 2016). This differs from the interpretation in the stochastic frontier analysis. In the stochastic frontier analysis, the residual consists of two components: . Only one component, , measures the productivity of a firm relative to that of a frontier firm. The other component, , represents measurement or specification errors. This paper will adopt the interpretation from studies on productivity dispersion and productivity growth dynamics. The composite residual is used to measure the productivity of a firm relative to frontier firms.
The frontier production function is estimated using a cross-sectional stochastic model. The dependent variable is labour productivity (gross output per worker) in logarithm. The independent variables include labour in logarithm, a full set of years, a full set of industry dummy variables for two-digit NAICS industries, and interaction of year and industry dummy variables.Note
The estimated stochastic frontier model can be used to decompose aggregate labour productivity into two components: technical change that represents the shifts in the frontier production function, and technical efficiency change that represents the catch-up of average firms to the production frontiers. The coefficient estimates on the full set of year dummy variables and industry dummy variables, and the interaction of year and industry dummy variables, provide an estimate of shifts in the frontier production function or technical change of the most productive firms in each year. Technical change is allowed to differ across industries in the specification. The estimated residuals are aggregated to an industry, using employment as weights, to derive a measure of technical efficiency change. The sum of technical change and technical efficiency change is equal to aggregate labour productivity growth.
The results are presented in Table 7. Labour productivity growth declined in the non-farm market sector after 2000. The decline was caused by a decline in technical change and to a lesser extent, a decline in technical efficiency change after 2000. This can be seen as evidence that the pace of innovation in frontier firms and the rate of innovation diffusion from frontier firms to non-frontier firms both declined after 2000, contributing to the decline in aggregate labour productivity growth after 2000. This evidence is consistent with the decomposition results from the comparison of frontier and non-frontier firms.
| 1991 to 2000 | 2000 to 2015 | 2000 to 2015 less 1991 to 2000 |
|
|---|---|---|---|
| percent per year | |||
| Aggregate labour productivity growth | 3.55 | 0.34 | -3.21 |
| Contributions of | |||
| Technical changes | 2.44 | 0.11 | -2.33 |
| Technical efficiency changes | 1.09 | 0.26 | -0.83 |
| Residual | 0.02 | -0.03 | -0.05 |
| Source: Statistics Canada, author's calculations based on data from the T2–LEAP file. | |||
While data on tangible assets are available only after 2000, data on total assets are available for the entire period of 1991 to 2015. Total assets were found to be highly correlated with tangible assets across firms, and were used as measures of capital stock when estimating the stochastic frontier production function on gross output, which includes labour and capital as inputs for the period of 1991 to 2015. The productivity estimate from this expanded stochastic frontier model provides a measure of a partial MFP that includes capital and labour as inputs, but excludes intermediate inputs. The results from this expanded stochastic frontier model are similar to the results that include only labour as an input. Both technical change and technical efficiency change measured on partial MFP declined after 2000. This decline contributed to a decline in MFP growth after 2000.
5 Resource reallocation and aggregate labour productivity growth
Aggregate productivity growth can increase when productivity increases within firms, or when the share of employment and output increases in more productive firms and falls in less productive firms. Decker et al. (2016) found that this reallocation happened to a lesser extent in the post-2000 period, particularly in the high-tech sector, with implications for overall productivity growth.
This section uses the Olley and Pakes (OP) decomposition to decompose aggregate labour productivity growth into the contribution from productivity growth within firms and the contribution from the reallocation of employment between firms (Olley and Pakes 1996).
Aggregate labour productivity in an industry is equal to the sum of an unweighted average of firm-level productivities and a covariance term that represents reallocation (also called the OP gap). The latter is a measure of allocative efficiency, since it increases if more productive firms increase their share of resources in the sector:
where is the aggregate labour productivity level in year t, which is equal to a weighted sum of labour productivity across firms using employment as weights; is the labour productivity level of firm in year ; and is the share of firm in total employment in year . A bar over a period is the simple unweighted mean of that variable in that industry. While labour productivity is measured in levels in this OP decomposition, it will be measured in log terms in its implementation to alleviate the effect of extreme values.
When labour productivity is measured in log terms, the log changes in aggregate labour productivity are the sum of log changes in unweighted labour productivity and the log changes in the OP covariance term. The log changes in the unweighted mean of labour productivity over a period measure the contribution of productivity growth within firms to aggregate labour productivity growth. The log changes in the OP gap measure the contribution of reallocation to aggregate labour productivity growth.
Chart 3 presents the trend in the OP covariance term. As labour productivity is measured in logs, the changes in OP covariance measure the gains in labour productivity from reallocation. The chart presents two measures of the OP covariance term. The first measure is calculated at the two-digit NAICS level and then aggregated to the total non-farm market sector using employment as weights. The second measure is calculated at the three-digit NAICS level and then aggregated to the total non-farm market sector. Both measures show similar trends.

Data table for Chart 3
| Two-digit NAICS level | Three-digit NAICS level | |
|---|---|---|
| decimals | ||
| 1991 | -0.0200 | -0.0258 |
| 1992 | -0.0047 | -0.0090 |
| 1993 | 0.0139 | 0.0103 |
| 1994 | 0.0260 | 0.0255 |
| 1995 | 0.0263 | 0.0251 |
| 1996 | 0.0170 | 0.0164 |
| 1997 | 0.0319 | 0.0324 |
| 1998 | 0.0400 | 0.0433 |
| 1999 | 0.0508 | 0.0561 |
| 2000 | 0.0305 | 0.0374 |
| 2001 | 0.0176 | 0.0263 |
| 2002 | 0.0168 | 0.0255 |
| 2003 | 0.0095 | 0.0198 |
| 2004 | 0.0075 | 0.0215 |
| 2005 | 0.0056 | 0.0258 |
| 2006 | -0.0019 | 0.0224 |
| 2007 | -0.0061 | 0.0169 |
| 2008 | 0.0016 | 0.0187 |
| 2009 | 0.0111 | 0.0242 |
| 2010 | 0.0159 | 0.0302 |
| 2011 | 0.0112 | 0.0287 |
| 2012 | 0.0152 | 0.0339 |
| 2013 | 0.0223 | 0.0389 |
| 2014 | 0.0248 | 0.0374 |
| 2015 | 0.0235 | 0.0344 |
|
Notes: NAICS: North American Industry Classification System. The index of between-firm reallocation is calculated as a three-year moving average of the Olley-Pakes covariance term. The change in Olley-Pakes covariance term measures the contribution of reallocation to aggregate labour productivity growth. Source: Statistics Canada, author's calculations based on data from the T2–LEAP file. |
||
There was an increase in the effect of reallocation in the 1990s as labour was reallocated to firms with relatively higher labour productivity levels. The reallocation occurred as employment shifted from growing incumbents and entrants with relatively higher productivity levels to declining incumbents and exitors with relatively lower productivity levels. The effect of reallocation declined in the early 2000s as a result of slow growth and the tech bubble bursting in that period. After the financial crisis, there was an increase in the effect of reallocation on labour productivity growth.
The recession in the early 1990s in Canada is associated with an increase in the effect of reallocation on productivity growth, possibly because the recession drove out the least efficient firms. The slow growth of the early 2000s is associated with a decline in the effect of reallocation, possibly because of distortions to reallocation dynamics. This evidence for Canada is broadly consistent with the evidence of Foster, Grim and Haltiwanger (2016) for the United States.
Overall, the improved reallocation at the three-digit NAICS level contributed 0.70% per year to aggregate labour productivity growth for the period of 1991 to 2000 (Table 8).Note The effect of reallocation on aggregate productivity growth was essentially zero over the period of 2000 to 2015, which reflects an increasing reallocation effect in the late 2000s that was more than offset by the declining reallocation effect before the financial crisis of 2008 to 2009.
| 1991 to 2000 | 2000 to 2015 | 2000 to 2015 less 1991 to 2000 |
|
|---|---|---|---|
| percent per year | |||
| Aggregate labour productivity growth | 3.55 | 0.34 | -3.21 |
| Contributions of | |||
| Reallocation | 0.70 | -0.02 | -0.72 |
| Within-firm productivity growth | 2.85 | 0.36 | -2.49 |
|
Note: The effect of reallocation is calculated as the changes in the Olley-Pakes covariance term at the three-digit industry level of the North American Industry Classification System. Source: Statistics Canada, author's calculations based on data from the T2–LEAP file. |
|||
This suggests that the decline in aggregate labour productivity growth after 2000 was partly due to a decline in the contribution of resource reallocation in that period. There seems to be a decline in business start-ups and business dynamism in Canada over time, which contributed to the decline in aggregate labour productivity growth after 2000.
6 Conclusion
Productivity growth has slowed in Canada since the 2000s. This paper examined the causes of the productivity slowdown in Canada. First, it examined the role of innovation and innovation diffusion in the post-2000 productivity slowdown. Then, it examined the role of changes in business dynamism and resource allocation in the productivity slowdown.
The paper found that labour productivity growth of frontier firms was higher than that of non-frontier firms. However, labour productivity growth declined for both frontier and non-frontier firms after 2000. The pace of innovation and the pace of innovation diffusion from frontier to non-frontier firms both declined in Canada after 2000.
The contributions of frontier and non-frontier firms to aggregate labour productivity growth declined after 2000. The decline in labour productivity growth of non-frontier firms after 2000 accounted for 2.95 percentage points, or 90%, of a 3.21-percentage-point decline in aggregate labour productivity growth between the periods of 1991 to 2000 and 2000 to 2015. The decline in innovation in frontier firms and the decline in innovation diffusion from frontier firms to non-frontier firms both contributed to the post-2000 productivity slowdown in Canada. However, the largest contributor to the productivity slowdown was the decline in innovation diffusion after 2000.
A stochastic frontier analysis that decomposed labour productivity growth into contributions from technical change and technical efficiency change confirmed the decomposition results from the classification of firms into frontier and non-frontier firms. It found that the pace of innovation in frontier firms and the rate of innovation diffusion from frontier firms to non-frontier firms both declined after 2000, contributing to aggregate labour productivity slowdown after 2000. However, a decline in innovation was a more important source of productivity slowdown.
Improved resource reallocation contributed significantly to aggregate labour productivity growth for the period of 1991 to 2000, but the effect of reallocation was essentially zero over the period of 2000 to 2015. This decline in the contribution of resource reallocation after 2000 contributed to the decline in aggregate labour productivity growth after 2000. Business start-ups and business dynamism appear to have declined in Canada over time, and this contributed to the decline in aggregate labour productivity growth after 2000.
In summary, the decline in aggregate labour productivity growth in Canada after 2000 was found to be caused by a decline in innovation in frontier firms, a decline in innovation diffusion from frontier firms to non-frontier firms, and a decline in the effect of resource reallocation and business dynamism on productivity growth.
The frontier firms in this paper were defined as the most productive firms in Canada. It is possible that frontier firms in Canada are less productive than global frontier firms. Therefore, the smaller productivity growth of frontier firms may reflect a lack of innovation diffusion from global frontier firms to firms operating in Canada.
References
Aigner, D., C. Lovell, and P. Schmidt. 1977. “Formulation and estimation of stochastic frontier production function models.” Journal of Econometrics 6 (1): 21–37.
Andrews, D., C. Criscuolo, and P.N. Gal. 2015. Frontier Firms, Technology Diffusion and Public Policy: Micro Evidence from OECD Countries. OECD Productivity Working Papers, no. 2. Paris, France: Organisation for Economic Co-operation and Development.
Baily, M.N., and N. Montalbano. 2016. Why is US Productivity Growth so Slow? Possible Explanations and Policy Responses. Hutchins Center Working Paper, no. 22. Washington, D.C.: Brookings Institution.
Baldwin, J.R., and W. Gu. 2004. “Trade liberalization: Export-market participation, productivity growth, and innovation.” Oxford Review of Economic Policy 20 (3): 372–392.
Baldwin, J.R., and W. Gu. 2006. “Plant turnover and productivity growth in Canadian manufacturing.” Industrial and Corporate Change 15 (3): 417–465.
Baldwin, J.R., and W. Gu. 2011. “Firm dynamics and productivity growth: A comparison of the retail trade and manufacturing sectors.” Industrial and Corporate Change 20 (2): 367–395.
Baldwin, J.R., W. Gu, and B. Yan. 2013. “Export growth, capacity utilization and productivity growth: Evidence for Canadian manufacturing plants.” Review of Income and Wealth 59: 665–688.
Bartelsman, E., and Z. Wolf. 2017. Measuring Productivity Dispersion. Tinbergen Institute Discussion Paper, no. 2017-033. Amsterdam, Netherlands: Tinbergen Institute.
Cao, S., M. Salameh, M. Seki, and P. St-Amant. 2017. “Trends in firm entry and new entrepreneurship in Canada.” Canadian Public Policy 43 (3): 202–220.
Cette, G., S. Corde, and R. Lecat. 2017. “Stagnation of productivity in France: A legacy of the crisis or a structural slowdown?” Économie et Statistique / Economics and Statistics 494-495-496: 11–36.
Decker, R.A., J. Haltiwanger, R.S. Jarmin, and J. Miranda. 2016. Declining Business Dynamism: Implications for Productivity? Hutchins Center Working Paper, no. 23. Washington, D.C.: Brookings Institution.
Foster, L., C. Grim, and J. Haltiwanger. 2016. “Reallocation in the Great Recession: Cleansing or not?” Journal of Labour Economics 34 (S1): 293–331.
Foster, L., C. Grim, J. Haltiwanger, and Z. Wolf. 2016. “Firm-level dispersion in productivity: Is the devil in the details?” American Economic Review 106 (5): 95–98.
Foster, L., J. Haltiwanger, and C.J. Krizan. 2001. “Aggregate productivity growth: Lessons from microeconomic evidence.” In New Developments in Productivity Analysis, ed. C.R. Hulten, E.R. Dean, and M.J. Harper, p. 307–372. Studies in Income and Wealth, no. 63. Chicago: University of Chicago Press.
Gordon, R.J. 2016. The Rise and Fall of American Growth: The U.S. Standard of Living Since the Civil War. Princeton and Oxford: Princeton University Press.
Gu, W. 2018. “Accounting for slower productivity growth in the Canadian business sector after 2000: The role of capital measurement issues.” International Productivity Monitor 34 (Spring): 21–39.
Gu, W., and A. Lafrance. 2014. Productivity Growth in the Canadian Broadcasting and Telecommunications Industry: Evidence from Micro Data. Economic Analysis Research Paper Series, no. 89. Statistics Canada Catalogue no. 11F0027M. Ottawa: Statistics Canada.
Gu, W., and M. Willox. 2018. “Productivity growth in Canada and the United States: Recent trends and potential explanations.” International Productivity Monitor 35 (Fall): 73–94.
Gu, W., B. Yan, and S. Ratté. 2018. Long-run Productivity Dispersion in Canadian Manufacturing. Economic Insights, no. 84. Statistics Canada Catalogue no. 11-626-X. Ottawa: Statistics Canada.
Haldane, A.G. 2017. “Productivity puzzles.” London School of Economics. Speech.
Ho, M.H., S. Rao, and J. Tang. 2004. “Sources of output growth in Canadian and U.S. industries in the information age.” In Economic Growth in Canada and the United States in the Information Age, ed. D.W. Jorgenson, chapter 4. Ottawa: Industry Canada.
Macdonald, R. 2014. Business Entry and Exit Rates in Canada: A 30-year Perspective. Economic Insights, no. 38. Statistics Canada Catalogue no. 11-626-X. Ottawa: Statistics Canada.
Manyika, J., J. Remes, J. Mischke, and M. Krishnan. 2017. The Productivity Puzzle: A Closer Look at the United States. Discussion Paper. New York: McKinsey Global Institute.
Meeusen, W., and J. van den Broeck. 1977. “Efficiency estimation from Cobb-Douglas production functions with composed error.” International Economic Review 18 (2): 435–444.
Murray, S. 2018. “What explains the post-2004 U.S. productivity slowdown?” International Productivity Monitor 34 (Spring): 81–109.
OECD (Organisation for Economic Co-operation and Development). 2015. The Future of Productivity. Paris, France: OECD Publishing.
OECD (Organisation for Economic Co-operation and Development). 2017. The Multiproduct Project: A Comprehensive Review. Manuscript.
Olley, G.S., and A. Pakes. 1996. “The dynamics of productivity in the telecommunications equipment industry.” Econometrica 64 (6): 1263–1297.
Rada, N., and C. Valdes. 2012. Policy, Technology, and Efficiency of Brazilian Agriculture. Economic Research Report, no. 137. U.S. Department of Agriculture.
Rao, S., and J. Li. 2013. “Explaining slower productivity growth: The role of weak demand growth.” International Productivity Monitor 26 (Fall): 3–13.
Sharpe, A., and W.K. Tsang. 2018. Stylized Facts About Slower Productivity Growth in Canada. Paper presented at Explaining Canada’s Post-2000 Productivity Performance, CSLS-Productivity Partnerships Workshop. Montréal, May 31 to June 2, 2018.
Statistics Canada. 2019. Table 36-10-0211-01 Multifactor productivity and related variables in the aggregate business sector and major sub-sectors, by industry. Last updated November 5, 2019. Available at: https://doi.org/10.25318/361002110-eng (accessed November 5, 2019).
Trefler, D. 2004. “The long and short of the Canada-US Free Trade Agreement.” American Economic Review 94 (4): 870–895.
Tukey, J.W. 1977. Exploratory Data Analysis. Reading, Massachusetts: Addison-Wesley Publishing Company.
- Date modified: