
Analytical Studies Branch Research Paper Series
Technological Frontiers and Post-2000 Productivity Growth in Canada
Acknowledgements
This is an abridged version of a longer research paper by the same authors. The authors would like to thank Christopher O’Donnell, Giuseppe Nicoletti, Danny Leung, Larry Shute and Pierre Therrien for their insightful comments and suggestions. The opinions expressed in this paper are those of the authors alone and do not represent—in any way—the views of Innovation, Science and Economic Development Canada, Statistics Canada, or the Government of Canada.
Abstract
To better understand the movements in productivity during the post-2000 period in Canada, this paper applies the stochastic frontier framework to decompose each firm’s multifactor productivity into two parts: its technological frontier and its technical efficiency. Change in the aggregate technological frontier refers to improvements in the productivity potential of the economy, or the maximum productivity of the economy if all firms are fully efficient. Aggregate technical efficiency reflects the economy’s capacity to achieve that potential. Given that the drivers of these two sources of productivity growth are different, the decomposition sheds light on the factors that can account for changes in productivity. The empirical results show that changes in productivity since 2000 were mainly attributable to changes in the technological frontier. While an association is found between investments in research and development (R&D) and changes in the technological frontier, R&D accounts for only a small fraction of the change in the technological frontier over time.
Keywords: productivity slowdown, stochastic frontier, productivity frontier, technical efficiency
Executive summary
Multifactor productivity (MFP) declined in Canada from 2000 to 2009 and then recovered after. The movements in productivity since 2000 have attracted great attention from researchers and policy makers because productivity is important both for economic growth and for improvements in living standards.
This paper applies the stochastic frontier framework to decompose each firm’s MFP into two parts: its technological frontier and its technical efficiency. Change in the aggregate technological frontier refers to improvements in the productivity potential of an economy, i.e., the maximum productivity of an economy if all firms are fully efficient. Aggregate technical efficiency reflects the economy’s capacity to achieve that potential. The results of this decomposition can show whether the movements in productivity after 2000 in Canada were mainly the result of changes in the technological frontier and productivity potential or of changes in the technical efficiency.
This study uses the National Accounts Longitudinal Microdata File, which is a rich analytical dataset derived from various administrative sources. It contains major variables that are considered to be important for productivity analysis, including measures of gross output, labour input, physical capital (including information and communications technology capital), intangible capital (including research and development [R&D] and organizational capital), capacity utilization and intermediate inputs.
The results show that changes in productivity in Canada since 2000 were mainly attributable to changes in the technological frontier, and these changes cannot be largely explained by the factors most commonly associated with enabling greater productivity potential (e.g., investments in R&D).
To better understand changes in the technological frontier, the firms were divided into three groups: firms with higher-than-average MFP levels from 2000 to 2002, firms with lower-than-average MFP levels from 2000 to 2002 and firms that entered after 2002. Empirical results show that the overall movements of the technological frontier were mainly associated with the firms in the 2000-to-2002 cohort with high MFP levels.
1 Introduction
Multifactor productivity (MFP) in Canada started to decline in 2002, and the decline continued until 2009, with some recovery afterwards (Chart 1). This decline is not unique to Canada: it is widespread across many member countries of the Organisation for Economic Co-operation and Development, including other G7 economies. The productivity growth slowdown was dramatic and has attracted great attention from researchers and policy makers, as it has important implications for economic growth and prosperity.
However, despite extensive research, the causes of the productivity slowdown are still subject to debate (Murray 2017). Various arguments and counterarguments on both supply and demand sides have been put forward. On the supply side, Gordon (2012) argues that the productivity growth deceleration is the result of a slowdown in important innovation and diminishing returns from the innovation process. Consistent with Gordon’s view is the suggestion that the decline is attributable to a waning of the productivity boom related to information and communications technology (ICT), which took place in the second half of the 1990s (e.g., Remes et al. 2018). However, Gordon’s pessimistic view has been challenged (Sichel 2016). Byrne, Oliner and Sichel (2015) provided evidence that ICT-related technological progress has continued at a rapid pace since 2000. According to Syverson (2013), there has been no evidence that ICT-related productivity improvements have been exhausted.
Similar to the supply-side debate, the debate from the demand side has also gained significant traction. It has been asserted that weak aggregate demand, great uncertainty and financial market disruption because of the financial crisis, which led to the underutilization of production capacity and lower investments in productivity-enhancing activities (e.g., ICT and research and development [R&D]), could lead to a reduction in productivity (e.g., Remes et al. 2018). However, Fernald (2014) indicates that it is not likely that the post-2000 productivity slowdown was driven by demand, given that the decline started several years before the financial crisis. Some researchers even suggest that reverse causality might actually be at play, i.e., the expectation of lower future productivity and economic growth might cause weak demand (Blanchard, Lorenzoni and L’Huillier 2017).
Productivity is commonly measured as the Solow residual. It measures technological progress, but also reflects measurement errors in both output and inputs and captures any unmeasured factors that are important to productivity. As such, some commentators suggest that mismeasurement associated with the digital economy might play a role in the productivity slowdown. It has been suggested that current output estimates do not fully capture the services provided through ICT and other related technologies. However, subsequent research has shown that the measurement issue was not as important of a factor (e.g., Byrne, Fernald and Reinsdorf 2016; Ahmad and Schreyer 2016; Syverson 2016; Gu 2018).

Data table for Chart 1
| Multifactor productivity | |
|---|---|
| index (2000=100) | |
| 1990 | 92.92 |
| 1991 | 90.38 |
| 1992 | 91.04 |
| 1993 | 92.01 |
| 1994 | 94.44 |
| 1995 | 94.76 |
| 1996 | 93.81 |
| 1997 | 95.03 |
| 1998 | 95.60 |
| 1999 | 97.85 |
| 2000 | 100.00 |
| 2001 | 99.92 |
| 2002 | 100.97 |
| 2003 | 100.22 |
| 2004 | 99.86 |
| 2005 | 99.87 |
| 2006 | 99.06 |
| 2007 | 97.95 |
| 2008 | 95.70 |
| 2009 | 93.25 |
| 2010 | 94.92 |
| 2011 | 96.34 |
| 2012 | 95.77 |
| 2013 | 96.42 |
| 2014 | 97.81 |
| 2015 | 96.83 |
| 2016 | 96.91 |
| Source: Statistics Canada, table 36-10-0208-01. | |
There has been no strong empirical evidence of what caused the slowdown in productivity growth after 2000. This paper continues to search for answers. The National Accounts Longitudinal Microdata File (NALMF)—a rich analytical dataset derived from various administrative sources—was used to systematically study the causes of the productivity slowdown in Canada. Major factors that are considered to be the most important for productivity were considered simultaneously, including firm age; foreign ownership; industry structure; capacity utilization; and investments in R&D, ICT and intangibles.
Unlike most of the literature that focuses on actual productivity directly and implicitly assumes that all firms are efficient, this paper applies the stochastic frontier production framework to decompose productivity into the components of technological change and technical efficiency. Technological change measures productivity potential (or the maximum level of productivity under full efficiency), while technical efficiency reflects the ability and capacity to achieve that potential. Variations in efficiency could arise because of variations in capacity utilization over the business cycle or because of differences in managerial practices across firms that are influenced by incomplete markets; asymmetric information; different management incentive payment systems; and different cultural beliefs, traditions and expectations. In addition, they may be the result of firm-level differences in investments in efficiency-enhancing technologies, such as ICT.
Importantly, this decomposition facilitated an analysis to help better understand the determinants of actual productivity. The factors that affect the technological frontier are different from those that influence technical efficiency. This separation makes it possible to link factors directly to one of the two components.
The rest of this paper is organized as follows: Section 2 describes the stochastic frontier model, the factors that are important for technological change and technical efficiency, and the data. Empirical results and implications are discussed in Section 3. Section 4 examines trends in the technological frontier of high- and low-productivity firms in the 2000-to-2002 cohort and in that of firms that entered after 2002. Section 5 concludes.
2 Methodology and data
This paper decomposes actual productivity into technological change and technical efficiency based on the stochastic frontier model that was pioneered by Aigner, Lovell and Schmidt (1977).Note Technological change refers to improvements in the productivity potential of the economy, i.e., the maximum productivity of the economy if all firms are fully efficient. In the stochastic frontier framework, this maximum productivity is called the technological frontier. The technological frontier is mainly driven by internal technological or innovative capacity, which feeds on a firm’s own past and current investments in R&D (Aghion and Howitt 1992). Therefore, after external factors are controlled for, the technological frontier of a firm reflects its past and current internal R&D. Some other variables may also have an impact on the technological frontier of a firm—the first being foreign ownership. Generally, foreign-controlled firms in Canada are significantly more productive than Canadian-controlled firms after other factors are controlled for. The foreign ownership productivity advantage is real and significant in Canada. It is generally believed that this advantage arises because foreign-controlled firms in Canada have access to the advanced technologies and superior management practices of their parent firms (Rao, Souare and Wang 2009; Tang and Rao 2003). The second factor is industry–year dummies. Industry–year dummies are introduced to control for all time-variant and time-invariant industry-specific effects. For example, they capture industry-specific demand shocks, spillover effects (such as those from external R&D) and effects from changes in the business environment, including competition and business dynamism (e.g., entry and exit).
Technical efficiency reflects the economy’s ability to be at the technological frontier. Technical efficiency has to be maintained or enhanced through the adoption of technology and investments in firm-specific human, knowledge and business organizational capital. Technical efficiency can also be affected by changes in the utilization rate of inputs when demand conditions fluctuate. In this paper, technology adoption was measured by investments in ICT, including software. The adoption of ICT allows firms to more efficiently organize their inputs, manage their inventories and conduct international business activities (Biagi 2013).
Investments in skills and better management practices are represented by investments in intangible, firm-specific human, knowledge and business organizational capital. Intangible capital enables efficient business execution (e.g., Battisti, Belloc and Del Gatto 2012). Corrado, Hulten and Sichel (2009) showed that these intangibles played a significant role in economic growth in the United States. Likewise, Baldwin, Gu and Macdonald (2012) obtained similar results for Canada. Furthermore, Ilmakunnas and Piekkola (2014) also linked investments in intangibles to higher productivity performance in Finland.
Firm-specific skills and organizational capital may also be improved through learning by doing, especially for young firms or start-ups. Therefore, a dummy variable is used to reflect the potential efficiency deficit facing young firms. Young firms are generally believed to be less efficient than established firms, as it takes time for young firms to learn their markets, establish supplier and distribution networks, and develop scale. According to Liu and Tang (2017), entrants take about five years to become as productive as incumbents.
Capacity utilization is used to capture the influence of changes in demand conditions on technical efficiency. An unexpected change in demand conditions affects the utilization of production capacity as firms are unable to adjust installed machines or even their workforce to suit the new demand. For example, a significantly lower demand than expected will lead to the underutilization of production capacity, which means that workers may not work to their full capacity and machines may sit idle more often than before. This leads to inefficiency. Basu and Kimball (1997) showed that changes in capacity utilization could explain up to 60% of short-run economic fluctuation. Baldwin, Gu and Yan (2013) showed that the Canadian manufacturing sector experienced excess capacity after 2000, with a decline in capacity utilization in 16 of the 20 manufacturing industries. This suggests that the development of excess capacity was mainly attributable to the large decline in exports as a result of the change in the trade environment during that period.
The stochastic frontier regression model can be written as
where is a vector of variables controlling for the effects of external factors on the technological frontier, is a random error term reflecting the stochastic nature of the technological frontier, is a measure of technical inefficiency or the distance to the production possibility frontier,Note and is a vector of the covariates that may affect technical efficiency.
The data used in this paper come from the NALMF. The data cover all industries from 2000 to 2014. The NALMF’s source data come from tax files (T2 Corporation Income Tax Return, T4 Statement of Remuneration Paid and PD7 Payroll Account Deductions); the Business Register; and the Survey of Employment, Payrolls and Hours. The T2 Corporation Income Tax Return form can be used to derive a firm’s gross output, physical capital stock and intermediate inputs, as well as its ICT capital stock, R&D investment and spending on intangibles. R&D capital stock and intangible capital stock are then derived using the perpetual inventory method. The other source data provide payroll and employment information, foreign ownership indicators, and the year a firm was founded.
Nominal variables need to be deflated for over-time comparisons. Because of the lack of deflators at the firm level, detailed industry-level deflators from the KLEMS database were used.Note The deflator for R&D is the implicit price index for R&D investments derived from Statistics Canada table 36-10-0098-01.Note
Tangible capital stock includes assets associated with machinery, equipment and buildings. It includes ICT stock, but excludes intangible assets and R&D stocks. The R&D stock for each firm is estimated from real R&D investments using the perpetual inventory method, assuming a capital depreciation rate of 15%. R&D expenditures were derived from the Scientific Research and Experimental Development Program data included in the T2 Corporation Income Tax Return. Following Corrado, Hulten and Sichel (2005, 2009), spending on intangible assets consists of non-scientific innovative properties (architect fees) and economic competencies that include organizational capital (20% of director and management salaries plus consulting fees), brand equity (60% of advertising) and firm-specific human capital (training). These six items were obtained directly from the General Index of Financial Information included in the T2 Corporation Income Tax Return. Nominal intangible spending was deflated using an industry-level implicit price deflator for intermediate inputs (from KLEMS). The perpetual inventory method was used for estimating intangible capital stock from real intangible spending, assuming a 15% depreciation rate. Total capital stock equals the sum of all tangible, intangible and R&D capital stocks.
A dummy variable was introduced to determine whether young firms were more or less efficient than established ones. According to Liu and Tang (2017), entrants in Canada take about five years to become as efficient as incumbents. Therefore, the dummy variable equalled 1 if a firm was less than six years old and equalled 0 otherwise. Lastly, capital use intensity was calculated with adjustment for the input substitution effectNote as an indicator of capacity utilization.
For the estimation, the sample was restricted to include only firms with an average of 10 or more employees over the sample period. The average number of employees per firm was used instead of the number of employees in each year to avoid truncated observations for the firms in the sample. The restricted sample represents 88% and 83% of gross output and employment in Canada, respectively. With this restriction, there were nearly 1.9 million observations for the entire sample period (Table 1).
| NAICS industry | 2000 | 2005 | 2009 | 2014 | 2000 to 2014 |
|---|---|---|---|---|---|
| number of observations | |||||
| Crop and animal production | 738 | 727 | 716 | 572 | 10,772 |
| Forestry and logging | 730 | 714 | 625 | 492 | 9,715 |
| Fishing, hunting and trapping | 61 | 77 | 77 | 68 | 1,096 |
| Support activities for agriculture and forestry | 358 | 423 | 426 | 406 | 6,148 |
| Oil and gas extraction | 204 | 226 | 216 | 178 | 3,139 |
| Mining and quarrying (except oil and gas) | 304 | 285 | 279 | 266 | 4,257 |
| Support activities for mining, and oil and gas extraction | 688 | 786 | 853 | 736 | 11,425 |
| Utilities | 147 | 219 | 186 | 182 | 2,840 |
| Construction | 11,625 | 12,986 | 13,608 | 13,968 | 197,518 |
| Food manufacturing | 2,139 | 2,084 | 1,959 | 1,856 | 30,174 |
| Beverage and tobacco manufacturing | 162 | 148 | 145 | 177 | 2,304 |
| Textile and textile product mills | 583 | 505 | 377 | 314 | 6,653 |
| Clothing, leather and allied product manufacturing | 1,217 | 947 | 624 | 411 | 12,071 |
| Wood product manufacturing | 1,586 | 1,571 | 1,443 | 1,251 | 22,150 |
| Paper manufacturing | 448 | 395 | 324 | 262 | 5,351 |
| Printing and related support activities | 1,180 | 1,135 | 1,011 | 837 | 15,693 |
| Petroleum and coal product manufacturing | 81 | 80 | 51 | 40 | 935 |
| Chemical manufacturing | 789 | 734 | 685 | 645 | 10,725 |
| Plastics and rubber products manufacturing | 1,202 | 1,176 | 1,074 | 1,026 | 16,783 |
| Non-metallic mineral product manufacturing | 716 | 741 | 676 | 616 | 10,409 |
| Primary metal manufacturing | 322 | 318 | 304 | 265 | 4,553 |
| Fabricated metal product manufacturing | 3,116 | 3,148 | 2,951 | 2,762 | 45,426 |
| Machinery manufacturing | 1,979 | 2,004 | 1,884 | 1,750 | 28,777 |
| Computer and electronic product manufacturing | 869 | 802 | 745 | 616 | 11,476 |
| Electrical equipment, appliance and component manufacturing | 461 | 459 | 425 | 385 | 6,561 |
| Transportation equipment manufacturing | 930 | 904 | 835 | 721 | 12,704 |
| Furniture and related product manufacturing | 1,334 | 1,384 | 1,261 | 1,100 | 19,418 |
| Miscellaneous manufacturing | 1,022 | 1,117 | 1,033 | 965 | 15,706 |
| Wholesale trade | 12,094 | 11,856 | 11,441 | 10,555 | 173,753 |
| Retail trade | 18,902 | 20,072 | 19,845 | 18,968 | 294,953 |
| Transportation and warehousing | 5,625 | 5,791 | 5,546 | 5,406 | 84,463 |
| Information and cultural industries | 1,963 | 1,954 | 1,891 | 1,952 | 29,269 |
| Finance, insurance, real estate and company management | 7,206 | 7,257 | 7,323 | 6,777 | 107,248 |
| Professional, scientific and technical services | 7,475 | 8,227 | 8,215 | 7,592 | 120,297 |
| Administrative and support, waste management and remediation services | 5,440 | 6,528 | 7,021 | 6,982 | 99,274 |
| Arts, entertainment and recreation | 2,400 | 2,879 | 2,920 | 2,844 | 42,100 |
| Accommodation and food services | 17,559 | 20,062 | 21,386 | 22,742 | 310,793 |
| Other services (except public administration) | 5,360 | 6,789 | 7,752 | 8,053 | 106,460 |
| All industries | 119,015 | 127,510 | 128,133 | 124,738 | 1,893,389 |
|
Note: NAICS: North American Industry Classification System. Source: Statistics Canada, authors' compilation based on data from the National Accounts Longitudinal Microdata File. |
|||||
There are two reasons why small firms were excluded. First, the derivation of the major variables necessary for productivity analysis involves the use of fields in the source data that are not mandatory. For smaller firms with less economic activity, these data fields are often left blank. The second reason is technical—it is time consuming to use all firms for the estimation, as there were more than 9 million observations before the exclusion.Note
Despite this exclusion, the estimates of aggregate MFP based on the sample used for the estimation of (1) track the movements of the official estimates of MFP for the business sector closely (Chart 2). The sample-based MFP measure aggregated firm-level MFP using Domar weights. These Domar weights were calculated as the ratio of a firm’s nominal gross output over the business sector’s nominal value added. The MFP at the firm level was calculated as a residual of gross output minus contributions from labour, capital and intermediate inputs. The output elasticities with respect to all inputs were obtained using ordinary least squares (OLS), controlling for industry–year dummies.Note

Data table for Chart 2
| Sample estimates | Official estimates | |
|---|---|---|
| index (2000=100) | ||
| 2000 | 100.00 | 100.00 |
| 2001 | 103.91 | 99.92 |
| 2002 | 104.21 | 100.97 |
| 2003 | 96.26 | 100.22 |
| 2004 | 97.54 | 99.86 |
| 2005 | 97.79 | 99.87 |
| 2006 | 94.45 | 99.06 |
| 2007 | 93.91 | 97.95 |
| 2008 | 92.54 | 95.70 |
| 2009 | 89.27 | 93.25 |
| 2010 | 93.82 | 94.92 |
| 2011 | 92.97 | 96.34 |
| 2012 | 97.04 | 95.77 |
| 2013 | 100.56 | 96.42 |
| 2014 | 102.07 | 97.81 |
| Sources: Statistics Canada, table 36-10-0208-01 for the official estimates and authors’ compilation based on data from the National Accounts Longitudinal Microdata File for the sample estimates. | ||
The movements of the two series were generally consistent. The series based on the sample used for estimation was more volatile than the official one—both the decline after 2002 and the recovery after 2009 were more dramatic. The difference may be attributable to a number of factors. First, the elasticity of output with respect to inputs used in calculating MFP for the sample used in the estimation was regression-based and fixed over the estimation period, while that for the official estimates was based on growth accounting and was time varying. Second, small firms were excluded from the sample. Third, the MFP calculation for the sample used in the estimation did not adjust for capital quality and labour composition, while the official MFP estimates did. Lastly, the MFP calculation for the sample used in the estimation was Domar-aggregated at the firm level. The official estimates were Domar-aggregated from industry-level data. These industry-level data came from a greater number of data sources than are used in the NALMF.
3 Estimation results
The stochastic frontier estimation results are reported in Table 2. The first regression is for the whole sample period and for all firms with 10 or more employees. For the technological frontier, the results show that R&D investments and foreign ownership are important for raising productivity potential. For inefficiency, all variables were found to be negative and highly significant, meaning that firms with more investments in ICT and intangibles, as well as young firms, tend to be closer to their technological frontiers.Note Furthermore, as expected, capacity utilization is positively associated with technical efficiency.
Interestingly, the estimated coefficients of all variables based on the stochastic frontier model (regression [1]) in Table 2) were similar to the results of some traditional regressions.Note Implicitly, the similarity is a robustness check of the results from the stochastic frontier estimation.Note
Regressions (2) and (3) in Table 2 are for the sub-periods from 2009 to 2014 and from 2000 to 2009, respectively. The purpose was to determine whether the effect of any of those factors changed significantly over these two sub-periods. Overall, there were no significant changes for R&D, foreign ownership, ICT and intangibles. However, the efficiency advantage of young firms over established firms was greater after the financial crisis. This is an interesting result, and may be because only high-efficiency and productive firms can enter the market after the financial crisis.
Regressions (4) and (5) are for manufacturing and non-manufacturing firms, respectively. These two sets of results are generally similar. However, the impact of R&D and foreign ownership on manufacturing firms was smaller than on non-manufacturing firms. The same is true for the effect of ICT on technical efficiency. In addition, the efficiency advantage of young firms was larger in manufacturing than in non-manufacturing.
Given the general consistency across all columns in Table 2, the discussion and analysis to follow will be based on the estimation results in Column 1 of Table 2.
| Regression 1 | Regression 2 | Regression 3 | Regression 4 | Regression 5 | |
|---|---|---|---|---|---|
| All firms 2000 to 2014 |
All firms 2009 to 2014 |
All firms 2000 to 2009 |
Manufacturing firms 2000 to 2014 |
Non-manufacturing firms 2000 to 2014 |
|
| Technological frontier | |||||
| Labour (in log) | |||||
| Coefficient | 0.2780Note ** | 0.2921Note ** | 0.2699Note ** | 0.2367Note ** | 0.2821Note ** |
| Standard error | 0.0003 | 0.0005 | 0.0004 | 0.0007 | 0.0003 |
| Tangible capital (in log) | |||||
| Coefficient | 0.0647Note ** | 0.0623Note ** | 0.0664Note ** | 0.0716Note ** | 0.0643Note ** |
| Standard error | 0.0002 | 0.0003 | 0.0002 | 0.0005 | 0.0002 |
| Intermediate inputs (in log) | |||||
| Coefficient | 0.6455Note ** | 0.6361Note ** | 0.6500Note ** | 0.6814Note ** | 0.6410Note ** |
| Standard error | 0.0002 | 0.0004 | 0.0003 | 0.0005 | 0.0003 |
| R&D stock (in log) | |||||
| Coefficient | 0.0049Note ** | 0.0044Note ** | 0.0053Note ** | 0.0013Note ** | 0.0068Note ** |
| Standard error | 0.0001 | 0.0001 | 0.0001 | 0.0001 | 0.0001 |
| Foreign-owned | |||||
| Coefficient | 0.2025Note ** | 0.2140Note ** | 0.1960Note ** | 0.1106Note ** | 0.2279Note ** |
| Standard error | 0.0015 | 0.0021 | 0.0020 | 0.0021 | 0.0018 |
| Industry dummy variables | Yes | Yes | Yes | Yes | Yes |
| Year dummy variables | Yes | Yes | Yes | Yes | Yes |
| Year by industry dummy variables | Yes | Yes | Yes | Yes | Yes |
| Inefficiency | |||||
| Ratio of ICT to total capital stock | |||||
| Coefficient | -0.2600Note ** | -0.2564Note ** | -0.2635Note ** | -0.1418Note ** | -0.2663Note ** |
| Standard error | 0.0018 | 0.0030 | 0.0022 | 0.0064 | 0.0019 |
| Ratio of intangibles to total capital stock | |||||
| Coefficient | -0.2242Note ** | -0.2279Note ** | -0.2235Note ** | -0.1974Note ** | -0.2271Note ** |
| Standard error | 0.0013 | 0.0021 | 0.0016 | 0.0033 | 0.0014 |
| Young firms | |||||
| Coefficient | -0.0087Note ** | -0.0183Note ** | -0.0039Note ** | -0.0291Note ** | -0.0056Note ** |
| Standard error | 0.0006 | 0.0011 | 0.0007 | 0.0013 | 0.0007 |
| Capacity utilization | |||||
| Coefficient | -0.0408Note ** | -0.0450Note ** | -0.0385Note ** | -0.0413Note ** | -0.0410Note ** |
| Standard error | 0.0004 | 0.0008 | 0.0005 | 0.0008 | 0.0005 |
| Constant | Yes | Yes | Yes | Yes | Yes |
| Number of observations | 1,893,389 | 764,016 | 1,257,506 | 277,869 | 1,615,520 |
Source: Statistics Canada, authors' compilation based on data from the National Accounts Longitudinal Microdata File. |
|||||
Elasticities of technological change or technical efficiency with respect to each factor were estimated to determine their sensitivity to control factors. The estimated elasticities are reported in Table 3. The results show that doubling R&D—for example—would lead to a 0.5% increase in the technological frontier. Furthermore, foreign-owned firms are—on average—20.3% more productive than a domestic firm. For technical efficiency, if the ratio of ICT to total capital and the ratio of intangibles to total capital are doubled, efficiency would increase by 1.8% and 2.7%, respectively. In addition, young firms have a 0.9% efficiency advantage over established firms, and a 10% increase in capacity utilization would increase efficiency by 0.4%. Given these elasticities, even when all firms doubled their R&D, ICT and intangible capital stock over the period from 2002 to 2009, the drop in MFP over the period can be reduced by 5 percentage points only, leaving a large portion of the decline unexplained.
| Factor | Elasticity |
|---|---|
| coefficient | |
| Technological change with respect to its factors | |
| Research and development | 0.0049 |
| Foreign-controlled | 0.2025 |
| Technical efficiency with respect to its factors | |
| Ratio of information and communications technology to total capital | 0.0181 |
| Ratio of intangibles to total capital | 0.0272 |
| Young firm | 0.8698 |
| Capacity utilization | 0.0408 |
| Source: Statistics Canada, authors' compilation based on data from the National Accounts Longitudinal Microdata File. | |
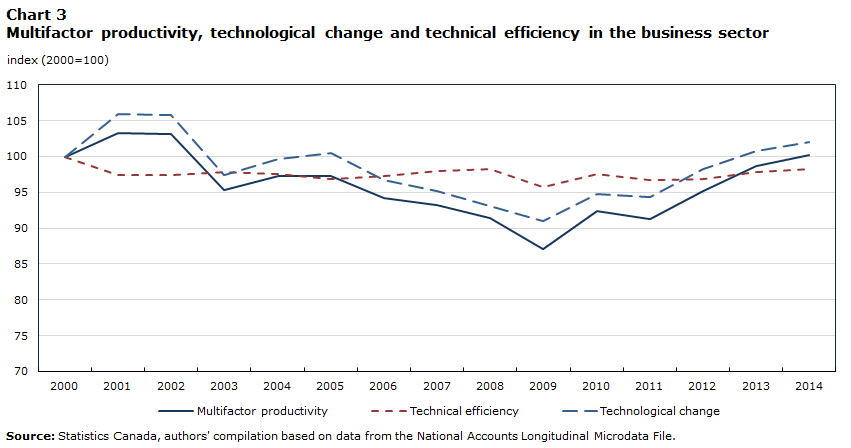
Changes in MFP, technological frontier and technical efficiency at the firm level were aggregated using Domar weights. The indexes of the business-sector MFP, technological frontier and technical efficiency are depicted in Chart 3, which shows that the movement of MFP was largely driven by the movement of the technological frontier, while technical efficiency was relatively stable over the whole period.
Data table for Chart 3
| Multifactor productivity | Technical efficiency | Technological change | |
|---|---|---|---|
| index (2000=100) | |||
| 2000 | 100.00 | 100.00 | 100.00 |
| 2001 | 103.29 | 97.45 | 105.99 |
| 2002 | 103.10 | 97.42 | 105.83 |
| 2003 | 95.37 | 97.83 | 97.49 |
| 2004 | 97.27 | 97.58 | 99.69 |
| 2005 | 97.32 | 96.88 | 100.46 |
| 2006 | 94.15 | 97.27 | 96.79 |
| 2007 | 93.22 | 97.97 | 95.15 |
| 2008 | 91.39 | 98.22 | 93.04 |
| 2009 | 87.11 | 95.78 | 90.95 |
| 2010 | 92.43 | 97.56 | 94.75 |
| 2011 | 91.32 | 96.74 | 94.39 |
| 2012 | 95.16 | 96.86 | 98.24 |
| 2013 | 98.66 | 97.87 | 100.81 |
| 2014 | 100.18 | 98.25 | 101.96 |
| Source: Statistics Canada, authors' compilation based on data from the National Accounts Longitudinal Microdata File. | |||
4 The movement of high-productivity and low-productivity cohorts
To shed more light on the productivity slowdown, firms in the 2000-to-2002 cohort were divided into two groups.Note The high-productivity group consisted of firms with MFP levels higher than the corresponding industry averages over the period from 2000 to 2002, and all of the remaining firms in the cohort were in the low-productivity group. All firms that appeared after 2002 were considered new entrants.
Chart 4 shows the trends in the technological frontiers of the three groups of firms. The technological frontier increased across the entire sample for the low-productivity cohort, but declined for the other two groups until 2009, implying that the retreat of the technological frontier was driven by the high-productivity cohort and the new entrants. As shown in Table 4, the aggregate technological frontier dropped by 7.0% from 2003 to 2009. The contributions of the high-productivity cohort, the low-productivity cohort and the new entrants were -8.4, 4.9 and -3.5 percentage points, respectively. The technological frontier fully recovered after 2009, and the corresponding contributions were 7.0, 4.2 and 0.7 percentage points. These results suggest that the retreat of the technological frontier was mainly driven by the high-productivity firms in the 2000-to-2002 cohort.
| 2003 to 2009 | 2009 to 2014 | |
|---|---|---|
| percent | ||
| Change in technological frontier | -7.0 | 11.9 |
| percentage points | ||
| Contribution | ||
| High-productivity cohort | -8.4 | 7.0 |
| Low-productivity cohort | 4.9 | 4.2 |
| Entrants after 2002 | -3.5 | 0.7 |
| Source: Statistics Canada, authors’ compilation based on data from the National Accounts Longitudinal Microdata File. | ||

Data table for Chart 4
| High-productivity cohorts | Low-productivity cohorts | New entrants | |
|---|---|---|---|
| index (2003=100) | |||
| 2000 | 108.54 | 95.44 | Note ...: not applicable |
| 2001 | 116.64 | 99.34 | Note ...: not applicable |
| 2002 | 115.65 | 100.11 | Note ...: not applicable |
| 2003 | 100.00 | 100.00 | 100.00 |
| 2004 | 99.87 | 105.76 | 91.93 |
| 2005 | 99.15 | 109.78 | 84.55 |
| 2006 | 92.23 | 111.93 | 76.17 |
| 2007 | 94.33 | 107.19 | 69.07 |
| 2008 | 92.98 | 104.54 | 66.01 |
| 2009 | 83.73 | 113.35 | 64.35 |
| 2010 | 90.80 | 114.61 | 64.51 |
| 2011 | 88.18 | 115.52 | 66.58 |
| 2012 | 95.47 | 117.30 | 66.55 |
| 2013 | 98.67 | 119.97 | 67.50 |
| 2014 | 97.50 | 126.61 | 66.56 |
|
... not applicable Note: New entrants entering the business sector in 2003. Source: Statistics Canada, authors' compilation based on data from the National Accounts Longitudinal Microdata File. |
|||
5 Conclusion
By decomposing actual productivity into technological frontier (or technology-related productivity potential) and technical efficiency, the empirical results of this study show that the decline in Canada’s productivity from 2000 to 2009 and the subsequent recovery were largely associated with changes in the technological frontier.
This paper shows that (1) R&D investments and foreign-controlled firms in particular played important roles in supporting the technological frontier, while industrial structure played a minor negative role; (2) ICT and intangibles played a positive role in supporting technical efficiency.
In addition, this study demonstrates that movements in productivity in Canada after 2000 were largely associated with the high-productivity firms in the 2000-to-2002 cohort. This evidence is consistent with the findings in the literature for the Canadian manufacturing sector. The post-2000 productivity decline in the Canadian manufacturing sector was mainly the result of a decline in the productivity of large firms (Tang 2017) or exporters (Baldwin, Gu and Yan 2013). However, Baldwin, Gu and Yan (2013) also claimed that at least half of the productivity decline was attributable to the pro-cyclical nature of productivity growth arising from capacity utilization, but this was not the case in this paper. A future study of the causes of the weak productivity performance of large and exporting firms may shed more light on the productivity slowdown in Canada.
It is important to note that technological frontier and frontier firm are different concepts. The former is associated with each firm’s technological potential, while the latter refers to high-productivity firms and is often used to examine the productivity dispersion between frontier and non-frontier firms.Note Gu, Yan and Ratté (2018) found that the relative labour productivity level of frontier-to-non-frontier firms in Canadian manufacturing decreased from 2000 to 2005 and increased thereafter, implying that the aggregate productivity growth was mainly driven by frontier firms. This is generally consistent with the findings in this paper.
References
Aghion, P., and P. Howitt. 1992. “A model of growth through creative destruction.” Econometrica 60 (2): 323–351.
Ahmad, N., and P. Schreyer. 2016. “Are GDP and productivity measures up to the challenges of the digital economy?” International Productivity Monitor 30: 4–27.
Aigner, D.J., C.A.K. Lovell, and P. Schmidt. 1977. “Formulation and estimation of stochastic frontier production function models.” Journal of Econometrics 6 (1): 21–37.
Andrews, D., C. Criscuolo, and P.N. Gal. 2015. Frontier Firms, Technology Diffusion and Public Policy: Micro Evidence from OECD Countries. OECD Productivity Working Papers, no. 2. OECD Publishing.
Baldwin, J.R., W. Gu, and R. Macdonald. 2012. Intangible Capital and Productivity Growth in Canada. The Canadian Productivity Review, no. 29. Statistics Canada Catalogue no. 15-206-X. Ottawa: Statistics Canada.
Baldwin, J.R., W. Gu, and B. Yan. 2007. User Guide for Statistics Canada’s Annual Multifactor Productivity Program. The Canadian Productivity Review, no. 14. Statistics Canada Catalogue no. 15-206-X. Ottawa: Statistics Canada.
Baldwin, J.R., W. Gu, and B. Yan. 2013. Export Growth, Capacity Utilization and Productivity Growth: Evidence from Canadian Manufacturing Plants. Economic Analysis Research Paper Series, no. 75. Statistics Canada Catalogue no. 11F0027M. Ottawa: Statistics Canada.
Basu, S., and M.S. Kimball. 1997. Cyclical Productivity with Unobserved Input Variation. NBER Working Paper Series, no. 5915. Cambridge, Massachusetts: National Bureau of Economic Research.
Battese, G.E., and T.J. Coelli. 1995. “A model for technical inefficiency effects in a stochastic frontier production function for panel data.” Empirical Economics 20 (2): 325–332.
Battisti, M., F. Belloc, and M. Del Gatto. 2012. “Unbundling technology adoption and TFP at the firm level: Do intangibles matter?” Journal of Economics & Management Strategy 24 (2): 390–414.
Biagi, F. 2013. ICT and Productivity: A Review of the Literature. Institute for Prospective Technological Studies Digital Economy Working Paper 2013/09. Joint Research Centre of the European Commission.
Blanchard, O., G. Lorenzoni, and J.-P. L’Huillier. 2017. Short-run Effects of Lower Productivity Growth: A Twist on the Secular Stagnation Hypothesis. Peterson Institute for International Economics Policy Brief PB17-6. Washington, D.C.: Peterson Institute for International Economics Policy.
Byrne, D.M., J.G. Fernald, and M.B. Reinsdorf. 2016. “Does the United States have a productivity slowdown or a measurement problem?” Brookings Papers on Economic Activity 2016 (1): 109–182.
Byrne, D., S.D. Oliner, and D.E. Sichel. 2015. How Fast Are Semiconductor Prices Falling? NBER Working Paper Series, no. 21074. Cambridge, Massachusetts: National Bureau of Economic Research. (accessed October 15, 2019).
Corrado, C., C. Hulten, and D. Sichel. 2005. “Measuring capital and technology: An expanded framework.” In Measuring Capital in the New Economy, ed. C. Corrado, J. Haltiwanger, and D. Sichel, p. 11–46. Chicago: University of Chicago Press.
Corrado, C., C. Hulten, and D. Sichel. 2009. “Intangible capital and U.S. economic growth.” Review of Income and Wealth 55 (3): 661–685.
Fernald, J. 2014. A Quarterly, Utilization-adjusted Series on Total Factor Productivity. Federal Reserve Bank of San Francisco Working Paper Series, no. 2012-19.
Gordon, R.J. 2012. Is U.S. Economic Growth Over? Faltering Innovation Confronts the Six Headwinds. NBER Working Paper Series, no. 18315. Cambridge, Massachusetts: National Bureau of Economic Research.
Gu, W. 2018. Accounting for Slower Productivity Growth in the Canadian Business Sector After 2000: Do Measurement Issues Matter? Analytical Studies Branch Research Paper Series, no. 409. Statistics Canada Catalogue no. 11F0019M. Ottawa: Statistics Canada.
Gu, W., B. Yan, and S. Ratté. 2018. Long-run Productivity Dispersion in Canadian Manufacturing. Economic Insights, no. 84. Statistics Canada Catalogue no. 11-626-X. Ottawa: Statistics Canada.
Ilmakunnas, P., and H. Piekkola. 2014. “Intangible investment in people and productivity.” Journal of Productivity Analysis 41 (3): 443–456.
Kumbhakar, S.C., S. Ghosh, and J.T. McGuckin. 1991. “A generalized production frontier approach for estimating determinants of inefficiency in U.S. dairy farms.” Journal of Business & Economic Statistics 9 (3): 279–286.
Kumbhakar, S.C., and C.A.K. Lovell. 2000. Stochastic Frontier Analysis. Cambridge: Cambridge University Press.
Levinsohn, J., and A. Petrin. 2003. “Estimating production functions using inputs to control for unobservables.” Review of Economic Studies 70 (2): 317–341.
Liu, H., and J. Tang. 2017. “Age-productivity profiles of entrants and exits: Evidence from Canadian manufacturing.” Structural Change and Economic Dynamics 40: 26–36.
Murray, A. 2017. What Explains the Post-2004 U.S. Productivity Slowdown? Centre for the Study of Living Standards Research Report 2017-05. (accessed October 15, 2019).
Rao, S., M. Souare, and W. Wang. 2009. “The economics of FDI: A Canadian perspective.” Transnational Corporations Review 1 (4): 28–41.
Reifschneider, D., and R. Stevenson. 1991. “Systematic departures from the frontier: A framework for the analysis of firm inefficiency.” International Economic Review 32 (3): 715–723.
Remes, J., J. Manyika, J. Bughin, J. Woetzel, J. Mischke, and M. Krishnan. 2018. Solving the Productivity Puzzle: The Role of Demand and the Promise of Digitization. McKinsey Global Institute. (accessed on September 11, 2018).
Sichel, D. 2016. “Two books for the price of one: Review article of The Rise and Fall of American Growth by Robert J. Gordon.” International Productivity Monitor 31: 57–62.
Syverson, C. 2013. “Will history repeat itself? Comments on ‘Is the information technology revolution over?’” International Productivity Monitor 25: 37–40.
Syverson, C. 2016. Challenges to Mismeasurement Explanations for the U.S. Productivity Slowdown. Booth School of Business working paper. Chicago: University of Chicago. (accessed October 15, 2019).
Tang, J. 2014. “Are small or large producers driving the Canada-U.S. labour productivity gap? Recent evidence from manufacturing.” Canadian Journal of Economics 47 (2): 517–539.
Tang, J. 2017. “Industrial structure change and the widening Canada–U.S. labor productivity gap in the post-2000 period.” Industrial and Corporate Change 26 (2): 259–278
Tang, J., and S. Rao. 2003. “Are foreign-controlled manufacturing firms less R&D-intensive than Canadian-controlled firms?” Canadian Public Policy 29 (1): 111–117.
Tang, J., and A. Van Assche. 2017. “Multinationals and offshoring: Firm-level evidence from Canada.” Canadian Public Policy 43 (S2): S1–S14.
- Date modified: