
Analytical Studies Branch Research Paper Series
The Long-term Economic Outcomes of Refugee Private Sponsorship

Archived Content
Information identified as archived is provided for reference, research or recordkeeping purposes. It is not subject to the Government of Canada Web Standards and has not been altered or updated since it was archived. Please "contact us" to request a format other than those available.
Abstract
An important policy initiative implemented for the past 40 years in Canada, refugee private sponsorship has attracted international attention as Europe continues to grapple with an influx of refugees. However, no research has systematically evaluated the long-term economic outcomes of private sponsorship and whether such outcomes vary by refugees’ human capital. This study compared the economic outcomes of privately sponsored refugees (PSRs) and government-assisted refugees (GARs) using the Longitudinal Immigration Database, an administrative database that contains information on virtually all immigrants and refugees who have arrived in Canada since 1980. The results show that PSRs had higher employment rates and earnings than GARs, particularly during the initial settlement period, even after taking into account differences in education, official language ability, and other observed socio-demographic characteristics, although the differences diminished over time. The PSR advantage was particularly noticeable among less-educated refugees.
Keywords: refugees, private sponsorship, employment, earnings
Executive summary
Canada was the first country to introduce private sponsorship, and the program has played a key role in the country’s responses to international refugee crises over the last four decades. Private sponsorship has been regarded as a promising policy option for other major Western countries in their commitments to refugee resettlement.
However, empirical evidence regarding the economic outcomes of refugee private sponsorship is notably limited. To fill this gap, this paper examined the long-term economic outcomes of privately sponsored refugees (PSRs) with various human capital levels in Canada. It addressed two questions. First, how do the economic outcomes of PSRs compare with those of government-assisted refugees (GARs) in the initial resettlement period and over the longer term? Second, do the economic outcomes of PSRs vary by the refugees’ initial levels of human capital (official language skills and education)?
Based on the Longitudinal Immigration Database, this study found that PSRs and GARs differed in some key socio-demographic characteristics. Over the 1980-to-2009 period, more PSRs came from Eastern Europe than GARs, whereas more GARs came from South and Central America and the Caribbean than PSRs. PSRs had a higher level of education and were more concentrated in Toronto than GARs. This study takes into account of these observed differences in comparing their labour market outcomes, while recognizing that other possible unmeasured differences between the two groups of refugees, such as exposure to violence, duration of displacement, physical and mental health, and ethnic and family networks could impact their economic outcomes.
PSRs had higher employment rates and earnings than GARs in the initial years after arrival, even after taking into account differences in education, official language ability, and other observed socio-demographic characteristics, but these differences diminished over time with GARs steadily catching up. The study further found that the employment and earnings advantage of PSRs over GARs was greater among refugees with less than a high school education than among refugees with higher educational levels. The majority of refugees (51% and 61% for men and women in the study sample, respectively) had less than a high school education.
The study showed that refugees with poor official language skills benefited from private sponsorship as much as refugees with good official language skills. This is likely related to the fact that refugees with poor official language skills can take government-financed language training, regardless of whether they are in private sponsorship or government assistance programs.
1 Introduction
Timely economic integration of refugees has become a pressing policy issue for Western democracies as refugees have arrived at their national borders from the Middle East, West Asia, and Africa in large numbers in recent years. For most receiving countries, refugees are admitted for humanitarian rather than economic reasons. As a result, many refugees are not equipped with postsecondary education or host-country language skills, and they face greater challenges in economic and social integration than other immigrants (Beiser 2003; McKeary and Newbold 2010; Simich, Este and Hamilton 2010).
One refugee integration policy that has attracted international attention is Canada’s private sponsorship program, which played a key role in the country’s responses to international refugee flows, including Southeast Asian “boat people” from 1979 to 1981 and Syrian refugees more recently. Created in 1978, Canada’s private sponsorship program is a privately funded refugee program (Treviranus and Casasola 2003). Private sponsors—such as churches, other faith groups, ethnic organizations and groups of individuals—take in refugee applicants of their choice or refugees approved by visa officers. Sponsors are responsible for providing financial, material and personal support to refugees during their first year in Canada or until they become self-sufficient, whichever comes first. Although private sponsorship is one of the two main refugee admission and integration programs—the other being government assistance—empirical evidence regarding the economic outcomes of privately sponsored refugees (PSRs) is notably limited (Beirens and Ahad 2018; Kumin 2015). Moreover, little is known about whether the economic outcomes of private sponsorship differ by refugees’ initial levels of human capital.
To fill this gap, this paper evaluated the economic outcomes of PSRs with various levels of human capital. Two research questions were addressed. First, how do the economic outcomes of PSRs compare with those of government-assisted refugees (GARs) in the initial resettlement period and over the longer term? Second, do the economic outcomes of PSRs relative to GARs vary by initial levels of human capital (i.e., official language skills and education)? These questions were answered using the Longitudinal Immigration Database (IMDB)—an administrative database that contains the landing and annual tax records of immigrants and refugees who arrived in Canada from 1980 onward.
This paper makes three research contributions. First, by using multivariate analysis, the economic outcomes of PSRs were compared with those of GARs while controlling for differences in observed demographic, socioeconomic and contextual characteristics. This provides a more robust assessment of the differences between these groups than previous research, much of which used simple descriptive techniques.
Second, this study provides new evidence on the interaction effects between refugee admission categories (PSR versus GAR) and refugee human capital upon arrival in Canada. This interaction effect considers the fact that refugees are a heterogeneous population with varying degrees of educational attainment and host-country language skills at their time of arrival.
Third, this study provides empirical evidence on the long-term economic outcomes of PSRs. These results are relevant to refugee integration policies not only for Canada, but also for Western nations that are responding to refugee inflows.
2 The economic integration of refugees and private sponsorship
It is widely acknowledged that refugees tend to do less well in the host country’s labour market than those who immigrated through other streams (e.g., economic immigrants) (Constant and Zimmermann 2005; Bevelander 2016). While some of the factors that contribute to the refugees’ poorer labour market outcomes also apply to other immigrants (e.g., limited host-country language skills, lack of host-country work experience, non-recognition of foreign credentials), other factors are specific to refugees—such as physical and mental health issues related to traumatic experiences, a lack of legal documents, and long-term disruption of education and careers (Bruno 2011; Hynie, Korn and Tao 2016; Krahn et al. 2000; Neupane 2012; van Selm 2003).
In Canada, the main findings about refugee economic integration were threefold. First, refugees’ economic outcomes during the initial settlement period were generally comparable with those of family-class immigrants, but were less favourable than those of economic immigrants (Aydemir 2011; Bevelander and Pendakur 2014; Hiebert 2009; Hyndman, Payne and Jimenez 2017; Wilkinson and Garcea 2017; Yu and Dempsey 2004). Second, despite their initial disadvantage, refugees narrowed the gap vis-à-vis other immigrants over subsequent years. Abbot and Beach (2011) reported that refugees achieved increases of 7% to 12% annually in median earnings over their first 10 years in Canada—a rate of increase that was higher than that of all other immigrant entry groups. That said, refugees’ initial disadvantage was so large that it would take them 12 to 18 years to reach the median earnings of all immigrants. Third, the employment outcomes documented among refugees varied considerably depending on the metrics and groups (i.e., men or women) being compared (Hiebert 2009; Picot, Zhang and Hou 2019; Wilkinson and Garcea 2017).
Economic outcomes may differ between Canada’s two main refugee resettlement programs, PSRs and GARs. Although refugee private sponsorship had been ongoing for many years, the Immigration Act formally ushered in Canada’s private sponsorship program in 1978 (Macklin et al. 2018). The private sponsorship program increased the number of refugees that could be admitted to Canada, offsetting government budgetary constraints by harnessing the private resources of citizens and groups. It allowed Canadians to become involved in the resettlement process by volunteering their financial and emotional support (Lenard 2016). Qualifications for sponsors are restricted to organizations, sponsorship agreement holders, or groups of five or more people—particularly religious groups (Labman 2016). The private sponsorship program has been a vital component of Canada’s refugee policy and has resettled over 225,000 refugees since 1979 (Labman 2016).
GARs and PSRs hold the same legal status: they are granted permanent resident status upon arrival and are eligible for the government support available to other permanent residents. Moreover, the motivation and pre-migration circumstances of GARs and PSRs are similar; they are often forced out of their home country because of war, political persecution or violence, and are seeking protection and a safe place to rebuild their lives in Canada.
However, PSRs and GARs also differ in many ways. GARs tend to settle in smaller cities and often have lower education and limited official language skills than PSRs (Jedwab 2018). Differences in pre-migration circumstances (e.g., experience in refugee camps, length of dislocation), selection processes (e.g., measurement of “vulnerability” in selecting GARs), and local receptivity (e.g., welcoming community) may partially account for the divergent trajectories of economic integration between the two refugee groups. In particular, because of local sponsor support, PSRs may be received more favourably in their host community compared with GARs. Even though the sponsor’s initial support ends one year after arrival, some refugees may maintain ties with sponsors (Aylesworth and Ossorio 1983; Neuwirth and Clark 1981). In addition, some ethnic communities may selectively sponsor co-ethnic refugees, and the sponsored refugees may take advantage of the pre-existing ethnic networks and receive culturally sensitive resettlement support (Portes and Rumbaut 2001). These favourable environments may help PSRs find jobs and achieve economic independence quickly.
Although limited in scope, existing empirical evidence on the economic integration of PSRs suggests that they achieve “slightly quicker self-sufficiency” than GARs; they find employment more quickly and garner higher earnings during their first 10 years in Canada (Picot, Zhang and Hou 2019; Wilkinson and Garcea 2017). PSR employment rates are higher, especially during the initial settlement stage. An analysis of refugees who were admitted to Canada between 2002 and 2012 showed that 70% of PSRs were employed one year after landing, compared with only 40% of GARs (IRCC 2016). However, by the 10th year in Canada, the employment rates of PSRs and GARs had almost converged.
Other studies show that PSRs have higher earnings or incomes than GARs during their initial years in Canada (Beiser 2003; Bevelander and Pendakur 2014; DeVoretz, Pivnenko and Beiser 2004; Mata and Pendakur 2017; Sweetman and Warman 2013; Yu and Dempsey 2004). However, findings about whether this advantage persists in the longer term are mixed. In her analysis of refugees who arrived in 1991, Dhital (2015) found that female and male PSRs had annual median earnings that were $5,000 and $12,000 higher than their respective GAR counterparts 10 years after landing, with a PSR advantage observed even up to 18 years after arrival. By contrast, Immigration, Refugees and Citizenship Canada’s IMDB analysis found that the gaps in employment earnings between the PSRs and GARs who arrived between 2002 and 2012 diminished after the 10-year mark (IRCC 2016).
Despite such positive evidence and Canada’s international reputation for community-based refugee resettlement, to date there has been no systematic evaluation using rigorous statistical techniques of the long-term economic outcomes of private sponsorship (Fratzke 2017; Treviranus and Casasola 2003). Most of the existing assessments did not fully consider the differences in human capital and other demographic and contextual characteristics between PSRs and GARs (Jedwab 2018). One exception was the study by Picot, Zhang and Hou (2019) that compared earnings of refugees by admission program up to 15 years after immigration, although it did not examine employment rates. Meanwhile, studies on PSRs have been done mostly on a smaller scale and have focused on specific ethnic or country-of-origin groups who settled in certain cities, or on the private sponsorship program itself (Beiser 2003; Denton 2003; Hyndman, Payne and Jimenez 2017; Labman 2016; Lenard 2016; Neuwirth and Clark 1981; Treviranus and Casasola 2003; Woon 1987). As a result, little is known about whether the results observed from a specific refugee group that arrived in a specific historical context can be generalized to other refugee groups, or whether PSRs’ initial advantage over GARs can be attributed solely to their landing characteristics (e.g., human capital, country of origin, place of settlement) or to other factors, such as settlement programs themselves.
To address these gaps, the IMDB was used to examine the employment and earnings of PSRs and GARs who landed in Canada between 1980 and 2009. Using multivariate analysis, the analysis adjusted for the differences in characteristics at landing and post-migration between GARs and PSRs. PSRs were expected to have better labour market outcomes than GARs, especially in the initial resettlement period, given the sponsors’ legal responsibility to provide financial and social support to the PSRs in the first 12 months. After the end of the sponsorship commitment, such differences were expected to diminish over time. However, studies have shown that many refugees maintain contact or friendship with their sponsors, which may help their long-term economic integration (Beiser 2003; Woon 1987). Therefore, the first hypothesis was as follows:
Hypothesis 1: PSRs are more likely to be employed and to earn more than GARs both over the short term (less than 5 years) and over the longer term (15 years) when their demographic, socioeconomic and contextual characteristics are taken into account.
This study also considered the possibility of interaction effects of refugees’ admission categories and human capital, given that refugees are a socioeconomically diverse group (IRCC 2016; Jedwab 2018). Refugees with high human capital (e.g., highly educated, proficient in English or French) may be more self-sufficient and could achieve economic success without much sponsor support (Nakhaie 2018). By contrast, refugees with limited human capital may benefit more from private sponsorship since sponsor support could compensate for their human capital deficit. Thus, the second and third hypotheses were as follows:
Hypothesis 2: The employment and earnings advantage of private sponsorship over government assistance is greater for less-educated refugees (e.g., less than high school) than for highly educated refugees (e.g., bachelor’s degree or above).
Hypothesis 3: The employment and earnings advantage of PSRs over GARs is greater among refugees with limited host-country language skills than those with higher host-country language skills.
3 Data and methods
3.1 Data
The data were drawn from the IMDB, which contains landing records and annual tax records of immigrants, including refugees, who arrived in Canada from 1980 onward and filed taxes at least once (Hou and Bonikowska 2016). Those who filed taxes at least once since 1982 are included in the database.
The sample consists of individuals who landed in Canada as PSRs or GARs at ages 20 to 54 between 1980 and 2009. Other refugee categories (e.g., in-Canada asylum seekers, refugee dependants, blended visa office-referred [BVOR] refugees) are not included in the analysis because of small population sizes (e.g., refugee dependants, BVOR refugees) and stark differences in characteristics compared with PSRs that would make the comparison difficult. Moreover, PSRs and GARs from the United States, Northern and Western Europe, Australia and New Zealand, and stateless individuals were dropped from the analysis because of their small sample sizes.
3.2 Measures
Two dependent variables were used to measure refugee economic integration: employment (the presence of positive annual employment incomes) and employment earnings among those with positive annual earnings in a specific year since landing. The presence of positive annual employment income is a proxy of employment status. Employment is an indicator of self-sufficiency and is a critical factor in shaping other aspects of refugee integration, such as finding housing, expanding social networks, improving host-country language skills, improving mental health and gaining a greater sense of belonging (Beiser 2003; Hynie, Korn and Tao 2016). The employment variable is coded “1” if a refugee reports a positive annual employment income for a specific tax year, and “0” otherwise.Note
Employment income (including wages and salaries) reflects the combined effect of hourly wages and total hours of work in a particular year (Hou and Bonikowska 2016). Better-paying employment may allow refugees to participate more fully in the host society (Hynie, Korn and Tao 2016). This is a continuous variable (adjusted to the 2015 value using the Consumer Price Index), but it is top coded at $300,000 to keep the higher income values from skewing the distribution. For multivariate analysis, logged-earnings values were used.
Refugee admission categories were central in the analysis and were categorized as PSRs and GARs (the reference group). In addition, years since landing (YSL) was also a key factor. In this study, the first two years were coded as dummy variables, and the third year and onward were coded as a continuous variable. This was because the differences in labour market outcomes between PSRs and GARs were likely the largest in the first year—the period when sponsors were formally committed to providing financial and social support. The effect of that direct support may linger in the second year. Descriptive statistics (Charts 1 and 2) confirmed that the employment and earnings differences between PSRs and GARs were notably large in the first year, dropped drastically in the second year and remained stable or gradually decreased afterward. Treating the YSL variable as a linear (and quadratic) term did not adequately reflect the observed employment and earnings trajectories of refugees. This was confirmed in an F-test between a model where the YSL was treated as a continuous variable from year 1 onward and Model 1 (see next section), which controlled for refugee class, year 1 and year 2 dummies, a linear YSL term (for year 3 and onward), and its quadratic term.
The regression models controlled for demographic and socioeconomic characteristics at the time of landing that were expected to influence subsequent economic outcomes: the highest level of education obtained before landing, knowledge of official languages, age at landing, region of origin, and entry cohort.
The models further controlled for three time-varying variables: place of residence, unemployment rates (for men aged 25 to 64) in the refugee’s province of residence in a specific tax year, and the number of months in school during a specific year as a full-time student. The values of these variables could vary in each year.
3.3 Analytical technique
Ordinary least squares (OLS) regression models were used to examine whether the differences in economic outcomes of PSRs and GARs persisted after controlling for the duration of residence in Canada. To test Hypothesis 1 (the assessment of the advantage of private sponsorship over time), the following model was estimated:
Model 1:
Y signifies the dependent variable, employment or earnings. YSL indicates years since landing (including year 1 and 2 dummies, and a linear term for year 3 and onward).
The TYPEj variable represents the refugee admission category, and HC refers to the human capital variables (highest level of education and knowledge of official languages). One of the control variables, period of landing in Canada (COHORT), interacted with years since landing, considering that refugees’ economic outcomes may vary by entry cohort (Picot, Zhang and Hou 2019). This is a common approach in regression models that predict immigrants’ economic outcomes.
X represents other individual-level control variables (e.g., age at landing, region of origin, place of residence), and Uy represents the time-varying variables of regional unemployment, number of months in full-time schooling and place of residence.
To test Hypotheses 2 and 3 (evaluating the advantages of private sponsorship by different levels of human capital), three-way interactions among refugee admission categories, YSL, and the highest level of education (for Hypothesis 2) and among refugee admission categories, YSL, and the knowledge of official languages (for Hypothesis 3) were added to the regression model.
Model 2:
All the models were run separately for female and male refugees. Also, cluster-robust standard errors were estimated to consider the clustering of data at the province (for the unemployment rate variable) and year (for refugee person-year data) levels. The person-year data contained 3,345,239 cases (men) and 2,468,735 cases (women) for the employment analysis. The comparable numbers for the earnings analysis were 2,676,928 and 1,608,467 for men and women, respectively.
4 Results
4.1 A first look
To begin, Chart 1 shows the incidence of employment for male and female PSRs and GARs across years since landing. PSR employment rates in the first year after landing were high, at 90% and 71% among men and women, respectively. These incidences were 17 and 24 percentage points higher than those among male and female GARs. These were the largest differences observed over the refugees’ first 15 years in Canada.
After their first year in Canada, PSR employment rates dropped in the next two years. Male PSRs’ employment rates remained around 85% over the next 13 years, whereas female PSRs’ employment rates first dropped to 66%, then rose and stabilized at around 70%. The decrease in the employment rate after the first year was the opposite of the general pattern among immigrants whose employment rates tend to increase during the initial settlement period (Chui and Tran 2005). This decrease may reflect several possibilities: some jobs they found with the sponsor’s help were short term and disappeared when the sponsor’s formal commitment ended; some PSRs might take jobs that they did not like if the sponsor made them self-sufficient as quickly as possible.
Over time in Canada, the gap in employment rates between female GARs and PSRs narrowed. Among men, the gap decreased to around 5 percentage points by the 10th year and 3 percentage points by the 15th year after arrival. Overall, PSRs had a higher employment rate than GARs over many years.

Data table for Chart 1
| Entry class | Years since landing | ||||||||||||||
|---|---|---|---|---|---|---|---|---|---|---|---|---|---|---|---|
| percent | |||||||||||||||
| 1 | 2 | 3 | 4 | 5 | 6 | 7 | 8 | 9 | 10 | 11 | 12 | 13 | 14 | 15 | |
| Male GAR | 73.2 | 78.7 | 80.3 | 80.8 | 80.7 | 80.7 | 80.7 | 80.6 | 80.5 | 80.3 | 80.2 | 79.8 | 79.7 | 80.1 | 80.2 |
| Male PSR | 90.4 | 85.9 | 84.8 | 84.8 | 84.5 | 84.9 | 85.4 | 85.6 | 85.6 | 85.3 | 84.5 | 84.3 | 83.9 | 83.8 | 83.6 |
| Female GAR | 47.7 | 54.7 | 57.9 | 59.9 | 61.0 | 61.5 | 62.3 | 63.2 | 63.9 | 64.8 | 65.3 | 66.4 | 67.0 | 68.1 | 68.7 |
| Female PSR | 71.3 | 67.6 | 66.4 | 66.2 | 66.1 | 66.7 | 67.5 | 68.2 | 68.9 | 69.4 | 69.5 | 69.9 | 69.9 | 70.1 | 70.6 |
|
Note: GAR: government-assisted refugee; PSR: privately sponsored refugee. Source: Statistics Canada, Longitudinal Immigration Database, 1980 to 2015. |
|||||||||||||||
Data table for Chart 2
| Entry class | Years since landing | ||||||||||||||
|---|---|---|---|---|---|---|---|---|---|---|---|---|---|---|---|
| dollars | |||||||||||||||
| 1 | 2 | 3 | 4 | 5 | 6 | 7 | 8 | 9 | 10 | 11 | 12 | 13 | 14 | 15 | |
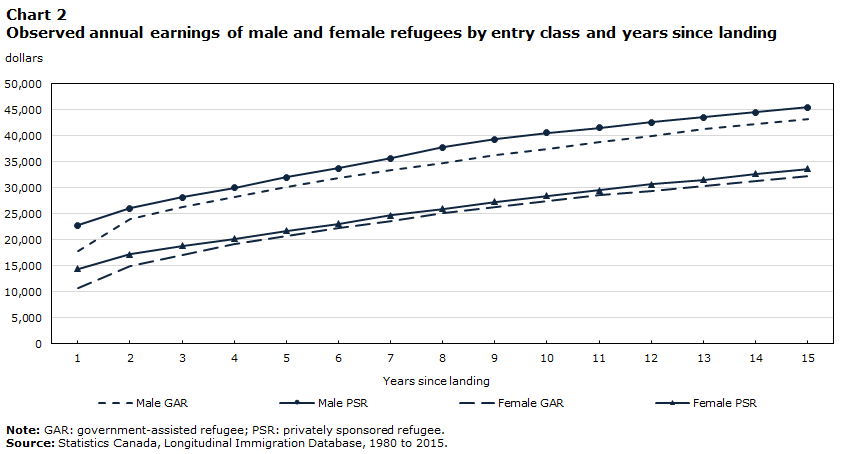
| Male GAR | 17,800 | 23,900 | 26,300 | 28,300 | 30,100 | 31,800 | 33,400 | 34,800 | 36,300 | 37,400 | 38,800 | 39,900 | 41,300 | 42,300 | 43,300 |
| Male PSR | 22,800 | 26,100 | 28,200 | 30,000 | 32,000 | 33,800 | 35,700 | 37,800 | 39,400 | 40,600 | 41,600 | 42,600 | 43,600 | 44,600 | 45,500 |
| Female GAR | 10,700 | 15,000 | 17,100 | 19,100 | 20,700 | 22,300 | 23,700 | 25,100 | 26,300 | 27,500 | 28,600 | 29,400 | 30,400 | 31,300 | 32,200 |
| Female PSR | 14,400 | 17,200 | 18,800 | 20,200 | 21,700 | 23,100 | 24,700 | 26,000 | 27,300 | 28,500 | 29,500 | 30,700 | 31,600 | 32,700 | 33,700 |
|
Note: GAR: government-assisted refugee; PSR: privately sponsored refugee. Source: Statistics Canada, Longitudinal Immigration Database, 1980 to 2015. |
|||||||||||||||
Observed earnings rose steadily for both PSRs and GARs each year (Chart 2). The PSR lead was again noticeable in the first year ($5,000 and $3,700 more than male and female GARs, respectively). The PSR earnings advantage narrowed after the second year, stabilizing at around $2,500 and $1,000 for men and women, respectively.
The above results did not consider the differences in the observed characteristics between PSRs and GARs. As Table 1 demonstrates, PSRs and GARs have some different characteristics. Refugees from Eastern Europe (especially Poland) were overrepresented among PSRs (43% and 39% of male and female PSRs, respectively), whereas the percentage of refugees from South and Central America and the Caribbean was notably higher among GARs (over 10%). Moreover, refugees with less than a high school education were overrepresented among GARs (53% and 65% for male and female GARs, respectively). Further, PSRs were concentrated particularly in the 1985-to-1994 cohorts (comprising 62% and 57% of all male and female PSRs), whereas the arrival periods of GARs were evenly distributed. Finally, 4 in 10 PSRs initially settled in Toronto, whereas comparable percentages of GARs lived in smaller metropolitan areas (e.g., Ottawa, Calgary). These group differences in demographic and socioeconomic characteristics may partially explain PSRs’ employment and earnings advantage over GARs. The next section examines whether the PSR advantage remained when these group differences were taken into account using multivariate analysis.
| Variables | Government-assisted refugees | Privately sponsored refugees | ||
|---|---|---|---|---|
| Men | Women | Men | Women | |
| percent | ||||
| World region | ||||
| South and Central America, Caribbean | 13.7 | 16.9 | 1.8 | 2.6 |
| Eastern Europe | 23.7 | 23.5 | 43.1 | 38.9 |
| Southern Europe | 6.1 | 8.2 | 1.7 | 2.3 |
| Africa | 14.9 | 13.5 | 15.0 | 13.9 |
| Middle East, West Central Asia | 17.2 | 16.8 | 15.0 | 17.5 |
| Southeast Asia | 22.5 | 19.7 | 22.1 | 23.8 |
| Other Asia | 1.9 | 1.4 | 1.2 | 1.1 |
| Highest level of education at landing | ||||
| Less than high school | 53.0 | 63.3 | 48.3 | 58.3 |
| High school diploma or trades certificate | 26.8 | 19.4 | 29.7 | 22.4 |
| Some postsecondary education | 6.8 | 7.0 | 8.6 | 8.2 |
| Bachelor's degree or above | 13.4 | 10.2 | 13.4 | 11.1 |
| Knowledge of official language | ||||
| English and/or French | 30.9 | 22.0 | 29.9 | 23.5 |
| Neither English nor French | 69.1 | 78.0 | 70.1 | 76.5 |
| Age at arrival | ||||
| 20 to 29 | 50.3 | 49.1 | 49.8 | 50.7 |
| 30 to 39 | 34.7 | 34.9 | 35.3 | 33.0 |
| 40 to 49 | 12.8 | 13.3 | 12.3 | 12.9 |
| 50 to 54 | 2.2 | 2.7 | 2.6 | 3.4 |
| Year of landing | ||||
| 1980 to 1984 | 23.2 | 19.9 | 16.1 | 17.2 |
| 1985 to 1989 | 28.3 | 22.8 | 29.1 | 26.3 |
| 1990 to 1994 | 15.6 | 15.3 | 33.1 | 30.5 |
| 1995 to 1999 | 12.9 | 14.6 | 5.9 | 7.3 |
| 2000 to 2004 | 11.2 | 14.3 | 7.1 | 8.6 |
| 2005 to 2009 | 8.8 | 12.9 | 8.7 | 10.1 |
| Place of residence at tax filing time, year 1 | ||||
| Montréal | 8.5 | 8.6 | 6.9 | 7.5 |
| Toronto | 26.6 | 24.0 | 41.2 | 39.1 |
| Vancouver | 9.7 | 10.3 | 6.4 | 6.7 |
| Second-tier metropolitan areas | 28.1 | 28.9 | 23.6 | 24.1 |
| Other small census metropolitan areas | 15.8 | 17.3 | 12.5 | 12.8 |
| Small urban or rural areas | 8.6 | 8.7 | 8.0 | 7.8 |
| No information on place of residence | 2.6 | 2.2 | 1.3 | 2.1 |
|
Notes: Because of rounding, the percentages may not add up to 100. The sample sizes were 98,360 and 69,952 for government-assisted refugee men and women, and 66,520 and 49,002 for privately sponsored refugee men and women. Source: Statistics Canada, Longitudinal Immigration Database, 1980 to 2015. |
||||
4.2 The short- and long-term economic outcomes of government-assisted refugees and privately sponsored refugees
OLS regression models were used to predict the probability of employment and earnings after adjusting for group differences in characteristics at the time of landing, including age at arrival, region of birth, period of landing, level of education and knowledge of official languages, as well as characteristics after arrival—including unemployment rates of the province of residence, the number of months in full-time schooling and the geographic location of residence in a specific year.
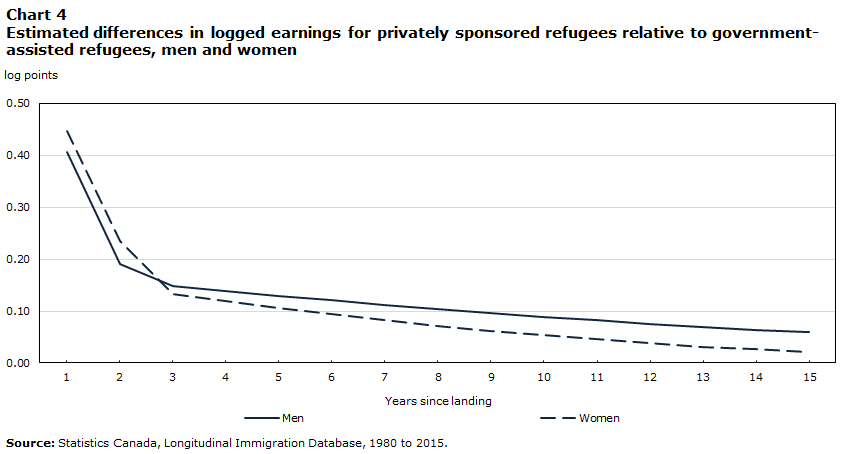
To make the regression results easy to interpret, the probabilities of employment and earnings were estimated for PSRs and GARs from years 1 to 15 when the control variable values were held constant (using the sample means for continuous variables and proportional distributions for categorical variables). Furthermore, the differences in the estimated outcome values (probability of employment and logged earnings) between PSRs and GARs were calculated. Charts 3 and 4 display these estimated differences for male and female employment and earnings results from years 1 to 15.
Chart 3 shows that PSRs’ employment advantage over GARs persisted over the long term among both male and female refugees. The PSR advantage was particularly sizeable in the first year, which was reflective of the fact that PSRs’ employment rates over the 15-year reference period were highest in year 1, while the employment rate among GARs was lowest in year 1.

Data table for Chart 3
| Years since landing | |||||||||||||||
|---|---|---|---|---|---|---|---|---|---|---|---|---|---|---|---|
| probability | |||||||||||||||
| 1 | 2 | 3 | 4 | 5 | 6 | 7 | 8 | 9 | 10 | 11 | 12 | 13 | 14 | 15 | |
| Men | 0.172 | 0.092 | 0.065 | 0.062 | 0.058 | 0.055 | 0.051 | 0.048 | 0.045 | 0.042 | 0.039 | 0.037 | 0.034 | 0.032 | 0.029 |
| Women | 0.236 | 0.150 | 0.107 | 0.098 | 0.089 | 0.080 | 0.072 | 0.064 | 0.056 | 0.049 | 0.043 | 0.037 | 0.031 | 0.026 | 0.021 |
| Source: Statistics Canada, Longitudinal Immigration Database, 1980 to 2015. | |||||||||||||||
However, PSRs’ employment advantage diminished over the first three years. By year 15, the PSR employment rates were only 2 to 3 percentage points higher than those of GARs, with this difference remaining statistically significant.
Similar patterns held for PSR estimated earnings in comparison with their GAR counterparts. As Chart 4 demonstrates, the earnings advantage of PSRs over GARs was substantial in the first year (over 0.40 log points for both women and men) and diminished markedly after that year. Nevertheless, PSRs continued to earn more than GARs up to their 15th year in Canada, earning 0.06 (or 6%) and 0.02 (or 2%) log points more among men and women, respectively.
Data table for Chart 4
| Years since landing | |||||||||||||||
|---|---|---|---|---|---|---|---|---|---|---|---|---|---|---|---|
| log points | |||||||||||||||
| 1 | 2 | 3 | 4 | 5 | 6 | 7 | 8 | 9 | 10 | 11 | 12 | 13 | 14 | 15 | |
| Men | 0.407 | 0.190 | 0.149 | 0.139 | 0.129 | 0.121 | 0.112 | 0.104 | 0.096 | 0.089 | 0.082 | 0.076 | 0.070 | 0.064 | 0.059 |
| Women | 0.448 | 0.236 | 0.133 | 0.119 | 0.106 | 0.094 | 0.082 | 0.072 | 0.062 | 0.053 | 0.045 | 0.038 | 0.032 | 0.026 | 0.021 |
| Source: Statistics Canada, Longitudinal Immigration Database, 1980 to 2015. | |||||||||||||||
The following analysis examined whether the economic advantage of private sponsorship varied by refugees’ initial human capital—measured by level of education and knowledge of official languages. The model added two-way interaction terms between refugee admission categories and human capital, and human capital and YSL. It also added three-way interaction terms among refugee admission categories, human capital and YSL. The results were reported using the graphs that show the estimated advantage (disadvantage) of PSRs over GARs by education levels (Charts 5 to 8), knowledge of official languages and YSL.
The results showed that male refugees with a lower level of education benefited more from private sponsorship than those with bachelor’s degrees or above. In the first year after landing, the estimated probability of employment of PSRs with less than a high school education was 19 percentage points higher than that of their GAR counterparts (Chart 5). Although this employment advantage of less-educated male PSRs shrank by half (8 percentage points) by year 3, their advantage remained statistically significant throughout the first 15 years. In year 15, their estimated probability of employment was still 3 percentage points higher than that of their GAR counterparts. By contrast, the employment advantage of PSRs was much smaller and lasted a shorter time for those with bachelor’s degrees or above. By the 12th year, their advantage was below 2 percentage points—virtually the same (estimated) employment probability as GARs. The results for refugee women were similar to men overall (women with less education benefited more from private sponsorship in employment), which supported Hypothesis 2 (Chart 6).

Data table for Chart 5
| Initital level of education | Years since landing | ||||||||||||||
|---|---|---|---|---|---|---|---|---|---|---|---|---|---|---|---|
| probability | |||||||||||||||
| 1 | 2 | 3 | 4 | 5 | 6 | 7 | 8 | 9 | 10 | 11 | 12 | 13 | 14 | 15 | |
| Less than high school | 0.189 | 0.102 | 0.075 | 0.071 | 0.068 | 0.064 | 0.060 | 0.056 | 0.053 | 0.049 | 0.046 | 0.042 | 0.039 | 0.036 | 0.032 |
| High school diploma or trades certificate | 0.150 | 0.079 | 0.054 | 0.052 | 0.049 | 0.047 | 0.044 | 0.042 | 0.040 | 0.038 | 0.036 | 0.034 | 0.033 | 0.031 | 0.029 |
| Some postsecondary education | 0.181 | 0.084 | 0.046 | 0.044 | 0.043 | 0.041 | 0.039 | 0.038 | 0.036 | 0.035 | 0.033 | 0.032 | 0.031 | 0.030 | 0.029 |
| Bachelor's degree or above | 0.179 | 0.091 | 0.059 | 0.053 | 0.048 | 0.043 | 0.038 | 0.033 | 0.029 | 0.025 | 0.022 | 0.019 | 0.016 | 0.014 | 0.012 |
| Source: Statistics Canada, Longitudinal Immigration Database, 1980 to 2015. | |||||||||||||||

Data table for Chart 6
| Initial level of education | Years since landing | ||||||||||||||
|---|---|---|---|---|---|---|---|---|---|---|---|---|---|---|---|
| probability | |||||||||||||||
| 1 | 2 | 3 | 4 | 5 | 6 | 7 | 8 | 9 | 10 | 11 | 12 | 13 | 14 | 15 | |
| Less than high school | 0.262 | 0.172 | 0.130 | 0.120 | 0.110 | 0.100 | 0.091 | 0.082 | 0.073 | 0.065 | 0.058 | 0.051 | 0.044 | 0.038 | 0.032 |
| High school diploma or trades certificate | 0.209 | 0.115 | 0.070 | 0.062 | 0.055 | 0.048 | 0.042 | 0.036 | 0.030 | 0.025 | 0.020 | 0.016 | 0.012 | 0.008 | 0.005 |
| Some postsecondary education | 0.209 | 0.117 | 0.070 | 0.062 | 0.054 | 0.047 | 0.041 | 0.035 | 0.029 | 0.024 | 0.019 | 0.015 | 0.011 | 0.008 | 0.005 |
| Bachelor's degree or above | 0.191 | 0.119 | 0.063 | 0.055 | 0.046 | 0.039 | 0.032 | 0.025 | 0.020 | 0.014 | 0.010 | 0.006 | 0.002 | -0.001 | -0.003 |
| Source: Statistics Canada, Longitudinal Immigration Database, 1980 to 2015. | |||||||||||||||
When the earnings of refugees with different levels of initial education were estimated, the overall results were the same as those for employment. PSRs without a high school education had the greatest advantage over their GAR counterparts throughout their first 15 years in Canada, and less-educated female PSRs’ relative advantage was far greater than their more-educated counterparts (Charts 7 and 8).
The effect of private sponsorship on refugee employment varied little by official language ability when the refugees’ demographic and socioeconomic characteristics at landing and post-migration characteristics were held constant (figures not shown). PSRs were more likely to be employed than GARs, and their employment advantage persisted in the long term (up to 15 years) whether or not they knew English or French at arrival. For male refugees, the advantages of PSRs for those with and without official language knowledge converged in year 3 and onward. For female refugees, those without knowledge of English or French had a slightly greater advantage over GARs than those who knew English or French at arrival (24- and 22-percentage-point advantage, respectively).
When the refugees’ earnings were estimated (figures not shown), men and women followed fairly similar patterns of PSR–GAR differences. For both female and male PSRs, their earnings advantage over their GAR counterparts was 0.1 log points greater than those who knew English or French at arrival. However, their advantage quickly diminished. In the longer-term resettlement, the PSRs with knowledge of English or French benefited more from private sponsorship in earnings.

Data table for Chart 7
| Initial level of education | Years since landing | ||||||||||||||
|---|---|---|---|---|---|---|---|---|---|---|---|---|---|---|---|
| log points | |||||||||||||||
| 1 | 2 | 3 | 4 | 5 | 6 | 7 | 8 | 9 | 10 | 11 | 12 | 13 | 14 | 15 | |
| Less than high school | 0.478 | 0.238 | 0.184 | 0.173 | 0.162 | 0.151 | 0.141 | 0.131 | 0.121 | 0.112 | 0.103 | 0.095 | 0.087 | 0.079 | 0.072 |
| High school diploma or trades certificate | 0.337 | 0.114 | 0.106 | 0.102 | 0.098 | 0.094 | 0.091 | 0.088 | 0.084 | 0.081 | 0.079 | 0.076 | 0.073 | 0.071 | 0.069 |
| Some postsecondary education | 0.411 | 0.162 | 0.123 | 0.113 | 0.104 | 0.096 | 0.088 | 0.081 | 0.074 | 0.067 | 0.062 | 0.057 | 0.052 | 0.048 | 0.044 |
| Bachelor's degree or above | 0.390 | 0.183 | 0.098 | 0.085 | 0.074 | 0.062 | 0.052 | 0.042 | 0.034 | 0.025 | 0.018 | 0.011 | 0.005 | 0.000 | -0.004 |
| Source: Statistics Canada, Longitudinal Immigration Database, 1980 to 2015. | |||||||||||||||

Data table for Chart 8
| Initial level of education | Years since landing | ||||||||||||||
|---|---|---|---|---|---|---|---|---|---|---|---|---|---|---|---|
| log points | |||||||||||||||
| 1 | 2 | 3 | 4 | 5 | 6 | 7 | 8 | 9 | 10 | 11 | 12 | 13 | 14 | 15 | |
| Less than high school | 0.530 | 0.293 | 0.192 | 0.176 | 0.160 | 0.146 | 0.132 | 0.118 | 0.106 | 0.094 | 0.082 | 0.072 | 0.062 | 0.053 | 0.044 |
| High school diploma or trades certificate | 0.350 | 0.166 | 0.069 | 0.056 | 0.044 | 0.033 | 0.023 | 0.014 | 0.006 | -0.001 | -0.007 | -0.012 | -0.015 | -0.018 | -0.020 |
| Some postsecondary education | 0.405 | 0.152 | 0.048 | 0.042 | 0.036 | 0.032 | 0.027 | 0.023 | 0.020 | 0.018 | 0.016 | 0.014 | 0.013 | 0.013 | 0.013 |
| Bachelor's degree or above | 0.391 | 0.130 | 0.022 | 0.015 | 0.009 | 0.004 | -0.001 | -0.005 | -0.008 | -0.010 | -0.012 | -0.013 | -0.013 | -0.012 | -0.011 |
| Source: Statistics Canada, Longitudinal Immigration Database, 1980 to 2015. | |||||||||||||||
5 Conclusion and discussion
This study compared the short- and long-term employment and earnings outcomes between privately sponsored refugees (PSRs) and government-assisted refugees (GARs) who were admitted to Canada between 1980 and 2009. Using the Longitudinal Immigration Database, this study estimated refugees’ employment rates and earnings up to 15 years after landing, while controlling for the group differences in demographic and socioeconomic characteristics at the time of landing, and some post-migration characteristics.
The multivariate analysis demonstrated that PSRs had higher employment rates and earnings than GARs even after taking into account differences in education, official language ability, and other observed socio-demographic characteristics. The differences were particularly large in the initial two years after arrival, and narrowed over time. The better labour market outcomes of PSRs may be related to other unmeasured pre-migration characteristics, selection processes, and host country reception factors. For example, unmeasured pre-migration characteristics (e.g., health, experience of refugee camps, duration of displacement) of refugees may be associated with the selection criteria of government-assisted refugee program (e.g., vulnerability), while welcoming reception may be reflective of the private sponsorship program which settles refugees in the community where sponsors are located (IRCC 2016; Oda et al. 2018).
This study also found that the employment and earnings advantage of private sponsorship compared with government assistance was greater among refugees with less education than among highly educated refugees. While this finding applies to both male and female refugees, the employment advantage of female PSRs without a high school education over their GAR counterparts was particularly high compared with more-educated female PSRs. Three to eight years after landing, more-educated PSR women had the same employment rates as their GAR counterparts. As such, only the less-educated women benefited from private sponsorship in the long term. Since the majority of refugees (51% and 61% for male and female refugees, respectively, in the study sample) had less than a high school education, this finding implies that private sponsorship arguably has long-lasting benefits for a large segment of this disadvantaged group, especially women.
Finally, the study found that refugees with poor official language skills benefited from private sponsorship as much as those with good official language skills. This was likely related to the fact that refugees with poor official language skills could take government-financed language training, regardless of whether they were in the private sponsorship or government-assistance programs (Kaida 2013). If anything, GARs were more likely to take full advantage of the free language training because they had guaranteed government financial support for their first year of resettlement and their employment rate was lower than that of PSRs.
References
Abbot, M.G., and C.M. Beach. 2011. Do Admission Criteria and Economic Recessions Affect Immigrant Earnings? IRPP Study no. 22. Montréal: Institute for Research on Public Policy.
Aydemir, A. 2011. “Immigrant selection and short-term labor market outcomes by visa category.” Journal of Population Economics 24 (2): 451–475.
Aylesworth, L.S., and P.G. Ossorio. 1983. “Refugees: Cultural displacement and its effects.” Advances in Descriptive Psychology 3: 45–93.
Beirens, H., and A. Ahad. 2018. Scaling up Refugee Resettlement in Europe: The Role of Institutional Peer Support. Brussels: Migration Policy Institute Europe.
Beiser, M. 2003. “Sponsorship and resettlement success.” Journal of International Migration and Integration 4 (2): 203–215.
Bevelander, P. 2016. “Integrating refugees into labor markets: Economic integration of refugees into their host country is important and benefits both parties.” IZA World of Labor, 269. Bonn: Institute for the Study of Labor (IZA).
Bevelander, P., and R. Pendakur. 2014. “The labour market integration of refugee and family reunion immigrants: A comparison of outcomes in Canada and Sweden.” Journal of Ethnic and Migration Studies 40 (5): 689–709.
Bruno, A. 2011. U.S. Refugee Resettlement Assistance. Congressional Research Service. Available at: https://fas.org/sgp/crs/row/R41570.pdf (accessed September 10, 2019).
Chui, T., and K. Tran. 2005. Longitudinal Survey of Immigrants to Canada: Progress and Challenges of New Immigrants in the Workforce, 2003. Statistics Canada Catalogue no. 89-615-X. Ottawa: Statistics Canada.
Constant, A., and K.F. Zimmermann. 2005. “Immigrant performance and selective immigration policy: A European perspective.” National Institute Economic Review 194 (1): 94–105.
Denton, T.R. 2003. “Understanding private refugee sponsorship in Manitoba.” Journal of International Migration and Integration 4 (2): 257–272.
DeVoretz, D., S. Pivnenko and M. Beiser. 2004. The Economic Experiences of Refugees in Canada. IZA Discussion Paper Series, no. 1088. Bonn: Institute for the Study of Labor (IZA).
Dhital, D. 2015. The Economic Outcomes of Government Assisted Refugees, Privately Sponsored Refugees and Asylum Seekers in Canada. Ottawa: University of Ottawa. Master’s thesis.
Fratzke, S. 2017. Engaging Communities in Refugee Protection: The Potential of Private Sponsorship in Europe. MPI Europe Policy Brief no. 9. Brussels: Migration Policy Institute Europe.
Hiebert, D. 2009. “The economic integration of immigrants in metropolitan Vancouver.” IRPP Choices 15 (7).
Hou, F., and A. Bonikowska. 2016. “Selections before the selection: Earnings advantages of immigrants who were former skilled temporary foreign workers in Canada.” International Migration Review. Available at: https://doi.org/10.1111/imre.12310.
Hyndman, J., W. Payne and S. Jimenez. 2017. The State of Private Refugee Sponsorship in Canada: Trends, Issues, and Impacts. Policy Brief. Toronto: Centre for Refugee Studies, Refugee Research Network.
Hynie, M., A. Korn and D. Tao. 2016. “Social context and integration for government assisted refugees in Ontario, Canada.” In After the Flight: The Dynamics of Refugee Settlement and Integration, ed. S. Nourpanah and M. Poteet, p. 183–227. Newcastle upon Tyne: Cambridge Scholars Publishing.
IRCC (Immigration, Refugees and Citizenship Canada). 2016. Evaluation of the Resettlement Programs (GAR, PSV, BVOR and RAP). Available at: http://www.cic.gc.ca/english/resources/ evaluation/resettlement.asp (accessed September 10, 2019).
Jedwab, J. 2018. “GARs vs. PSRs: Explaining differences in outcomes for recent refugees to Canada.” Canadian Diversity 15 (2): 38–46.
Kaida, L. 2013. “Do host country education and language training help recent immigrants exit poverty?” Social Science Research 42 (3): 726–741.
Krahn, H., T. Derwing, M. Mulder and L. Wilkinson. 2000. “Educated and underemployed: Refugee integration into the Canadian labour market.” Journal of International Migration and Integration 1 (1): 59–84.
Kumin, J. 2015. Welcoming Engagement: How Private Sponsorship Can Strengthen Refugee Resettlement in the European Union. Brussels: Migration Policy Institute Europe.
Labman, S. 2016. “Private sponsorship: Complementary or conflicting interests?” Refuge 32 (2): 67–80.
Lenard, P.T. 2016. “Resettling refugees: Is private sponsorship a just way forward?” Journal of Global Ethics 12 (3): 300–310.
Macklin, A., K. Barber, L. Goldring, J. Hyndman, A. Korteweg, S. Labman and J. Zyfi. 2018. “A preliminary investigation into private refugee sponsors.” Canadian Ethnic Studies 50 (2): 35–57.
Mata, F., and R. Pendakur. 2017. “Of intake and outcomes: Wage trajectories of immigrant classes in Canada.” Journal of International Migration and Integration 18 (3): 829–844.
McKeary, M., and B. Newbold. 2010. “Barriers to care: The challenges for Canadian refugees and their health care providers.” Journal of Refugee Studies 23 (4): 523–545.
Nakhaie, M.R. 2018. “Service needs of immigrants and refugees.” Journal of International Migration and Integration 19 (1): 143–160.
Neupane, D.R. 2012. Finding a New Job in a New Home: The Labour Market Experiences of Government Assisted Refugees in Canada. Toronto: Ryerson University. Master’s thesis.
Neuwirth, G., and L. Clark. 1981. “Indochinese refugees in Canada: Sponsorship and adjustment.” The International Migration Review 15 (1/2): 131–140.
Oda, A., M. Hynie, A. Tuck, B. Agic, B. Roche, and K. McKenzie. 2018. "Differences in self-reported health and unmet health needs between Government Assisted and Privately Sponsored Syrian Refugees: A cross-sectional survey." Journal of Immigrant and Minority Health. doi: https://doi.org/10.1007/s10903-018-0780-z.
Picot, G., Y. Zhang and F. Hou. 2019. Labour Market Outcomes among Refugees to Canada: Analytical Studies Branch Research Paper Series, no. 419. Statistics Canada Catalogue no. 11F0019M. Ottawa: Statistics Canada.
Portes, A., and R.G. Rumbaut. 2001. Legacies: The Story of the Immigrant Second Generation. Berkeley: University of California Press.
Simich, L., D. Este and H. Hamilton. 2010. “Meanings of home and mental well-being among Sudanese refugees in Canada.” Ethnicity & Health 15 (2): 199–212.
Sweetman, A., and C. Warman. 2013. “Canada’s immigration selection system and labour market outcomes.” Canadian Public Policy 39 (s1): 141–164.
Treviranus, B., and M. Casasola. 2003. “Canada’s private sponsorship of refugees program: A practitioners perspective of its past and future.” Journal of International Migration and Integration 4 (2): 177–202.
van Selm, J. 2003. “Public-private partnerships in refugee resettlement: Europe and the US.” Journal of International Migration and Integration 4 (2): 157–175.
Wilkinson, L., and J. Garcea. 2017. The Economic Integration of Refugees in Canada: A Mixed Record? Washington, D.C.: Migration Policy Institute.
Woon, Y.F. 1987. “The mode of refugee sponsorship and the socio-economic adaptation of Vietnamese in Victoria: A three-year perspective.” In Uprooting, Loss and Adaptation: The Resettlement of Indochinese in Canada, ed. K.B. Chan and D.M. Indra, p. 132–146. Ottawa: Canadian Public Health Association.
Yu, S., and C. Dempsey. 2004. “Refugees to Canada: Who are they and how are they faring?” Canadian Issues 5: 5–9.
- Date modified: