
Analytical Studies Branch Research Paper Series
The Postsecondary Experience and Early Labour Market Outcomes of International Study Permit Holders

Archived Content
Information identified as archived is provided for reference, research or recordkeeping purposes. It is not subject to the Government of Canada Web Standards and has not been altered or updated since it was archived. Please "contact us" to request a format other than those available.
Abstract
The number of temporary residents that hold a postsecondary study permit in Canada has increased rapidly in recent years, going from 201,186 in 2009 to 294,020 in 2015—a 46.1% increase. The purpose of this study is to describe the postsecondary experience and early labour market outcomes of study permit holders (international students). The study found that about two-thirds of postsecondary study permit holders actually enrolled in postsecondary programs in 2015 (up from about half in 2009). International students were somewhat more likely to graduate from their postsecondary program than Canadian students within five years of initial registration. However, international postsecondary students were considerably less likely than Canadian students to combine school and work. Furthermore, only about one-third of international students who graduated from a postsecondary program remained and worked in Canada six years after graduation. Among those who remained and worked in the country after graduation, former international students earned slightly more than Canadian students (and slightly less than permanent residents). However, international students generally possess more characteristics associated with higher earnings than Canadian students. When international and Canadian students with similar demographics, educational qualifications and pre-graduation work experience were compared, it was shown that international students earned less than Canadian students six years after graduation.
Executive summary
This study aimed to establish several facts about the educational and early labour market experiences of study permit holders. To do this, it leveraged the relative strengths of three data sources: the Longitudinal Immigration Database (IMDB), the Postsecondary Student Information System (PSIS) and the T1 Family File (T1FF).
The IMDB contains information on all temporary and permanent residents since 1980. For the purposes of this study, only the information on temporary residents was used. Specifically, the number of valid postsecondary study permit holders was generated to compare it with the actual number of international students enrolled in postsecondary programs based on data from PSIS, which contains program information for all students enrolled in Canadian public postsecondary institutions. Immigration status is listed in PSIS because postsecondary institutions are allowed to charge international students higher tuition fees than Canadian students, and this information is collected annually. Three groups were analyzed separately in this study: Canadian citizens, permanent residents, and student visa or permit holders (international students). The T1FF is a census of all Canadian taxfilers and their spouses and children. It contains detailed income information as well as basic demographics. The information on T4 wages and salaries in the T1FF was of particular interest in this study.
The study found that approximately 69.5% of postsecondary study permit holders actually enrolled in a postsecondary program in 2015—up from 51.8% in 2009. Between 2009 and 2015, the number of international postsecondary students nearly doubled. This resulted in a significant increase in the proportion of postsecondary students who were international students (from 6.6% in 2009 to 11.3% in 2015). International students enrolled in university bachelor’s degree programs accounted for about half of this increase. Although a smaller proportion of international students enrolled in college diploma programs, this was the fastest-growing group—accounting for 19.8% of international students in 2015, compared with 12.0% in 2009. In general, international students were more likely to be enrolled in university graduate programs and in higher-paying fields than Canadian students.
The study also found that the five-year graduation rates from specific programs were generally higher among international students (63.9%) than among Canadian citizens (58.6%) and permanent residents (57.0%). The gap in graduation rates was widest among doctoral students.
In 2015, 85.9% of Canadian citizens who were enrolled in postsecondary programs combined school and work, compared with 73.6% of permanent residents and 49.3% of international students. Among doctoral students, the gap between international and Canadian students was narrower.
Members of the graduating class of 2010 were the focus of further analysis. Among them, 35.5% of former international students filed T4 wages and salaries in Canada in 2016. Those who did not file may have left the country or may not have worked that year. By comparison, 79.1% of Canadian citizens and 64.7% of permanent residents who graduated in 2010 were employed in Canada in 2016.
Among graduates from the 2010 class who were employed in all years between 2011 and 2016, former international students earned slightly more than students who were Canadian citizens (and slightly less than permanent residents). However, international students generally possessed more characteristics associated with higher earnings than Canadian students. When international and Canadian students with similar demographics, educational qualifications and pre-graduation work experience were compared, it was shown that international students earned less than Canadian students six years after graduation.
In the future, linking IMDB data with postsecondary and taxation data could open new opportunities for research on international students. First, the IMDB could be used to disaggregate the results of this study by country of citizenship. Second, the relationship between educational experience and the transition to permanent residency could be explored. Third, international students may transition to a post-graduation work permit after completing their studies—future research could examine whether this type of work permit is associated with superior labour market outcomes and an increased propensity to transition to permanent residency.
Introduction
The number of temporary residents holding a postsecondary study permit in Canada has increased considerably in recent years. According to the Longitudinal Immigration Database (IMDB), there were 201,186 valid postsecondary study permit holders in Canada in 2009. This number increased by more than 20,000 per year until 2013, when it reached 293,654. Since then, the number has stabilized, sitting at 294,020 in 2015.
An increased inflow of international postsecondary students may result in more skilled labour being available to Canadian employers. However, this depends in part on how successful international students are in completing their programs and integrating into the labour market. This integration may require them to combine studies and work, as previous research has identified Canadian work experience as an important factor in determining the labour market success of immigrants (see Skuterud and Sui [2012] for a literature review). Some international students may decide to leave the country upon graduation and bring their newly obtained Canadian credentials with them to another country.
The purpose of this study is to describe the postsecondary experience and early labour market outcomes of study permit holders. Five previously unanswered questions are asked. What proportion of valid postsecondary study permit holders enrol in postsecondary programs? What are the educational characteristics of international students within the postsecondary system? What are the graduation rates of international students? What percentage of international students combine work with their postsecondary studies? What proportion of international students who graduate remain and work in Canada, and how much do they earn? In all cases, comparisons will be made with Canadian students to provide a contextual benchmark.
While it is clear that these questions are important for Canadian immigration and postsecondary education policy, little is known about international students in Canada. However, a small body of research has emerged in recent years that shed some light on international students. For example, between 20% and 27% of international students (at all levels of education) became permanent residents within 10 years of receiving their first study permit (Lu and Hou 2015). Permanent resident transition rates were typically higher among international students from countries with lower per capita gross domestic product (Lu and Hou 2015). A handful of studies have examined the earnings of former international students. Sweetman and Warman (2014) compared the earnings of former temporary foreign workers (expected to have considerable pre-landing work experience), former international students (expected to have more moderate amounts of pre-landing work experience) and skilled worker principal applicants who landed with no prior Canadian work experience. They found that former temporary foreign workers earned considerably more than skilled workers, whereas former international students earned about the same as skilled workers. Hou and Lu (2017) found that, among university-educated individuals, former international students earned less than Canadian-born workers, but more than foreign-educated immigrants (both in the short term and in the long term). They also found that a key factor behind these findings was the amount of Canadian work experience acquired by former international students. In fact, most of the gap in post-graduation earnings between former international students and Canadian-born workers could be explained by differences in work history. This highlights the importance of studying the combination of work and school for international students. Lastly, Skuterud and Chen (2018) documented deteriorating earnings of former international students as a result of postsecondary institutions and governments accepting more international students to meet growing demand. The authors argued that this comes at a cost, since the quality of international students may have declined as more were accepted (which may explain their declining labour market outcomes in recent years).
Although highly informative, all of these studies lack details on postsecondary program characteristics, such as the level and field of study. Understanding which group of international students is most likely to combine work and studies, to complete postsecondary studies, or to remain in Canada and find success in the labour market following graduation are all important pieces of information for immigration and postsecondary education policy. This study contributes to this by answering all of these questions using three datasets: the IMDB, the Postsecondary Student Information System (PSIS) and the T1 Family File (T1FF). When possible, results will be generated by the detailed educational characteristics available in PSIS, including registration status in the fall semester (full time or part time), program type (level and credential) and field of study. The next section presents the data and methods used. This is followed by a description of the findings. Lastly, the study concludes with a summary of the main results and a discussion of useful avenues for future research.
Methodology
The results of this study were derived from three data sources: the Longitudinal Immigration Database (IMDB), the Postsecondary Student Information System, (PSIS) and the T1 Family File (T1FF).
The IMDB contains information on all temporary and permanent residents since 1980. For the purposes of this study, only the information on temporary residents was used. Specifically, the number of valid postsecondary study permit holders was generated to compare it with the actual number of international students enrolled in postsecondary programs according to PSIS data.
PSIS contains detailed information on all individuals enrolled in all Canadian provincially funded postsecondary institutions,Note such as enrolment year, registration status in the fall semester (full time or part time), program type (level and credential), field of study (2011 Classification of Instructional Programs [CIP]), graduation date, sex and age. Data are collected once per year on a snapshot date that varies by institution (between September 30 and December 1). Comprehensive enrolment data are available from 2009 onwards, while comprehensive graduation data are available from 2010 onwards.Note At the time of this study, enrolment and graduation data were available up to 2015.
Five program types were considered in this study: college certificate programs (typically lasting one year); college diploma programs (typically lasting two or three years); and university degree programs at the bachelor’s, master’s and doctoral levels (all analyzed separately). Combined, these five programs accounted for 85.3% of all international student enrolments in 2015, compared with 76.0% for Canadian citizens and 71.2% for permanent residents. Enrolments in General Equivalency Diploma training, in basic educational and skills training, for qualifying credits, for credits related to non-programs, and for non-credits were excluded.
Postsecondary institutions are allowed to charge international students higher tuition fees than Canadian students, which enables them to collect information on the immigration status of their students. This information is then captured in PSIS. For the purposes of this study, three groups were analyzed: Canadian citizens, permanent residents, and student visa or permit holders (international students). All results were generated separately for these three groups of students. It is important to note that immigration status may change over time. In this study, two types of analyses were conducted. First, a cross-sectional analysis looked at outcomes on a year-by-year basis. In these instances, the analysis took into account the immigration status that prevailed during the year in question. Second, a longitudinal analysis followed individuals over time. In these cases, the immigration status that prevailed at the beginning of the observation period was used (when tracking graduation rates, this corresponds to when students first enrolled, but when tracking earnings, this corresponds to when students graduated).Note
The T1FF is a census of all Canadian taxfilers, their spouses and their children. It contains detailed income information as well as basic demographics. Data from 2004 to 2016 have been linked to PSIS. The information on T4 wages and salaries in the T1FF is of particular interest in this study. Amounts below $500 on a T4 slip do not need to be reported on income tax returns.
This study attempts to answer five questions, the first of which—what proportion of valid postsecondary study permit holders enrol in postsecondary programs?—was calculated by dividing total international student enrolments (in PSIS) by total study permit holders (in IMDB). The total counts were not expected to be the same for various reasons. For example, study permit holders may choose to work instead of studying (if they also have a valid work permit). If they do, the ratio of enrolments to study permit holders will accurately reflect this tendency. Another reason for why the total counts may not align is because of timing. Specifically, some study permit holders may have only been enrolled in postsecondary programs before the snapshot date in PSIS, while others may have only been enrolled after the snapshot date. These instances—which cannot be quantified—add noise to the ratio of enrolments to study permit holders.
The second question—what are the educational characteristics of international students within the postsecondary system?—was answered using PSIS data. Educational characteristics include registration status (full time or part time), program type (level and credential) and field of study (2011 CIP primary groupings). All enrolments were considered for this analysis, which covered the period from 2009 to 2015.
The third question—what are the graduation rates of international students?—was also answered using only PSIS data. The focus of this question was on new full-time enrolments in 2010 (i.e., students who did not appear in PSIS in 2009). Students were then followed until 2015 or until they graduated from the program they entered in 2010. Only graduations from the initial program were considered (defined as being within the same institution and program type—level and credential). In other words, even if students switched fields of study, it would still count as the same program. In a complementary analysis, results were also generated by defining graduation within institutions, program types and specific fields of study.
To answer the fourth question—what percentage of international students combine work with their postsecondary studies?—data from the T1FF were required to complement the PSIS data. The focus of this question was on individuals who were enrolled in a given year, but did not graduate that year. Therefore, the analysis covered the period from 2010 to 2015. Any individual with positive T4 wages and salaries was classified as having combined employment with their postsecondary studies.
To answer the final question—what proportion of international students who graduate remain and work in Canada, and how much do they earn?—data from PSIS and the T1FF were required. The sample was limited to individuals who graduated in 2010 (according to PSIS) and were then followed up to 2016 in the T1FF. Among this group, the percentage of those who worked (those who filed T4 wages and salaries) was determined, and their mean wages and salaries were generated. Individuals who earn T4 wages and salaries are normally expected to claim them for tax purposes. However, small amounts are exempt (under $500). Furthermore, some individuals may file their taxes late, which was not reflected in this study. Overall, between 3.5% and 4.8% of all taxfilers delay filing their tax returns each year (Messacar 2018). The mean earnings of former international students were compared with those of Canadian students in a multivariate framework (ordinary least squares regression) that accounted for group differences in several determinants of earnings, such as sex, age, program type and field of study.
Results
The numbers of valid postsecondary study permit holders based on the Longitudinal Immigration Database (IMDB) are shown below in Chart 1 and were referenced in the introduction. The actual numbers of international postsecondary students according to the Postsecondary Student Information System, (PSIS) data are also shown in the chart. The ratio of enrolments to study permit holders has increased substantially in recent years—from 51.8% in 2009 to 69.5% in 2015.Note This increased propensity to enrol has occurred at the same time as the number of study permit holders increased significantly.

Data table for Chart 1
| Longitudinal Immigration Database | Postsecondary Student Information System | |
|---|---|---|
| number | ||
| 2009 | 201,186 | 104,307 |
| 2010 | 222,444 | 118,414 |
| 2011 | 244,489 | 133,358 |
| 2012 | 267,901 | 144,041 |
| 2013 | 293,654 | 164,597 |
| 2014 | 292,159 | 175,292 |
| 2015 | 294,020 | 204,375 |
| Sources: Statistics Canada, Longitudinal Immigration Database and Postsecondary Student Information System. | ||
Total enrolments in five programs (college certificate and diploma programs, as well as university bachelor’s, master’s and doctoral degree programs) are shown by immigration status and year in Chart 2. Between 2009 and 2015, significant increases were registered among students who were Canadian citizen students (83,086, or 7.4%), permanent resident students (11,356, or 13.4%) and international students (81,660, or 96.5%). The large percentage increase in international students has resulted in a significant increase in the percentage of international students in the overall student body. In 2009, 6.6% (84,582) of the students in these programs were international students. By 2015, they represented 11.3% of the student body, or 166,242 students in total.

Data table for Chart 2
| Canadian citizens | Permanent residents | International students | |
|---|---|---|---|
| number | |||
| 2009 | 1,119,679 | 84,544 | 84,582 |
| 2010 | 1,166,203 | 92,090 | 95,044 |
| 2011 | 1,185,352 | 94,747 | 107,500 |
| 2012 | 1,182,878 | 93,856 | 116,037 |
| 2013 | 1,204,233 | 98,618 | 133,141 |
| 2014 | 1,155,038 | 94,226 | 142,173 |
| 2015 | 1,202,765 | 95,900 | 166,242 |
| Source: Statistics Canada, Postsecondary Student Information System. | |||
The proportion of female postsecondary students varied considerably by immigration status. For example, in 2015, 57.0% of Canadian citizens enrolled in postsecondary programs were female, compared with 52.7% of permanent residents and only 45.0% of international students.
International students were more likely than Canadian students to register for full-time studies. While 90.7% of international students were registered in full-time studies in 2015, this figure was only 82.5% for permanent residents and 85.2% for Canadian citizens.
The distribution of students across programs by immigration status in 2015 is shown in Chart 3. International students were more likely to be registered in graduate programs than Canadian citizens and permanent residents. In 2015, 15.1% of international students were registered in master’s degree programs, while 9.5% were registered in doctoral programs. In contrast, only 7.4% of Canadian citizens were registered in master’s degree programs and 2.4% were registered in doctoral programs. The percentage of permanent residents in either program type was between that of Canadian citizens and international students.

Data table for Chart 3
| Canadian citizens | Permanent residents | International students | |
|---|---|---|---|
| percent | |||
| College certificate | 4.989254 | 4.144943 | 2.237100 |
| College diploma | 23.037252 | 19.843587 | 19.816292 |
| University bachelor's degree | 62.171247 | 58.657977 | 53.411894 |
| University master's degree | 7.436199 | 10.046924 | 15.067793 |
| University doctoral degree | 2.366048 | 7.306569 | 9.466922 |
| Source: Statistics Canada, Postsecondary Student Information System. | |||
For the most part, the distribution of students by program type was similar in 2009. One notable exception is that international students were considerably more likely to be registered in college diploma programs in 2015 (19.8%) than in 2009 (12.0%). Conversely, international students were less likely to be registered in university bachelor’s degree programs in 2015 (53.4%) than in 2009 (58.8%). Although the percentage of international students registered in university bachelor’s degree programs declined, there was still a substantial increase in the number of such enrolments (39,085, which accounted for almost half of the increase in international students across the five programs).
In 2015, international students were much more likely than Canadian citizens to be registered in business, management and public administration; mathematics, computer and information sciences; architecture, engineering, and related technologies; and agriculture, natural resources and conservation. They were less likely to be registered in education; visual and performing arts, and communications technologies; humanities; social and behavioural sciences and law; and health and related fields (Chart 4). For the most part, permanent residents’ fields of study more closely resembled those of international students than those of Canadian citizens. Two notable exceptions were business, management and public administration, and health and related fields, where the reverse was true. For all three groups, the distribution by field of study has not changed much since 2009.
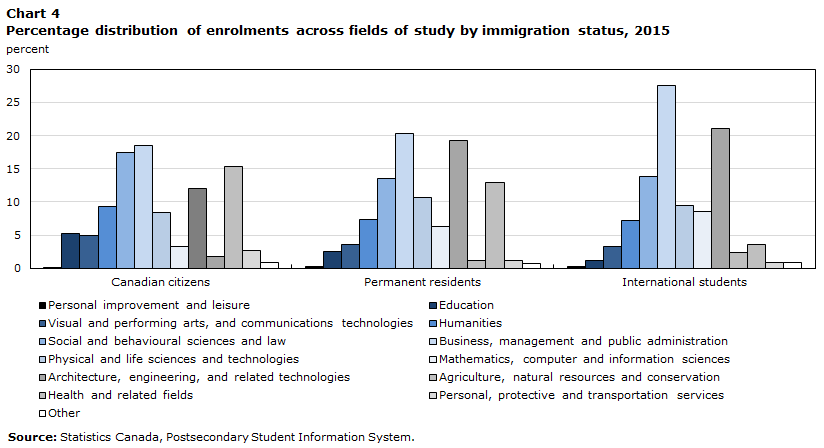
Data table for Chart 4
| Canadian citizens | Permanent residents | International students | |
|---|---|---|---|
| percent | |||
| Personal improvement and leisure | 0.035335 | 0.297185 | 0.306782 |
| Education | 5.251816 | 2.527633 | 1.088774 |
| Visual and performing arts, and communications technologies | 4.859885 | 3.580813 | 3.297602 |
| Humanities | 9.358686 | 7.328467 | 7.221400 |
| Social and behavioural sciences and law | 17.516556 | 13.509906 | 13.763068 |
| Business, management and public administration | 18.544105 | 20.347237 | 27.560424 |
| Physical and life sciences and technologies | 8.465245 | 10.715328 | 9.474742 |
| Mathematics, computer and information sciences | 3.233134 | 6.302398 | 8.576052 |
| Architecture, engineering, and related technologies | 12.027703 | 19.279458 | 21.025373 |
| Agriculture, natural resources and conservation | 1.817811 | 1.202294 | 2.376054 |
| Health and related fields | 15.369918 | 12.965589 | 3.555058 |
| Personal, protective and transportation services | 2.701525 | 1.236705 | 0.877636 |
| Other | 0.818281 | 0.706986 | 0.877035 |
| Source: Statistics Canada, Postsecondary Student Information System. | |||
The graduation rates by immigration status among new full-time program entrants in 2010 are shown in Chart 5. Two years or more after initial registration (2012), international students were slightly more likely to graduate from their program (defined by institution and program type) than Canadian students. By 2015 (five years after first registration), 63.9% of international students had graduated from their program, compared with 58.6% of Canadian citizens and 57.0% of permanent residents.

Data table for Chart 5
| Canadian citizens | Permanent residents | International students | |
|---|---|---|---|
| percent | |||
| By 2010 | 0.73424 | 0.43064 | 0.12596 |
| By 2011 | 11.54604 | 8.62905 | 8.38811 |
| By 2012 | 22.61126 | 20.54511 | 26.12478 |
| By 2013 | 30.39900 | 28.23658 | 37.37847 |
| By 2014 | 47.79452 | 43.92478 | 54.11533 |
| By 2015 | 58.64219 | 56.97465 | 63.90868 |
| Source: Statistics Canada, Postsecondary Student Information System. | |||
Given the differences in expected program duration by program type, this study looked at how graduation rates varied by program type. Although graduation rates were generally similar regardless of immigration status for most program types, there was one notable exception: international students were considerably more likely to complete their doctoral studies within five years—38.5% of them did so, compared with 29.7% of Canadian citizens and 27.3% of permanent residents. This is an important finding, as international students are more likely than Canadian students to register in doctoral programs.
So far, students were considered to have graduated from their original program if they remained in the same institution and program type (level and credential). Switching fields during their studies did not affect the calculation. If a change in the field of study counted as a new program, then—unsurprisingly—graduation rates would decline substantially. However, the patterns by immigration status would remain the same. Overall, 45.8% of international students graduated within five years based on the more restrictive definition of graduation. By comparison, 41.4% of Canadian citizens and 39.0% of permanent residents graduated within the same time frame.
Students may also change levels of schooling (e.g., from college to university), as shown in Table 1. The sample consists of students who initially enrolled in either university or college in 2010 and were still enrolled in postsecondary programs in either 2011 or 2012. The table shows the percentage of these students who changed levels one or two years after they first enrolled. Among students who first enrolled in university in 2010, 5.3% of Canadian citizens and 4.2% of permanent residents had transferred to college by 2012, compared with only 2.1% of international students. Therefore, international students were more likely to remain in university (as opposed to transferring to college) than Canadian students. In contrast, international students who initially enrolled in college were far more likely to transfer to university than Canadian students. Two years after initial college enrolment, 20.2% of international students had transferred to university, compared with 12.6% of permanent residents and 10.1% of Canadian citizens.
| Canadian citizens | Permanent residents | International students | |
|---|---|---|---|
| percent | |||
| Enrolled in university in 2010 | |||
| Enrolled in college in 2011 | 3.2 | 2.8 | 1.1 |
| Enrolled in college in 2012 | 5.3 | 4.2 | 2.1 |
| Enrolled in college in 2010 | |||
| Enrolled in university in 2011 | 2.7 | 3.4 | 8.2 |
| Enrolled in university in 2012 | 10.1 | 12.6 | 20.2 |
|
Note: Samples are limited to students still enrolled in postsecondary programs. Source: Statistics Canada, Postsecondary Student Information System. |
|||
Chart 6 shows the percentage of students who filed T4 wages and salaries by immigration status. Between 2009 and 2015, international students were considerably less likely than Canadian citizens to have worked while being enrolled in postsecondary programs. The propensity of permanent resident students to have worked was between that of the other two groups throughout the study period. In 2015, 85.9% of Canadian citizens combined school and work, compared with 73.6% of permanent residents and 49.3% of international students.

Data table for Chart 6
| Canadian citizens | Permanent residents | International students | |
|---|---|---|---|
| percent | |||
| 2009 | 83.18664 | 64.60576 | 35.24685 |
| 2010 | 83.95916 | 65.41769 | 39.26730 |
| 2011 | 84.92338 | 67.73606 | 43.81687 |
| 2012 | 85.56724 | 69.63807 | 48.49088 |
| 2013 | 85.78109 | 70.71334 | 49.66329 |
| 2014 | 86.17487 | 72.41114 | 51.01548 |
| 2015 | 85.93203 | 73.57226 | 49.32209 |
| Sources: Statistics Canada, Postsecondary Student Information System and T1 Family File. | |||
One of the reasons why international students were less likely to be employed than Canadian students might be because of the rules governing international students’ right to work. Prior to June 1, 2014, international students had to obtain a permit to work off campus and had to study for a period of at least six months before doing so. As of June 1, 2014, these rules are no longer in place, which may result in higher international student employment rates in the future.
International students may work on or off campus without a work permit if they are enrolled in full-time studies. However, the expected net effect of full-time enrolment on work patterns is ambiguous, since full-time students have less time available to work. Indeed, both full-time and part-time international students were considerably less likely to be employed while in school than their Canadian counterparts throughout the study period. For both Canadian and international students, the employment rate was slightly higher among part-time students than full-time students.
When the data were analyzed by program type, a different pattern emerged. Chart 7 shows the percentage of students who filed T4 wages and salaries in 2015, by immigration status and program type. The same general pattern of higher employment rates among Canadian students was observed for all program types, but to varying degrees. For example, the gap in employment rates between international and Canadian students was narrowest among doctoral candidates, followed by master’s degree and college diploma candidates. The gap was widest among university bachelor’s degree students.
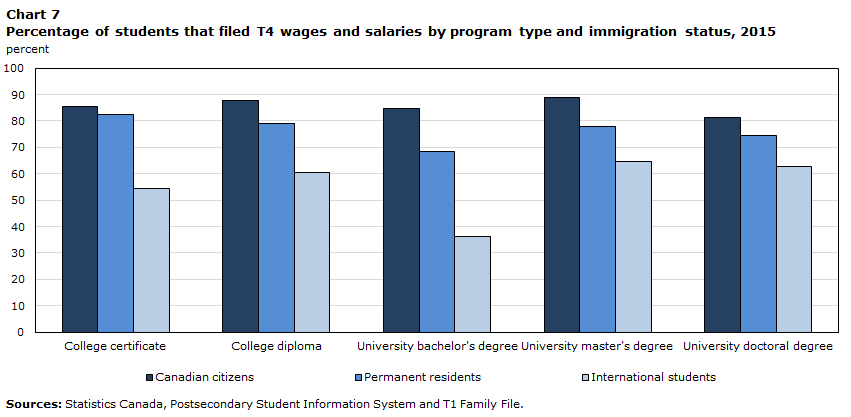
Data table for Chart 7
| Canadian citizens | Permanent residents | International students | |
|---|---|---|---|
| percent | |||
| College certificate | 85.63385 | 82.43308 | 54.41515 |
| College diploma | 87.64210 | 79.10861 | 60.65409 |
| University bachelor's degree | 84.80346 | 68.61307 | 36.31303 |
| University master's degree | 89.04423 | 77.91383 | 64.74318 |
| University doctoral degree | 81.15007 | 74.62205 | 62.59109 |
| Sources: Statistics Canada, Postsecondary Student Information System and T1 Family File. | |||
Why is the employment gap between international and Canadian students narrowest at the doctoral level? Although the data cannot answer this question, employment opportunities for graduate students often consist of university employment, such as research or teaching assistantships. Candidate pools for these types of jobs may be smaller than for jobs available to students in college or at the undergraduate level. Furthermore, the incentive to combine work and school may be higher among international graduate students, as they are not eligible for most of the student awards from the three major federal granting agencies: the Social Sciences and Humanities Research Council, the Sciences and Engineering Research Council of Canada, and the Canadian Institutes of Health Research.Note
Results were also generated by field of study. However, the same broad patterns emerged within each discipline. Specifically, international students were considerably less likely than Canadian students to be employed while studying.
The final component of the analysis relates to post-graduation earnings. Among international students who graduated in 2010, 35.5% filed T4 wages and salaries in 2016. Those who did not file may have left the country or may not have worked that year. By comparison, 79.1% of Canadian citizens and 64.7% of permanent residents who graduated in 2010 were employed in 2016.Note
Chart 8 shows the progression of mean earnings by immigration status among graduates who were employed every year between 2011 and 2016. While the mean earnings of former international students were below those of Canadian citizens one year after graduation, they rose comparatively faster over the following five years. By 2016, the mean earnings of former international students were $59,890, compared with $58,704 among Canadian citizens who had also graduated in 2010. However, the highest level of mean earnings was registered by permanent residents over the follow-up period, reaching $64,376 in 2016.Note
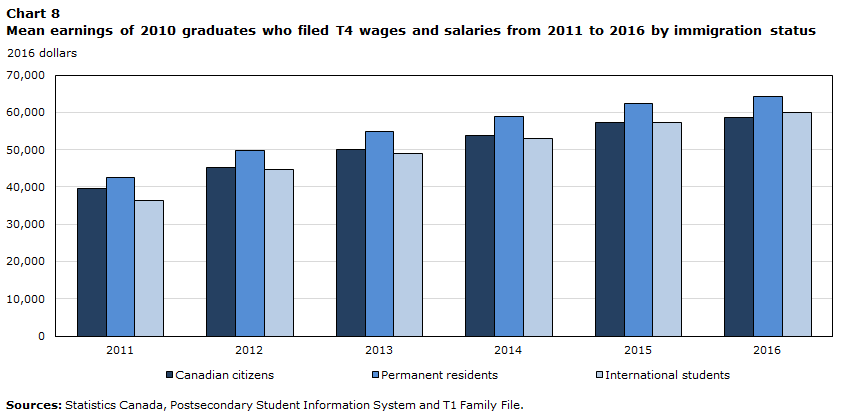
Data table for Chart 8
| Canadian citizens | Permanent residents | International students | |
|---|---|---|---|
| 2016 dollars | |||
| 2011 | 39,628.29 | 42,606.39 | 36,347.43 |
| 2012 | 45,276.67 | 49,643.36 | 44,576.64 |
| 2013 | 50,004.28 | 54,845.35 | 48,888.28 |
| 2014 | 53,773.30 | 58,803.69 | 52,932.71 |
| 2015 | 57,256.45 | 62,334.20 | 57,381.73 |
| 2016 | 58,704.34 | 64,376.25 | 59,889.76 |
| Sources: Statistics Canada, Postsecondary Student Information System and T1 Family File. | |||
Canadian and international students differ with respect to several important earnings determinants. For example, international students are more likely to have graduated from a master’s or doctoral degree program than Canadian students, both of which are associated with relatively high pay (e.g., Frenette 2019). International students are more likely to be male than Canadian students, which is also associated with higher pay (e.g., Baker and Drolet 2010). The fields of study chosen differ widely depending on immigration status—international students are more likely than Canadian students to register in business, management and public administration; mathematics, computer and information sciences; and architecture, engineering, and related technologies. All of these are generally high-paying fields (e.g., Frenette and Frank 2016; Frenette 2019). International students are also generally younger upon graduationNote and have fewer years of pre-graduation work experience than Canadian students.Note
To compare the labour market outcomes of international and Canadian students with similar qualifications and demographic characteristics, a multivariate framework was required. To that end, T4 wages and salaries in 2016 were regressed on dummy variables indicating the immigration status (Model 1), as well as a female dummy variable, age, age squared, dummy variables indicating the program type (level and credential), dummy variables indicating the field of study, as well as the number of years of pre-graduation work experience and its squared value (Model 2). The results are shown in Table 2.
| Model 1 | Model 2 | |||
|---|---|---|---|---|
| coefficient | standard error | coefficient | standard error | |
| Canadian citizens (omitted) | ||||
| Permanent residents | 5,672Note *** | 409 | -2,001Note *** | 394 |
| International students | 1,185Note * | 600 | -5,833Note *** | 604 |
| Male (omitted) | ||||
| Female | Note ...: not applicable | Note ...: not applicable | -14,947Note *** | 187 |
| Age | Note ...: not applicable | Note ...: not applicable | 832Note *** | 80 |
| Age squared | Note ...: not applicable | Note ...: not applicable | -6Note *** | 1 |
| College certificate (omitted) | ||||
| College diploma | Note ...: not applicable | Note ...: not applicable | 1,451Note *** | 298 |
| University bachelor's degree | Note ...: not applicable | Note ...: not applicable | 17,615Note *** | 290 |
| University master's degree | Note ...: not applicable | Note ...: not applicable | 32,124Note *** | 361 |
| University doctoral degree | Note ...: not applicable | Note ...: not applicable | 41,909Note *** | 795 |
| Personal improvement and leisure (omitted) | ||||
| Education | Note ...: not applicable | Note ...: not applicable | 179 | 2,904 |
| Visual and performing arts, and communications technologies | Note ...: not applicable | Note ...: not applicable | -7,693Note ** | 2,920 |
| Humanities | Note ...: not applicable | Note ...: not applicable | -7,208Note * | 2,907 |
| Social and behavioural sciences and law | Note ...: not applicable | Note ...: not applicable | 146 | 2,896 |
| Business, management and public administration | Note ...: not applicable | Note ...: not applicable | 12,765Note *** | 2,892 |
| Physical and life sciences and technologies | Note ...: not applicable | Note ...: not applicable | -1,298 | 2,916 |
| Mathematics, computer and information sciences | Note ...: not applicable | Note ...: not applicable | 9,065Note ** | 2,931 |
| Architecture, engineering, and related technologies | Note ...: not applicable | Note ...: not applicable | 17,508Note *** | 2,894 |
| Agriculture, natural resources and conservation | Note ...: not applicable | Note ...: not applicable | 461 | 2,962 |
| Health and related fields | Note ...: not applicable | Note ...: not applicable | 10,467Note *** | 2,892 |
| Personal, protective and transportation services | Note ...: not applicable | Note ...: not applicable | 8,500Note ** | 2,916 |
| Other | Note ...: not applicable | Note ...: not applicable | 3,114 | 3,045 |
| Number of years of pre-graduation work experience in Canada | Note ...: not applicable | Note ...: not applicable | 1,363Note *** | 239 |
| Number of years of pre-graduation work experience in Canada squared | Note ...: not applicable | Note ...: not applicable | 1 | 31 |
| Intercept | 58,704Note *** | 95 | 23,528Note *** | 3,144 |
... not applicable
Notes: The sample size for both models is 187,683. The adjusted R-squared value is 0.001 for Model 1 and 0.165 for Model 2. Sources: Statistics Canada, Postsecondary Student Information System and T1 Family File. |
||||
In both models, the key coefficients of interest were those associated with the international student and permanent resident variables. In all cases, these refer to differences in mean T4 wages and salaries between international students (or permanent residents) and Canadian citizens (the reference—or omitted—group). In Model 1, the coefficients reflect the raw (or unadjusted) differences in wages and salaries. On average, international students earned $1,185 more than Canadian citizens (statistically significant at 5%) six years after graduation (see Model 1 results in Table 2). Permanent residents earned even more—$5,672 more than Canadian citizens (statistically significant at 0.1%) six years after graduation. Therefore, despite the fact that international students generally possessed more characteristics associated with higher earnings than Canadian students, international students earned only slightly more than Canadian citizens on average and actually earned less than permanent residents (statistically significant at 0.1%).
What if international and domestic students possessed the same characteristics? In Model 2, the coefficients of interest refer to differences in earnings after taking differences in characteristics into account. After this adjustment was made, it was shown that international students generally earned less than Canadian students. Specifically, international students earned $5,833 less than Canadian citizens six years after graduation (statistically significant at 0.1%). Permanent residents also earned less than Canadian citizens after accounting for the differences in the factors in Model 2. The difference in this case was $2,001 (statistically significant at 0.1%).Note Note
In documenting the relatively poor labour market outcomes of former international students, Skuterud and Chen (2018) highlighted three possible challenges: job search frictions (because of weaker social networks), discrimination from Canadian employers (because of foreign-sounding names) (Oreopoulos 2011) and difficulties in official language (English and French) communication, which could limit their job search and on-the-job performance.Note
Conclusion
As the number of postsecondary study permit holders has increased considerably in recent years, obtaining a clear understanding of their presence in the postsecondary system, as well as of their early labour market outcomes, is highly relevant for immigration and postsecondary education policy.
This study aimed to establish several facts about the educational and early labour market experiences of international students. The study found that approximately 69.5% of postsecondary study permit holders actually enrolled in a postsecondary program in 2015—up from 51.8% in 2009. Between 2009 and 2015, the number of international postsecondary students nearly doubled. This resulted in a significant increase in the proportion of postsecondary students who were international students (from 6.6% in 2009 to 11.3% in 2015). International students enrolled in university bachelor’s degree programs accounted for about half of this increase. Although a smaller proportion of international students enrolled in college diploma programs, this was the fastest-growing group—accounting for 19.8% of international students in 2015, compared with 12.0% in 2009. In general, international students were more likely to be enrolled in university graduate programs and in higher-paying fields than Canadian students.
The study also found that the five-year graduation rates from specific programs were generally higher among international students (63.9%) than among Canadian citizens (58.6%) and permanent residents (57.0%). The gap in graduation rates was widest among doctoral students.
In 2015, 85.9% of Canadian citizens who were enrolled in postsecondary programs combined school and work, compared with 73.6% of permanent residents and 49.3% of international students. Among doctoral students, the gap between international and Canadian students was narrower.
Members of the graduating class of 2010 were the focus of further analysis. Among them, 35.5% of former international students filed T4 wages and salaries in Canada in 2016. Those who did not file may have left the country or may not have worked that year. By comparison, 79.1% of Canadian citizens and 64.7% of permanent residents who graduated in 2010 were employed in Canada in 2016.
Among graduates from the 2010 class who were employed in all years between 2011 and 2016, former international students earned slightly more than students who were Canadian citizens (and slightly less than permanent residents). However, international students generally possessed more characteristics associated with higher earnings than Canadian students. When international and Canadian students with similar demographics, educational qualifications and pre-graduation work experience were compared, it was shown that international students earned less than Canadian students six years after graduation.
In the future, linking the Longitudinal Immigration Database (IMDB) data with postsecondary and taxation data could open new opportunities for research on international students. First, the IMDB could be used to disaggregate the results of this study by country of citizenship. Second, the relationship between educational experience and the transition to permanent residency could be explored. Third, international students may transition to a post-graduation work permit after completing their studies—future research could examine whether this type of work permit is associated with superior labour market outcomes and an increased propensity to transition to permanent residency.
References
Baker, M., and M. Drolet. 2010. “A new view of the male/female pay gap.” Canadian Public Policy 36 (4): 429–464.
Frenette, M. 2019. Are the Career Prospects of Postsecondary Graduates Improving? Analytical Studies Branch Research Paper Series, no. 415. Statistics Canada Catalogue no. 11F0019M. Ottawa: Statistics Canada.
Frenette, M., and K. Frank. 2016. Earnings of Postsecondary Graduates by Detailed Field of Study. Economic Insights, no. 56. Statistics Canada Catalogue no. 11-626-X. Ottawa: Statistics Canada.
Hou, F., and Y. Lu. 2017. International Students, Immigration and Earnings Growth: The Effect of a Pre-immigration Canadian University Education. Analytical Studies Branch Research Paper Series, no. 395. Statistics Canada Catalogue no. 11F0019M. Ottawa: Statistics Canada.
Li, C. 2006. Canada’s Private Colleges: The Lesser Known Players in Postsecondary Education. Analysis in Brief, no. 36. Statistics Canada Catalogue no. 11-621-MIE. Ottawa: Statistics Canada.
Lu, Y., and F. Hou. 2015. International Students Who Become Permanent Residents in Canada. Insights on Canadian Society. Statistics Canada Catalogue no. 75-006-X. Ottawa: Statistics Canada.
Messacar, D. 2018. Big Tax Data and Economic Analysis: Effects of Personal Income Tax Reassessments and Delayed Tax Filing. Analytical Studies: Methods and References, no. 12. Statistics Canada Catalogue no. 11-633-X. Ottawa: Statistics Canada.
Oreopoulos, P. 2011. “Why do skilled immigrants struggle in the labor market? A field experiment with thirteen thousand resumes.” American Economic Journal: Economic Policy, Vol. 3, no. 4: 148–171.
Skuterud, M., and Z.J. Chen. 2018. Comparing Outcomes: The Relative Job-Market Performance of Former International Students. C.D. Howe Institute Commentary no. 518.
Skuterud, M., and M. Sui. 2012. “The influence of measurement error and unobserved heterogeneity in estimating immigrant returns to foreign and host-country sources of human capital.” Empirical Economics 43 (3): 1109–1141.
Sweetman, A., and C. Warman. 2014. “Former temporary foreign workers and international students as sources of permanent immigration.” Canadian Public Policy 40 (4): 392–407.
- Date modified: