
Analytical Studies Branch Research Paper Series
Pay Transparency and the Gender Gap

Archived Content
Information identified as archived is provided for reference, research or recordkeeping purposes. It is not subject to the Government of Canada Web Standards and has not been altered or updated since it was archived. Please "contact us" to request a format other than those available.
Abstract
This paper examines the impact of public sector salary disclosure laws on university faculty salaries in Canada. These laws, which give the public access to the salaries of individual faculty members if they exceed specified thresholds, were introduced in different provinces at different points in time. Using detailed administrative data covering the universe of university faculty in Canada and an event-study research design, this study documented three key findings. First, the disclosure laws reduced salaries on average. Second, the laws reduced the gender wage gap between men and women. Third, the gender wage gap narrowed primarily in universities where faculty members are unionized.
Keywords: Salary disclosure laws; pay transparency; gender wage gap; event study; University and College Academic Staff System (UCASS)
Executive summary
One of the most persistent and salient features of labour markets around the world is that women earn less than men. A hypothesis recently gaining traction among academic researchers and policy makers is that the gender earnings gap persists in part because it is hidden. There have also been calls in the private sector for more transparency on pay discrepancies between male and female workers.
As a result, transparency laws are increasingly being considered as a policy to reduce the gender wage gap. However, despite the increase in transparency legislation in Canada and other countries, there has been limited academic research that sheds light on whether pay transparency systematically reduces the gender wage gap. This is a significant shortcoming because transparency laws presumably impose costs on employers and increase the administrative burden. Whether these laws meet the standard of a cost-benefit analysis depends on whether they create more equality between genders, given the efficiency cost.
This paper provides new evidence on the causal effect of pay transparency laws on salaries. Specifically, the impact of the (staggered) introduction of pay disclosure laws on university faculty salaries across Canadian provinces is examined. In 1996, British Columbia, Manitoba and Ontario were the first to introduce disclosure laws, and several other provinces have passed such legislation more recently.
To evaluate the effect of these laws, administrative data on the salaries of full-time academic employees at Canadian postsecondary institutions from 1970 onwards are used, based on an analysis of the University and College Academic Staff System. The research design uses the variation across Canadian provinces in the rollout of the disclosure laws, as well as within-province variation in exposed departments.
The following three key results were established:
- Transparency laws reduce faculty salaries by approximately 1 to 3 percentage points on average.
- These laws also reduce the gender wage gap by approximately 2.2 to 2.4 percentage points. This represents a roughly 30% reduction in the gap, from a base of 7% to 8%, which was the gender wage gap that prevailed at the time of the first series of transparency reforms in Canada. This effect primarily reflects a slowing in the growth of salaries for male faculty members. There is also some evidence to suggest that the salaries of female faculty members have increased, although the estimates are smaller in magnitude.
- The effects of salary disclosure on average wages and the gender wage gap are more pronounced in unionized workplaces. For example, female wages increased by roughly 1 percentage point in response to the introduction of a disclosure law in unionized universities, whereas that change was close to zero in non-unionized universities. Unions may play an important role in the response to disclosure, since universities must participate in—and respond to—the formal grievance procedures of unionized workplaces. The existence of a formal grievance procedure might particularly benefit women in an environment where the majority of chairs and senior faculty members are men.
The results of this study are informative about the partial equilibrium impacts of pay transparency laws. However, it is possible that such laws have spillover effects that lead to broader changes in social norms and, as a result, the general equilibrium effects of these laws may be different.
1 Introduction
One of the most persistent and salient features of labour markets around the world is that women earn less than men. For example, in the United States, a woman typically earns roughly 77 dollars for every 100 dollars earned by a man (Goldin 2014). A hypothesis recently gaining traction among academic researchers and policy makers is that the gender earnings gap persists in part because it is hidden. This is buttressed by a series of policy reforms that mandate the disclosure of salaries broken down by gender.Note In the United States, President Obama passed legislation requiring firms with government contracts to disclose the average wages of employees by gender, although this was subsequently rolled back by President Trump.Note There have also been calls in the private sector for more transparency on pay differences between male and female workers; for example, technology firms are facing public pressure to disclose salaries broken down by gender.Note
Outside the United States, transparency laws are increasingly being considered as a policy to reduce the gender earnings gap. Denmark introduced legislation in 2006 requiring large firms to report wage statistics broken down by gender (Bennedsen et al. 2019). Starting in 2017, firms in the United Kingdom with more than 250 employees are required to report pay and bonuses broken down by gender (The Equality Act 2010 (Gender Pay Gap Information) (S.I. 2017/172)).Note Similar reforms are underway in Australia, France and Germany. In Canada, the Pay Transparency Act (2018, S.O. 2018, C.5 – Bill 3), which was introduced recently in Ontario, requires all publicly advertised job postings to include a salary range, bars employers from asking about past compensation and mandates employers to report gender earnings gaps to the province.Note
Despite the increase in transparency legislation, there has been limited academic research that sheds light on whether pay transparency systematically reduces the gender wage gap. This is a significant shortcoming because transparency laws presumably impose costs on employers and increase the administrative burden. Whether these laws meet the standard of a cost-benefit analysis depends on whether they create more equality between genders, given the efficiency cost.
This paper provides new evidence on the causal effect of pay transparency laws on salaries. The impact of the (staggered) introduction of pay disclosure laws on university faculty salaries across Canadian provinces is examined. In 1996, British Columbia, Manitoba and Ontario were the first to introduce disclosure laws that require universities to report the salaries of each employee earning over $50,000 (British Columbia and Manitoba) and over $100,000 (Ontario). Disclosure laws in other provinces have passed more recently, and only four provinces currently lack the explicit legal means to publicize university faculty salaries.
To evaluate the effect of these laws, Statistics Canada administrative data on the salaries of full-time academic employees at Canadian colleges and universities from 1970 onwards are used. These data have nearly 100% coverage of full-time faculty members at Canadian universities, and almost all universities in Canada are in the public sector. This dataset contains a wide range of demographic and job-related variables relevant to identifying and explaining the evolution of the gender wage gap over time. With these variables, the salaries that are “exposed” by these laws can be determined at a very detailed level. This is one of the few datasets that jointly provides information on earnings and demographic characteristics for a comprehensive set of employers within a sector.
The research design uses variation across Canadian provinces in the rollout of the disclosure laws, as well as within-province variation in exposed departments. Since the laws apply only to faculty members with salaries above thresholds, lower-paying departments were not affected by the disclosure. However, higher-paying departments were affected, which provides an additional source of within-province variation. Therefore, treatment and control groups can be defined at the academic unit level, and time-varying trends at the provincial level can be controlled for in a flexible manner.
The university sector is a good setting for studying the impact of transparency laws on the gender wage gap for several reasons. First, the gender gap was pervasive at all academic ranks and across all academic institutions in Canada over the period of study.Note Second, there is consensus on the output of academic faculty—classes taught, research publications, administrative service—and it is relatively easy to observe. Therefore, there is logic to the potential arguments in favour of salary redress under a disclosure law. Third, the well-established and widely adopted divisions of faculty by department and rank allow for precise definitions of reference groups. Fourth, given the way salaries are determined in the university sector, earnings differentials reflect wage differentials rather than differences in hours worked. Lastly, the ease of access to the information revealed by some disclosure laws studied depends on Internet access, and universities were at the forefront of providing Internet access to their employees over the study period.
Three key results were established. First, transparency laws reduce faculty salaries on average. In particular, transparency laws lead to a statistically significant 1- to 3-percentage-point reduction in salaries. Second, transparency laws reduce the gender wage gap: there is a statistically significant reduction of 2.2 to 2.4 percentage points. This represents a roughly 30% reduction in the gap, from a base of 7% to 8%, which was the gender wage gap that prevailed at the time of the first series of transparency reforms in Canada. The estimates indicate that the reduction in the gender wage gap reflects a slowing in the growth of salaries for male faculty members in the treatment group relative to the control group. There is also some evidence to suggest that the salaries of female faculty members have increased, although the estimates are smaller in magnitude. Third, the effects of salary disclosure on average wages and the gender wage gap are more pronounced in unionized workplaces.
This paper contributes to several strands of the literature on pay transparency. Several studies have examined the effects of transparency on wages. Gomez and Wald (2010) evaluated the impact of pay disclosure in the province of Ontario and found that the salaries of university presidents in the province increased relative to the average public sector salary and also led to higher growth in average professorial salaries in Ontario relative to other provinces.Note Mas (2017) looked at the effects of a law change in California that mandated the online disclosure of municipal salaries and found salary compression.
Closer to the present context, Bennedsen et al. (2019) examined the impact of a law in Denmark that required firms of more than 35 employees to provide salary data by gender to employees through their employee representative. The data are reported for groups that are large enough to protect the anonymity of individuals.Note Using a difference-in-differences design that compares firms with 35 to 50 employees to firms with 20 to 34 employees, Bennedsen et al. (2019) found that the disclosure law led to a reduction in the gender wage gap in treated firms primarily because of a slowing in men’s wage growth.Note
There are a couple of differences between the present study and that of Bennedsen et al. (2019). First, the nature of the transparency law is very different between the two contexts. In Denmark, either salary gaps are disclosed by firms to an employee representative or the firms draft an internal report on pay equity, whereas in the present context, all salaries above a certain threshold are disclosed and accessible directly by all workers. Second, unlike Bennedsen et al. (2019), who focused on private sector workers, this paper studies public sector workers. Therefore, the two papers are complementary in this respect. Nevertheless, the results of the two studies are quite similar—a reduction in the gender wage gap driven in part by lower salaries among men was also found in the present study.
Other studies have examined the impacts of pay transparency on other outcomes. Cullen and Perez-Truglia (2018) conducted a field experiment at a large corporation that revealed the salaries of peers and managers. They found that a higher perceived peer salary lowers effort, output and retention, whereas a higher perceived manager salary increases these outcomes. Card et al. (2012) used a randomized information experiment to show that pay transparency reduced the well-being of university faculty members in departments where they earned below-median pay in California. Breza, Kaur and Shamdasani (2018) showed that the productivity of Indian manufacturing workers decreased when they were able to find out the salaries of their peers. Perez-Truglia (2019) looked at how transparency affects well-being by evaluating a reform in Norway that led to online tax records for the whole population being disclosed and also found a reduction in well-being.
The rest of the paper is organized as follows: Section 2 discusses the mechanisms by which transparency laws might affect the gender wage gap. Section 3 provides an overview of public sector disclosure laws in Canada. Section 4 discusses the data. Section 5 provides evidence of the gender wage gap for all workers in Canada and for professional occupations within the educational services sector. Section 6 describes the event-study specification. Section 7 contains the empirical results and Section 8 concludes.
2 Why might pay transparency affect the gender wage gap?
One effect of the disclosure of information on gender-based salary disparities within an organization is that it may lead individuals to privately demand higher pay from their employer. The case of Lilly Ledbetter illustrates this. Ledbetter, a supervisor at Goodyear Tire, an American manufacturing company, was unaware that her male counterparts—in similar positions—were being paid more than she was. The revelation of this fact through an anonymous letter led her to file an employment discrimination lawsuit against her employer. This case went all the way to the U.S. Supreme Court and subsequently led to the Lilly Ledbetter Fair Pay Act of 2009 (Pub. L. No. 111-2, 123 Stat. 5 (2009)), which eased the burden of filing a discrimination lawsuit.Note
The Ledbetter case emphasizes individual action by employees. It is also possible that broad salary disclosure reduces the gender wage gap as a result of an institutional response to wider public attention to pay disparities. In particular, organizations may take institutional action to make salary adjustments, in part to maintain public relations. For example, Mas (2017) found that the disclosure of city manager salaries in California led to a reduction in average salaries, which has been interpreted as an institutional response to public outcry over high levels of compensation.
On the other hand, it is possible that the gender wage gap is unaffected by transparency laws. For example, if there is taste-based discrimination or if the gender wage gap is the result of monopsony, transparency may have no impact. Similarly, while learning about co-workers’ wages might reveal something about the nature of firm-specific rents, if men and women use this information in a symmetric fashion when bargaining, one should not expect to see any impact on the gender wage gap. However, if men—but not women—use this information when bargaining, it could exacerbate the gap.Note In the present study of university faculty members, both individual and institutional action can lead to redress.
3 Public sector pay disclosure laws in Canada
As noted in the introduction, the first public sector salary disclosure laws were passed in 1996 in the provinces of British Columbia, Manitoba and Ontario. In each case, the government mandated the disclosure of all university salaries exceeding a certain threshold—$50,000 in British Columbia and Manitoba and $100,000 in Ontario.
Table 1 outlines the year of implementation and disclosure thresholds of the disclosure laws and legislation in provinces that provide access to public salaries, as well as whether these governments publish these salaries online.Note These laws contain a number of noteworthy additional features.
First, most provinces with salary disclosure laws publish salary data online.Note The first time the governments of Ontario, Nova Scotia, Alberta, and Newfoundland and Labrador published salary information online, it was widely covered in the media. However, in other provinces, disclosure laws do not require the province to make these data accessible online. In British Columbia, online access to faculty salaries was given only after a freedom of information request by journalists from the Vancouver Sun—a provincial newspaper—in 2008. The newspaper maintained an online, searchable databank of public sector salaries (including faculty salaries) from 2008 to 2015.Note
| Year of implementation |
Disclosure threshold (dollars) |
Online government publication | |
|---|---|---|---|
| British Columbia | 1996 | 50,000 | no |
| Manitoba | 1996 | 50,000 | no |
| Ontario | 1996 | 100,000 | yes |
| Nova Scotia | 2012 | 100,000 | yes |
| Alberta | 2015 | 125,000 | yes |
| Newfoundland and Labrador | 2016 | 100,000 | yes |
|
Notes: There are no applicable salary disclosure laws affecting university faculty pay in Prince Edward Island, New Brunswick, Quebec or Saskatchewan. In British Columbia, the initial salary reporting threshold of $50,000 was amended to $75,000 in 2002. Alberta's threshold is adjusted to the province's Consumer Price Index. There are no pay transparency laws in Prince Edward Island, Quebec, New Brunswick or Saskatchewan that require universities to disclose non-executive salaries to the province or respond to freedom of information requests for non-anonymized faculty salaries. Source: Statistics Canada, authors' compilations. |
|||
Second, the initial reporting threshold for disclosure has remained fixed throughout time in most provinces, but has been adjusted for inflation in others. For example, several years following the adoption of legislation on government employee salary disclosure in Alberta, a separate act that applied more broadly to the public sector (including university faculty) was passed in 2012, with a threshold of $125,000 adjusted annually to the Alberta Consumer Price Index.
Lastly, in some provinces, legislation affecting salary disclosure was passed prior to the legislation cited in the table, but did not require the salaries of the university faculty being studied to be disclosed publicly. For example, before the adoption of the legislation in Ontario, the salaries of government employees earning over $40,000 were published in the Public Accounts (Ontario. Ministry of Finance 1990). However, this disclosure did not extend to university faculty and access was limited, as it required obtaining a hard copy of the Public Accounts.Note
4 Data
This study is based on an analysis of Statistics Canada’s University and College Academic Staff System (UCASS) dataset from 1970 to 2017. This is an annual national survey that collects data on full-time teaching staff at degree-granting Canadian universities and their affiliated colleges, as of October 1 of each year. The survey includes all teachers within faculties, academic staff in teaching hospitals, visiting academic staff, and research staff who have an academic rank and salary similar to teaching staff, all of whom have terms of appointment not less than twelve months. It excludes administrative and support staff, librarians, and research and teaching assistants.
UCASS is administered directly to institutions and participation is mandatory. The unit of observation in the data is the individual, but the survey unit is the institution, and information on the socioeconomic characteristics of staff—including pay—is obtained directly from payroll records. Statistics Canada works closely with institutions to maintain consistent reporting each year and to ensure that the data are comparable across institutions. A limitation of this dataset is that it was discontinued from 2011 to 2015. During this period, data were collected independently by participating institutions in association with the National Vice-Presidents Academic Council, leading to the creation of the National Faculty Data Pool (NFDP) consortium, with the goal of emulating UCASS as closely as possible for longitudinal consistency. A recent collaborative effort between Statistics Canada and the university consortium has led to the NFDP being integrated into UCASS to fill in the missing years.
The NFDP has two limitations that are important to note. First, participation in the survey was voluntary. From 2010 to 2012, the sample size decreased from approximately 35,450 workers to 27,000, and the number of institutions observed decreased from 113 to 56. The loss of institutions is proportionately larger, as the withdrawal of a university from the survey also led to the loss of all of its (smaller) satellite colleges. Second, for confidentiality reasons or ease of reporting, several institutions did not maintain consistent reporting of their employees’ personal identifiers when moving from UCASS to the NFDP in 2011 or back to UCASS in 2016. To overcome this issue, individuals were matched on observables to generate longitudinally consistent identifiers for institutions where a break was observed. This was done by matching individuals within institutions and departments based on year of birth, gender, year appointed to the institution and year of highest degree. Placebo checks for institutions and years where no break occurred indicate that the success rate exceeds 99%.
The following sample restrictions were imposed throughout this analysis. Individuals were included only if they held appointments at the rank of assistant, associate or full professor; they were not employed in the faculties of medicine or dentistry; and they were assigned to a specific department. These restrictions were put in place because there is a clearer understanding of the salary determination for the included faculties. For example, salary determination for medicine and dentistry may be affected by activities beyond research and teaching, including medical practice. The analysis was restricted to faculty members with a non-missing department, since the empirical specification below requires assigning a peer group based on department and this is not possible for those not assigned to a department.Note Lastly, the sample was restricted to institutions that were observed in the 2012 wave of the NFDP and that finalized their data with or submitted information to Statistics Canada. This restriction on institutions was in place to balance the panel around the years that the survey was discontinued.
In Table 2, descriptive statistics for the full sample used in this study and separately for men and women are presented. The sample includes 101,103 individual university employees across Canada. On balance, individuals are approximately 48 years old and one-quarter of them are women. This masks the fact that, in the 1970s, less than 15% of faculty members were women. However, this figure has climbed to about 40% in recent years and approximately 45% of new hires in the 2010s were women. In addition, about 80% of faculty members hold a doctorate and 70% belong to unionized institutions. Interestingly, women are nearly 10% more likely to be unionized than men, although this may be driven by two factors: (1) women are more likely to work at institutions represented by unions or faculty associations, and (2) the proportion of women in the industry has risen over time alongside a gradual increase in unionization from the 1970s to 1990s.
| Full sample | Men | Women | ||||
|---|---|---|---|---|---|---|
| mean | standard deviation | mean | standard deviation | mean | standard deviation | |
| Demographics | ||||||
| Age (years) | 47.5 | 9.7 | 47.7 | 9.8 | 47.1 | 9.4 |
| Female (percent) | 24.5 | 43.0 | 0.0 | 0.0 | 100.0 | 0.0 |
| Highest degree (percent) | ||||||
| Doctorate | 81.6 | 38.7 | 83.0 | 37.5 | 77.3 | 41.9 |
| Professional | 0.5 | 7.4 | 0.5 | 7.2 | 0.6 | 7.9 |
| Master’s | 14.2 | 34.9 | 13.0 | 33.7 | 18.0 | 38.4 |
| Below master’s | 3.6 | 18.6 | 3.4 | 18.2 | 4.1 | 19.8 |
| Rank (percent) | ||||||
| Assistant professor | 24.0 | 42.7 | 20.4 | 40.3 | 35.2 | 47.8 |
| Associate professor | 39.7 | 48.9 | 38.4 | 48.6 | 43.7 | 49.6 |
| Full professor | 36.3 | 48.1 | 41.2 | 49.2 | 21.1 | 40.8 |
| Other job traits (percent) | ||||||
| Unionized | 69.6 | 46.0 | 67.4 | 46.9 | 76.6 | 42.3 |
| Has responsibilities | 11.6 | 32.0 | 12.1 | 32.6 | 10.1 | 30.2 |
| Compensation | ||||||
| Salary (2017 constant dollars) | ||||||
| Full sample | 116,750 | 29,750 | 118,750 | 29,750 | 110,700 | 28,850 |
| Assistant professor | 89,350 | 19,000 | 89,200 | 19,050 | 89,600 | 18,900 |
| Associate professor | 111,900 | 21,100 | 111,350 | 20,650 | 113,350 | 22,250 |
| Full professor | 140,250 | 25,150 | 140,250 | 24,950 | 140,300 | 26,350 |
| Salary growth (percent) | ||||||
| Full sample | 2.7 | 5.6 | 2.5 | 5.6 | 3.3 | 5.5 |
| Assistant professor | 3.4 | 4.8 | 3.3 | 4.8 | 3.7 | 4.8 |
| Associate professor | 2.8 | 5.3 | 2.6 | 5.3 | 3.3 | 5.3 |
| Full professor | 2.2 | 6.1 | 2.0 | 6.0 | 3.0 | 6.6 |
|
Notes: Responsibilities are defined as appointments to senior administrative roles, including dean; assistant, associate or vice dean; director whose responsibilities and salary are equivalent to those of dean; department head or coordinator; and chairperson. To control for outliers, observations with salaries below the 0.5th percentile or above the 99.5th percentile (in 2017 constant dollars) were dropped. The currency values are rounded to the nearest $50. Number of individuals: 101,103 (full sample), 72,823 (men), 28,280 (women). Number of observations: 1,002,081 (full sample), 756,312 (men), 245,789 (women). Source: Statistics Canada, University and College Academic Staff System, 1970 to 2017. |
||||||
5 Context
Female workers in Canada earn less than their male counterparts, as is the case in most developed economies. In Chart A.1 of the Appendix, the female-to-male hourly wage ratio for full-time workers over the period of this study is documented (Baker and Drolet [2010] and Morissette, Picot and Lu [2013]). The ratio for all workers and professional occupations within the educational services sector is reported. The ratio for all workers rises from a low of just over 0.82 to almost 0.89 over this period. The ratio for education workers is more volatile because of smaller sample sizes—it begins the period at just over 0.88 and rises above 0.90, except for an abrupt decline in 2018. Throughout almost the entire period, female education professionals faced a smaller wage gap than their counterparts in the wider labour market.
While it has become commonplace to measure gender pay disparities with hourly wages in Canada, earnings are the norm in many other countries, and this study focuses on the annual earnings of the faculty members in this analysis. Using earnings to document gender differences may conflate both the differences in hours worked (e.g., part time versus full time) and the differences in hourly wages. This is less of a concern in the present context, as the sample is restricted to full-time appointments and faculty salaries in Canada are typically a fixed amount paid over 12 months.
The gender earnings gap in this sample of faculty members is reported in Chart 1. The gap is presented over time both unconditionally and conditional on controls (institution, department, year of birth and highest degree attained). The conditional gap was around 15% at the beginning of the period and has narrowed to roughly 4% to 5% in recent years. This is consistent with the findings of Warman, Woolley and Worswick (2010), who used similar data to document a narrowing in male-to-female earnings differentials between 1970 and 2001.

Data table for Chart 1
| Without controls | With controls | |
|---|---|---|
| log (salary) | ||
| 1971 | -0.14 | -0.14 |
| 1972 | -0.15 | -0.14 |
| 1973 | -0.15 | -0.14 |
| 1974 | -0.16 | -0.14 |
| 1975 | -0.15 | -0.13 |
| 1976 | -0.16 | -0.12 |
| 1977 | -0.16 | -0.12 |
| 1978 | -0.16 | -0.12 |
| 1979 | -0.15 | -0.10 |
| 1980 | -0.15 | -0.10 |
| 1981 | -0.16 | -0.10 |
| 1982 | -0.16 | -0.10 |
| 1983 | -0.16 | -0.09 |
| 1984 | -0.16 | -0.09 |
| 1985 | -0.16 | -0.09 |
| 1986 | -0.16 | -0.09 |
| 1987 | -0.17 | -0.09 |
| 1988 | -0.17 | -0.09 |
| 1989 | -0.18 | -0.09 |
| 1990 | -0.18 | -0.09 |
| 1991 | -0.17 | -0.08 |
| 1992 | -0.17 | -0.08 |
| 1993 | -0.17 | -0.08 |
| 1994 | -0.17 | -0.08 |
| 1995 | -0.17 | -0.08 |
| 1996 | -0.16 | -0.07 |
| 1997 | -0.15 | -0.07 |
| 1998 | -0.15 | -0.07 |
| 1999 | -0.14 | -0.06 |
| 2000 | -0.14 | -0.06 |
| 2001 | -0.13 | -0.06 |
| 2002 | -0.13 | -0.06 |
| 2003 | -0.12 | -0.06 |
| 2004 | -0.12 | -0.06 |
| 2005 | -0.11 | -0.05 |
| 2006 | -0.10 | -0.05 |
| 2007 | -0.10 | -0.05 |
| 2008 | -0.10 | -0.04 |
| 2009 | -0.09 | -0.04 |
| 2010 | -0.09 | -0.04 |
| 2011 | -0.09 | -0.04 |
| 2012 | -0.09 | -0.04 |
| 2013 | -0.09 | -0.03 |
| 2014 | -0.09 | -0.03 |
| 2015 | -0.08 | -0.03 |
| 2016 | -0.08 | -0.03 |
| 2017 | -0.08 | -0.03 |
|
Notes: Results are based on a regression of the log of salary on year fixed effects and their interactions with an indicator for being female. To control for outliers, observations with salaries below the 0.5th percentile or above the 99.5th percentile (in 2017 constant dollars) were dropped. The coefficients of the interaction variables are reported, where 1970 serves as the reference year, after being scaled down by the estimated unconditional gender wage gap from the coefficient for the female indicator. Control variables include institution, department, year of birth and highest degree attained. Source: Statistics Canada, University and College Academic Staff System, 1970 to 2017. |
||
A potential concern in using university sector pay is that salaries may be set according to a statutory formula; for example, they may be determined entirely on the basis of institution, department and rank. To gauge whether there is discretion in pay and scope for transparency laws to impact the gender wage gap, salaries are predicted by regressing them on the interaction of institution, department, rank, tenure and year fixed effects; age fixed effects; and highest degree obtained fixed effects. If salaries are set in a formulaic way, then there should be very little residual variance between actual salaries and predicted salaries. Chart A.2 in the Appendix shows that this is not the case, as substantial residual variation was observed for both men and women. The R-squared for both models is roughly 70%. Furthermore, the fact that the conditional gender earnings gap was roughly 7% to 8% at the time the first disclosure laws were introduced suggests that there is scope for disclosure to affect the gap.
6 Econometric specification
The Canadian setting is unique for evaluating the causal effect of transparency, as there are three separate sources of variation in transparency: province, year and baseline salary. For example, as discussed above, salary disclosure in Ontario was introduced in 1996, but only individuals with salaries above the $100,000 threshold were included.Note The baseline definition of treatment takes advantage of all of these sources of variation. Specifically, an individual is defined as treated in a given year if, during that year, they worked in a province with salary disclosure legislation in place and worked in a department where a faculty member’s salary was revealed by the disclosure policy in the year of the reformNote . The main definition of peer group consists of all faculty in the same institution and department. Results are also reported from another definition based on institution, department and rank. The two definitions of treatment are conceptually distinct: the former may capture vertical comparisons, whereas the latter is limited to horizontal comparisons (see Cullen and Perez-Truglia 2018).
To formalize the approach, consider a panel of individuals in which salary is observed for years or, for some, a subset thereof. A binary treatment variable is also observed, if has not been treated by year and if has been treated by year . In the present setting, treatment is an absorbing state and the treatment path is a sequence of zeros and ones. In this case, the treatment path is uniquely characterized by the time period of the initial treatment, which is denoted by . This is typically referred to as the “event time,” and is denoted as the “relative time.” Let be an indicator variable that takes on a value of 1 if individual is female. The following standard dynamic specification is considered:
Where leads of the treatment are included together with terms that capture the short-run effects and a single parameter to capture longer-run effects. In the present specification, and . Therefore, the model controls for an individual fixed effect and gender-specific year effects (M = male, F = female). Some specifications also control flexibly for year-by-province-by-gender fixed effects. Therefore, this controls for time-varying, province-specific shocks that might differentially affect the salaries of men and women and that are correlated with the event time. The identifying assumption is that there are no shocks correlated with the introduction of transparency laws that differentially affect the salaries of men and women within peer groups. The coefficients of interest are the parameters and . These indicate the causal effect of transparency on the gender wage gap in the short run and long run, respectively. The presence of pre-trends can also be tested for by plotting the for and examining whether .
Lastly, to quantify the magnitude of the effect and increase the precision of the estimates, the “static” or canonical specification is adapted by setting :
Where is the causal effect of transparency on average wages for male faculty members and is the causal effect for female faculty members. Compared with the dynamic model, this specification imposes no pre-trends and assumes constant treatment effects for all . The standard errors are clustered at the level of institution and department, as this is the level at which the treatment is defined.
7 Empirical results
This section begins by presenting a series of non-parametric event-study plots to visually examine the effects of transparency on the gender wage gap. Next, it turns to regression models to quantify the precise impact.
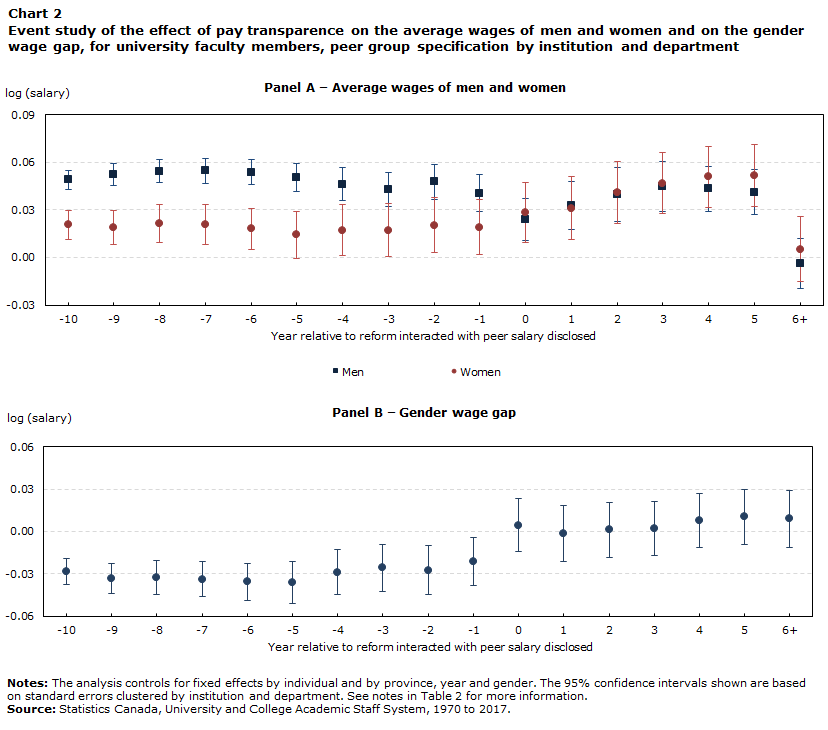
Chart 2 contains the main event study showing the impact of pay disclosure laws on the gender wage gap.Note Panel A splits the sample into male and female faculty members. The red circles represent women’s log salaries, and the blue squares represent men’s log salaries. The blue squares correspond to while the red circles correspond to . Year 0 is the year of the reform. The chart shows that, prior to the reform, the blue squares were above the red circles. However, after the reform, the reverse is true, indicating that the disclosure laws reduced the gender wage gap. The chart shows that men’s salaries fell on average, while women’s salaries increased. This can also be seen in Panel B, which graphs the gender wage gap . In terms of pre-trends, while a slight increase is seen in the gender wage gap in the years prior to the reforms, the visual evidence indicates a clear and noticeable jump around the event year, which provides some degree of confidence that it is not just differential pre-trends that are being detected. The chart also shows that salaries for both men and women tend to drop in the long run (e.g., and are quite low relative to their short-run effects).
Data table for Chart 2
| Year relative to reform interacted with peer salary disclosed | Panel A — Average wages of men and women | Panel B — Gender gap | |||||||
|---|---|---|---|---|---|---|---|---|---|
| Men | 95% confidence interval | Women | 95% confidence interval | Gender wage gap | 95% confidence interval | ||||
| Upper bound | Lower bound | Upper bound | Lower bound | Upper bound | Lower bound | ||||
| log (salary) | |||||||||
| -10 | 0.049 | 0.055 | 0.043 | 0.020 | 0.030 | 0.011 | -0.028 | -0.019 | -0.038 |
| -9 | 0.052 | 0.059 | 0.045 | 0.019 | 0.029 | 0.008 | -0.033 | -0.023 | -0.044 |
| -8 | 0.054 | 0.062 | 0.047 | 0.022 | 0.034 | 0.010 | -0.033 | -0.021 | -0.045 |
| -7 | 0.055 | 0.063 | 0.047 | 0.021 | 0.033 | 0.008 | -0.034 | -0.022 | -0.046 |
| -6 | 0.054 | 0.061 | 0.046 | 0.018 | 0.031 | 0.005 | -0.036 | -0.023 | -0.049 |
| -5 | 0.050 | 0.059 | 0.042 | 0.014 | 0.029 | -0.001 | -0.036 | -0.021 | -0.051 |
| -4 | 0.046 | 0.056 | 0.036 | 0.017 | 0.033 | 0.001 | -0.029 | -0.013 | -0.045 |
| -3 | 0.043 | 0.054 | 0.032 | 0.017 | 0.034 | 0.001 | -0.026 | -0.009 | -0.042 |
| -2 | 0.048 | 0.059 | 0.037 | 0.020 | 0.038 | 0.003 | -0.027 | -0.010 | -0.045 |
| -1 | 0.040 | 0.052 | 0.029 | 0.019 | 0.036 | 0.002 | -0.021 | -0.004 | -0.038 |
| 0 | 0.024 | 0.037 | 0.011 | 0.028 | 0.047 | 0.010 | 0.004 | 0.023 | -0.014 |
| 1 | 0.033 | 0.048 | 0.017 | 0.031 | 0.051 | 0.011 | -0.002 | 0.018 | -0.021 |
| 2 | 0.039 | 0.056 | 0.023 | 0.041 | 0.060 | 0.021 | 0.001 | 0.021 | -0.018 |
| 3 | 0.045 | 0.061 | 0.029 | 0.047 | 0.066 | 0.028 | 0.002 | 0.021 | -0.017 |
| 4 | 0.043 | 0.057 | 0.029 | 0.051 | 0.070 | 0.032 | 0.008 | 0.027 | -0.011 |
| 5 | 0.041 | 0.056 | 0.027 | 0.052 | 0.071 | 0.032 | 0.010 | 0.030 | -0.009 |
| 6+ | -0.004 | 0.012 | -0.019 | 0.005 | 0.026 | -0.015 | 0.009 | 0.029 | -0.011 |
|
Notes: The analysis controls for fixed effects by individual and by province, year and gender. The 95% confidence intervals shown are based on standard errors clustered by institution and department. See notes in Table 2 for more information. Source: Statistics Canada, University and College Academic Staff System, 1970 to 2017. |
|||||||||
The regression results are presented in Table 3. Panel A reports the results for the full sample of both men and women. The first and third columns include individual fixed effects and province-by-year fixed effects, while the second and fourth columns control additionally for the number of years since appointment to the institution, the number of years since the highest degree was obtained and an indicator for having senior administrative responsibilities. The first and second columns consider the peer group to be the institution and department, while the third and fourth columns consider the peer group to be the institution, department and rank.Note Appendix Table A.1 reproduces Table 3 clustering on the institution.
| Peer group specification | ||||
|---|---|---|---|---|
| Institution and department | Institution, department and rank | |||
| coefficient estimates | ||||
| Panel A: Effect on the average wage | ||||
| Treated | -0.014Note ** | -0.015Note ** | -0.025Note *** | -0.026Note *** |
| statistics | ||||
| R-squared | 0.923 | 0.926 | 0.923 | 0.926 |
| Number of observations | 982,543 | 948,691 | 982,543 | 948,691 |
| Number of clusters | 1,262 | 1,239 | 1,262 | 1,239 |
| indicators | ||||
| Fixed effects | ||||
| Individual | yes | yes | yes | yes |
| Province–year | yes | yes | yes | yes |
| Additional controls | no | yes | no | yes |
| coefficient estimates | ||||
| Panel B: Effect on the gender wage gap | ||||
| Treated | -0.014Note ** | -0.017Note ** | -0.025Note *** | -0.026Note *** |
| Female-treated interaction | 0.022Note ** | 0.023Note *** | 0.023Note *** | 0.024Note *** |
| statistics | ||||
| R-squared | 0.924 | 0.927 | 0.925 | 0.927 |
| Number of observations | 982,543 | 948,691 | 982,543 | 948,691 |
| Number of clusters | 1,262 | 1,239 | 1,262 | 1,239 |
| indicators | ||||
| Fixed effects | ||||
| Individual | yes | yes | yes | yes |
| Province–year | yes | yes | yes | yes |
| Additional controls | no | yes | no | yes |
Source: Statistics Canada, University and College Academic Staff System, 1970 to 2017. |
||||
Across all of these specifications, transparency laws were consistently found to reduce average salaries. All estimates are statistically significant at the 1% level.Note The point estimates range between 1.4 and 1.5 percentage points in the institution and department peer group specification and between 2.5 and 2.6 percentage points in the institution, department and rank peer group specification, where conditioning on the additional controls in the second and fourth columns increases the magnitude of the estimates by 0.1 percentage point.
Panel B presents the estimates for the gender wage gap, breaking down the impact of the treatment by gender. In all specifications, year-by-province-by-gender fixed effects were controlled for. Across the specifications, the estimates indicate a statistically significant reduction in the gender wage gap by 2.2 to 2.4 percentage points. Relative to a mean gender wage gap of 7% to 8% at the time of the initial reforms in 1996 (see Chart 1), this represents an effect of roughly 30%. In the first and second columns, the narrowing of the gender wage gap stems from both a decline in the growth of men’s wages and an increase in women’s wages, consistent with the evidence in the event study in Chart 2. However, in the third and fourth columns, the change in the gap stems mostly from changes in men’s wages.
The fact that the growth in men’s salaries fell in the treatment group relative to the control group suggests that there may have been, in part, an institutional response to disclosure. Unions are an important institutional mediator in the Canadian higher education sector, as a large share of faculty members are unionized (see Table 2). Unions may play an important role in the response to disclosure, since universities must participate in—and respond to—the formal grievance procedures of unionized workplaces.Note In contrast, the request for higher pay in a non-unionized environment is more likely to occur through an informal meeting with a department chair, which may be difficult without an external competing offer from a peer institution. The existence of a formal grievance procedure might particularly benefit women in an environment where the majority of chairs and senior faculty members are men.
Table 4 presents estimates of the effect of the treatment separately based on whether faculty members were unionized or non-unionized that year. In Panel B, the estimates by gender reveal that the primary effect of the law on the gender wage gap was observed in unionized workplaces. Women’s wages increased by roughly 1 percentage point in response to the introduction of a disclosure law. In non-unionized universities, the change in women’s wages was close to zero. While it is not possible to be certain that this is the result of the union mechanisms discussed above, this does suggest that the efficacy of the transparency laws turns on something that is different across—rather than common among—unionized and non-unionized universities.
| Peer group specification | ||||
|---|---|---|---|---|
| Institution and department | Institution, department and rank | |||
| Unionized | Not unionized | Unionized | Not unionized | |
| coefficient estimates | ||||
| Panel A: Effect on the average wage | ||||
| Treated | -0.009 | -0.008 | -0.017Note ** | -0.030Note *** |
| statistics | ||||
| R-squared | 0.926 | 0.936 | 0.926 | 0.936 |
| Number of observations | 686,692 | 294,003 | 686,692 | 294,003 |
| Number of clusters | 943 | 781 | 943 | 781 |
| indicators | ||||
| Fixed effects | ||||
| Individual | yes | yes | yes | yes |
| Province–year | yes | yes | yes | yes |
| coefficient estimates | ||||
| Panel B: Effect on the gender wage gap | ||||
| Treated | -0.013Table 4 Note † | -0.008 | -0.021Note *** | -0.027Note ** |
| Female-treated interaction | 0.025Note ** | 0.013 | 0.032Note *** | 0.007 |
| statistics | ||||
| R-squared | 0.928 | 0.938 | 0.928 | 0.938 |
| Number of observations | 686,692 | 293,992 | 686,692 | 293,992 |
| Number of clusters | 943 | 781 | 943 | 781 |
| indicators | ||||
| Fixed effects | ||||
| Individual | yes | yes | yes | yes |
| Province–year | yes | yes | yes | yes |
Source: Statistics Canada, University and College Academic Staff System, 1970 to 2017. |
||||
Lastly, a number of the universities in the sample undertook campus-wide studies of gender differences in compensation over the sample period. While there is no direct evidence that these studies were in response to transparency laws, they appear to have all taken place within provinces after a law has come into effect. The analysis in these studies typically involves the use of regression analysis to estimate the gender wage gap, controlling for factors such as field and experience (years since the highest degree and years at the institution). In many of these cases, the studies revealed evidence of a gender wage gap, which has led the university to make a one-time across-the-board adjustment to female faculty members’ salaries. In other cases, a pool of money has been established to grant anomalies to faculty members who fall below the regression line. A list of these initiatives, their relevant dates, and the amount and timing of any resulting salary adjustments is presented in Table A.2 of the Appendix. These studies may be a mechanism by which disclosure affected compensation at the institutional level.
8 Conclusion
This paper examines the effect of transparency laws on the gender wage gap. While it focuses on public sector salaries, the ongoing efforts of governments around the world to increase the transparency of wages in the private sector may allow researchers to determine whether the effects documented hold in other sectors of the economy.
There are several directions for future research. First, the estimates are informative about the partial equilibrium impacts of transparency. It is possible that transparency laws have spillover effects that lead to broader changes in social norms and, as a result, the general equilibrium effects of these laws may be different. Second, transparency laws are complex and varied by nature. There is a difference between active disclosure—whereby salaries are easily accessible online—and passive disclosure—whereby salaries are available only upon request. These two forms of disclosure may not have the same equilibrium effects on salaries. For example, salaries that are accessible online may garner significantly more media attention and public pressure for adjustment. Additionally, the lower cost of access means that they are more likely to be used in bargaining with employers.
Appendix

Data table for Chart A1
| All workers | Professional occupations in education | |
|---|---|---|
| log (salary) | ||
| 1997 | 82.95 | 88.01 |
| 1998 | 82.65 | 88.75 |
| 1999 | 82.57 | 89.18 |
| 2000 | 82.04 | 89.15 |
| 2001 | 82.16 | 88.41 |
| 2002 | 83.36 | 89.29 |
| 2003 | 84.05 | 89.31 |
| 2004 | 84.94 | 88.89 |
| 2005 | 85.54 | 92.41 |
| 2006 | 85.44 | 89.00 |
| 2007 | 85.43 | 90.03 |
| 2008 | 85.38 | 90.84 |
| 2009 | 86.57 | 91.93 |
| 2010 | 87.12 | 94.77 |
| 2011 | 87.89 | 91.98 |
| 2012 | 87.79 | 93.11 |
| 2013 | 87.80 | 92.47 |
| 2014 | 88.01 | 91.76 |
| 2015 | 87.84 | 92.54 |
| 2016 | 88.35 | 91.42 |
| 2017 | 88.52 | 90.57 |
| 2018 | 88.62 | 87.67 |
|
Note: The reported statistics are the ratios of average hourly wages of women to average hourly wages of men among full-time workers in the indicated industries. Source: Statistics Canada, authors' compilation from table 14-10-0307-01. |
||

Data table for Chart A2
| Log (salary) residual bin | Men | Women |
|---|---|---|
| percent | ||
| -0.50 | 0.0021 | 0.0012 |
| -0.48 | 0.0050 | 0.0012 |
| -0.46 | 0.0050 | 0.0012 |
| -0.44 | 0.0052 | 0.0050 |
| -0.42 | 0.0057 | 0.0062 |
| -0.40 | 0.0068 | 0.0112 |
| -0.38 | 0.0125 | 0.0100 |
| -0.36 | 0.0152 | 0.0175 |
| -0.34 | 0.0201 | 0.0175 |
| -0.32 | 0.0300 | 0.0287 |
| -0.30 | 0.0457 | 0.0237 |
| -0.28 | 0.0742 | 0.0549 |
| -0.26 | 0.1191 | 0.0761 |
| -0.24 | 0.1654 | 0.1309 |
| -0.22 | 0.2822 | 0.1821 |
| -0.20 | 0.4321 | 0.2843 |
| -0.18 | 0.6788 | 0.4127 |
| -0.16 | 1.0364 | 0.7183 |
| -0.14 | 1.6290 | 1.1422 |
| -0.12 | 2.4643 | 2.0550 |
| -0.10 | 3.7497 | 3.2721 |
| -0.08 | 5.5005 | 5.3819 |
| -0.06 | 8.0836 | 7.8497 |
| -0.04 | 11.1890 | 11.5969 |
| -0.02 | 14.7846 | 17.1584 |
| 0.00 | 15.0135 | 17.3878 |
| 0.02 | 11.0250 | 11.0682 |
| 0.04 | 7.6557 | 7.3322 |
| 0.06 | 5.1522 | 4.9941 |
| 0.08 | 3.5287 | 3.1511 |
| 0.10 | 2.3757 | 2.0637 |
| 0.12 | 1.5692 | 1.2370 |
| 0.14 | 1.0396 | 0.7706 |
| 0.16 | 0.7099 | 0.5063 |
| 0.18 | 0.5097 | 0.3167 |
| 0.20 | 0.3470 | 0.2506 |
| 0.22 | 0.2210 | 0.1446 |
| 0.24 | 0.1711 | 0.1122 |
| 0.26 | 0.1139 | 0.0873 |
| 0.28 | 0.0799 | 0.0337 |
| 0.30 | 0.0525 | 0.0262 |
| 0.32 | 0.0306 | 0.0224 |
| 0.34 | 0.0225 | 0.0137 |
| 0.36 | 0.0144 | 0.0112 |
| 0.38 | 0.0073 | 0.0100 |
| 0.40 | 0.0068 | 0.0087 |
| 0.42 | 0.0029 | 0.0062 |
| 0.44 | 0.0031 | 0.0050 |
| 0.46 | 0.0034 | 0.0012 |
| 0.48 | 0.0024 | 0.0000 |
| 0.50 | 0.0000 | 0.0000 |
|
Notes: The distributions are plotted using the residuals from regressions of the log of salary on fixed effects (FEs) for the interaction of institution, department, rank, years since appointment to the institution and year; and FEs for year of birth and highest educational attainment. Observations that are perfectly predicted by the FEs of the interaction variable are dropped. The analysis is carried out separately for men and women; the number of observations reported reflects the number after dropping all uniquely identified observations. R-squared: 0.914 (men), 0.931 (women). Observations: 382,812 (men), 80,202 (women). Source: Statistics Canada, University and College Academic Staff System, 1970 to 2017. |
||
| Peer group specification | ||||
|---|---|---|---|---|
| Institution and department | Institution, department and rank | |||
| coefficient estimates | ||||
| Panel A: Effect on the average wage | ||||
| Treated | -0.014 | -0.015 | -0.025Note ** | -0.026Note ** |
| statistics | ||||
| R-squared | 0.923 | 0.926 | 0.923 | 0.926 |
| Number of observations | 982,543 | 948,691 | 982,543 | 948,691 |
| Number of clusters | 56 | 55 | 56 | 55 |
| indicators | ||||
| Fixed effects | ||||
| Individual | yes | yes | yes | yes |
| Province–year | yes | yes | yes | yes |
| Additional controls | no | yes | no | yes |
| coefficient estimates | ||||
| Panel B: Effect on the gender wage gap | ||||
| Treated | -0.014 | -0.017Table A.1 Note † | -0.025Note ** | -0.026Note ** |
| Female-treated interaction | 0.022Note ** | 0.023Note ** | 0.023Note ** | 0.024Note *** |
| statistics | ||||
| R-squared | 0.924 | 0.927 | 0.925 | 0.927 |
| Number of observations | 982,543 | 948,691 | 982,543 | 948,691 |
| Number of clusters | 56 | 55 | 56 | 55 |
| indicators | ||||
| Fixed effects | ||||
| Individual | yes | yes | yes | yes |
| Province–year | yes | yes | yes | yes |
| Additional controls | no | yes | no | yes |
Source: Statistics Canada, University and College Academic Staff System, 1970 to 2017. |
||||
| University | Year of study | Date of pay adjustment | Size of adjustment |
|---|---|---|---|
| Western University | 2005, 2009 | Note ...: not applicable | Note ...: not applicable |
| University of British Columbia | 2010 | February 28, 2013 | 2.00% |
| University of Victoria | 2014 | Unknown | Unknown |
| McMaster University | 2015 | July 1, 2015 | $3,515 |
| Simon Fraser University | 2015 | September 3, 2016 | 1.70% |
| University of Waterloo | 2016 | September 1, 2016 | $2,905 |
| Wilfrid Laurier University | 2017 | June 22, 2017 | 3.00%; 3.90% |
| Guelph University | 2018 | June 1, 2018 | $2,050 |
| University of Toronto | 2019 | July 1, 2019 | 1.30% |
|
... not applicable Notes: At Simon Fraser University, a fund of $4.0 million was established to provide retroactive compensation. The adjustment at the University of British Columbia was retroactive to July 1, 2010. At Western University, a below-the-line rather than across-the-board or group award was implemented; the salary adjustments were administered by the university’s salary anomaly committee. The adjustment at Wilfred Laurier University was 3.0% for associate professors, and for full professors it was 3.9%; those adjustments were retroactive to July 1, 2016. Source: Statistics Canada, authors' compilations. |
|||
References
Baker, M., and M. Drolet. 2010. “A new view of the male/female pay gap.” Canadian Public Policy 36 (4): 429–464.
Bennedsen, M., E. Simintzi, M. Tsoutsoura, and D. Wolfenzon. 2019. Do Firms Respond to Gender Pay Gap Transparency? NBER Working Paper Series, no. 25435. Cambridge, Massachusetts: National Bureau of Economic Research.
Boyd, L., G. Creese, D. Rubuliak, M. Trowell, and C. Young. 2012. Report of the Gender Pay Equity Recommendation Committee. UBC Faculty Association. Vancouver: University of British Columbia.
Breza, E., S. Kaur, and Y. Shamdasani. 2018. “The morale effects of pay inequality.” The Quarterly Journal of Economics 133 (2): 611–663.
Card, D., A. Mas, E. Moretti, and E. Saez. 2012. “Inequality at work: The effect of peer salaries on job satisfaction.” American Economic Review 102 (6): 2981–3003.
Council of Canadian Academies. 2012. Strengthening Canada’s Research Capacity: The Gender Dimension. Expert Panel on Women in University Research. Ottawa: Council of Canadian Academies.
Cullen, Z., and R. Perez-Truglia. 2018. How Much Does Your Boss Make? The Effects of Salary Comparisons. NBER Working Paper Series, no. 24841. Cambridge, Massachusetts: National Bureau of Economic Research.
Goldin, C. 2014. “A grand gender convergence: Its last chapter.” American Economic Review 104 (4): 1091–1119.
Gomez, R., and S. Wald. 2010. “When public-sector salaries become public knowledge: Academic salaries and Ontario’s Public Sector Salary Disclosure Act.” Canadian Public Administration 53 (1): 107–126.
Kim, M. 2015. “Pay secrecy and the gender wage gap in the United States.” Industrial Relations 54 (4): 648–667.
Leibbrandt, A., and J. List. 2014. “Do women avoid salary negotiations? Evidence from a large-scale natural field experiment.” Management Science 61 (9): 2013–2280.
Mas, A. 2017. “Does transparency lead to pay compression?” Journal of Political Economy 125 (5): 1683–1721.
Morissette, R, G. Picot, and Y. Lu. 2013. The Evolution of Canadian Wages over the Last Three Decades. Analytical Studies Branch Research Paper Series, no. 347. Statistics Canada Catalogue no. 11F0019M. Ottawa: Statistics Canada.
Nova Scotia. 1997. Supplement to the Public Accounts of the Province of Nova Scotia for the fiscal year ended March 31, 1996. Halifax, Nova Scotia. https://notices.novascotia.ca /files/public-accounts/1996/1996-volume-3.pdf.
Ontario. Ministry of Finance. 1990. Public Accounts of Ontario, 1994-95, Vol. 3: Details of expenditure. Toronto: Ministry of Finance.
Perez-Truglia, R. 2019. The Effects of Income Transparency on Well-Being: Evidence from a Natural Experiment. NBER Working Paper Series, no. 25622. Cambridge, Massachusetts: National Bureau of Economic Research.
Warman, C., F. Woolley, and C. Worswick. 2010. “The evolution of male-female earnings differentials in Canadian universities, 1970–2001.” Canadian Journal of Economics 43 (1): 347–372.
- Date modified: