
Analytical Studies Branch Research Paper Series
A Gender Analysis of the Occupational Pathways of STEM Graduates in Canada
by Kristyn Frank
Acknowledgements
This study was funded by the Department for Women and Gender Equality. The author appreciates the constructive comments provided by reviewers from the Department for Women and Gender Equality and colleagues at Statistics Canada.
Abstract
Occupations related to science, technology, engineering and mathematics (STEM) are generally associated with high pay and contribute to the development of new technology. Continued growth is expected for STEM occupations, which would provide STEM-educated workers with additional labour market opportunities. However, less is known about the extent to which STEM graduates enter into and remain in STEM occupations in Canada. This study uses data from the 2006 and 2016 longitudinal census files to examine the occupational pathways of women and men with postsecondary credentials in STEM fields. Generally, male STEM graduates were more likely than female STEM graduates to be employed in a STEM occupation. The occupational pathways of male and female STEM graduates also differed. Among STEM graduates who were employed in a STEM occupation in 2006, women were more likely than men to have moved to a non-STEM occupation by 2016. Younger STEM graduates were more likely to exit a STEM occupation than older graduates, and men and women with college-level STEM credentials were more likely to leave a STEM occupation than their counterparts with a bachelor’s degree. Some differences in the occupational mobility of men and women with STEM credentials were associated with their field of study. For example, men who studied mathematics or computer and information sciences were less likely than their counterparts who studied engineering or engineering technology to exit a STEM occupation between 2006 and 2016. However, there was no statistically significant difference in the likelihood of leaving a STEM occupation among women who had studied in these two fields. Lastly, the wage growth of male and female STEM graduates who persisted in a STEM occupation between 2006 and 2016 was not significantly different from the wage growth of their counterparts who had moved from a STEM occupation to a non-STEM occupation.
Executive summary
Occupations related to science, technology, engineering and mathematics (STEM) are often characterized as high-quality, high-paying jobs. Continued growth is expected for STEM occupations, which suggests that there will be greater demand for STEM-educated workers in the future. Increasing women’s participation in STEM fields has been identified as one way of meeting the growing demand for STEM-trained workers. However, despite increases in women’s educational attainment and participation in scientific occupations over the past several decades, women remain underrepresented in STEM fields.
Much of the research on women in STEM fields concentrates on “leaks” in the STEM pipeline throughout their educational training. However, less is known about the loss of women from STEM after they obtain STEM credentials and how this compares with their male peers.
This study uses data from the 2006 and 2016 longitudinal census files, which integrate individuals across census years. A gender-based approach is employed to investigate the occupational pathways of women and men with postsecondary credentials in STEM fields who were aged 25 to 54 in 2006. This study addresses the following research questions:
- What are the occupational pathways of STEM graduates in Canada and do the pathways of men and women differ?
- What sociodemographic and educational characteristics are associated with the likelihood of a STEM graduate exiting a STEM occupation? Are there differences between men and women?
- Do the earnings of STEM graduates who persist in STEM occupations differ from their counterparts who move to non-STEM occupations? Does this differ between men and women?
Generally, male STEM graduates were more likely than female STEM graduates to be employed in a STEM occupation. While over 4 in 10 men in the longitudinal sample were employed in STEM occupations in 2006, less than 3 in 10 women worked in a STEM occupation. Previous research has found that engineering graduates are more likely than life science graduates to work in STEM occupations (Statistics Canada 2017a). Over one-third of women in the longitudinal sample had studied biological, general or integrated sciences, while more than half of men had studied engineering or engineering technology. Therefore, it is likely that the differences observed in men’s and women’s likelihood of working in a STEM occupation is partly attributable to differences in their specific field of study choices.
Furthermore, the occupational mobility of male and female STEM graduates differed—women with STEM credentials were less likely than their male counterparts to persist in STEM occupations between 2006 and 2016. About one-quarter (26.4%) of male STEM graduates who were employed in a STEM occupation in 2006 had moved to a non-STEM occupation by 2016, compared with more than one-third of women (34.7%). Some of the top non-STEM occupations to which STEM graduates moved were similar for both men and women, such as specialized middle management occupations and professional occupations in business and finance.
Generally, most sociodemographic characteristics were not associated with the likelihood of men or women exiting STEM occupations, but with one exception—younger graduates were more likely to exit these fields than older graduates. Furthermore, STEM graduates with college-level credentials were more likely to exit a STEM occupation than their counterparts with a bachelor’s degree.
Graduates who studied engineering and engineering technology were less likely to leave STEM occupations between 2006 and 2016 than graduates of physical or chemical sciences or biological, general or integrated sciences. This was observed for both men and women. However, there were differences in the occupational mobility of men and women who studied mathematics or computer and information sciences. While men who studied mathematics or computer and information sciences were less likely than their counterparts who studied engineering or engineering technology to leave a STEM occupation between 2006 and 2016, there was no statistically significant difference between women who had studied these two fields.
Lastly, the results indicated that the wage growth of women and men who persisted in a STEM occupation between 2006 and 2016 was not significantly different from the wage growth of their counterparts who had moved from a STEM occupation to a non-STEM occupation between these years. Therefore, while STEM occupations may be higher paying than non-STEM occupations on average, STEM graduates who exited a STEM occupation did not experience significantly lower wage growth than their peers who persisted in a STEM occupation.
1 Introduction
Occupations related to science, technology, engineering and mathematics (STEM) are often characterized as high-quality, high-paying jobs that foster innovation and the development of new technology (Landivar 2013). Continued growth is expected for STEM occupations, which suggests that there will be an increase in labour market opportunities for STEM-educated workers (Diekman, Weisgram and Belanger 2015). However, the extent to which STEM graduates enter into and remain in STEM occupations in Canada is largely unknown. Moreover, if the demand for STEM-educated workers increases, there will also be a rise in concerns about the retention of these workers in STEM occupations.
Increasing women’s participation in STEM fields is one way that the growing demand for STEM-educated workers can be met. Greater representation of women in STEM has also been identified as a way to make Canada more competitive in the global economy and fully take advantage of women’s skills (Council of Canadian Academies 2015), as well as address the gender pay gap, as these occupations tend to be well paid. However, despite increases in women’s educational attainment and participation in scientific occupations over the past several decades (Dionne-Simard, Galarneau and LaRochelle-Côté 2016; Turcotte 2011), women remain underrepresented in STEM fields.
Previous research examining gender differences in STEM is largely focused on the extent to which women obtain educational credentials in STEM fields of study (e.g., Hango 2013; Ferguson 2016) and issues of attrition throughout their training (e.g., Chen 2015; George-Jackson 2011; Maltese and Tai 2011; Miller and Wai 2015; Wall 2019). Although some researchers note that “leaks” in the STEM pipeline can occur at different stages of women’s lives, less is known about the loss of women from STEM occupations after they obtain STEM credentials (Blickenstaff 2005; Cech and Blair-Loy 2019; Dasgupta and Stout 2014).
These issues can be addressed with longitudinal data, which make it possible to analyze individuals over time. While some longitudinal analyses have compared the earnings of men and women in STEM and non-STEM occupations (Xu 2015), information about the occupational pathways of STEM graduates is lacking. This is particularly true in the Canadian context, where few researchers have examined the occupational mobility of women with STEM credentials and how their pathways compare with those of men.
This study used data from the longitudinal census files to examine the occupational pathways of men and women with STEM credentials between 2006 and 2016 who were aged 25 to 54 in 2006. Sex-disaggregated statistics were used in a gender-based approach to analyze the occupational stability or mobility of STEM graduates. The following research questions were addressed:
- What proportion of STEM graduates worked in STEM occupations or non-STEM occupations or were not in the labour force in 2006 and 2016? Was there a gap in the proportion of women and men who worked in STEM occupations in 2006 and, if so, did that gap increase or decrease between 2006 and 2016?
- Among STEM graduates who were employed in 2006, were certain sociodemographic or educational characteristics associated with a greater likelihood of working in a STEM occupation?
- What were the occupational pathways of STEM graduates who were employed in both 2006 and 2016 (i.e., persisted in a STEM occupation, exited a STEM occupation, entered a STEM occupation or did not work in a STEM occupation in either year)? Did the occupational pathways of men and women vary?
- Among STEM graduates who were employed in a STEM occupation in 2006, what proportion moved to a non-STEM occupation by 2016? Were certain sociodemographic or educational characteristics associated with exiting a STEM occupation or persisting in a STEM occupation?
- Among STEM graduates who exited a STEM occupation between 2006 and 2016, what were the top STEM occupations that they left and what were the top non-STEM occupations to which they moved?
- Accounting for sociodemographic and educational differences, was the wage growth of STEM graduates who persisted in STEM occupations between 2006 and 2016 greater than that of their counterparts who moved to non-STEM occupations?
This paper is organized as follows. Section 2 provides an overview of the previous research on STEM graduates and workers. The data and measures are reviewed in Section 3. The study results are presented in Section 4, and Section 5 concludes with a discussion of the findings.
2 The representation of women and men in STEM fields
Although women now account for the majority of university graduates, they are less likely than men to hold a degree in a STEM field of study (Ferguson 2016).Note According to the 2016 Census, about one-quarter (24.8%) of bachelor’s degree holders between the ages of 25 and 54 had studied in a STEM program. Over one-third of men (37.5%) with a bachelor’s degree had studied in a STEM field, compared to 15.3% of women with a bachelor’s degree. Similar results were found among college graduates: 3 in 10 men (30.0%) had studied in a STEM field, while less than 1 in 10 (6.7%) women had studied in a STEM field.Note
Several explanations for women’s lower likelihood of selecting a STEM field of study or persisting in it have been advanced, including cultural pressures related to stereotypical gender roles (e.g., parental expectations and peer norms), a lack of self-confidence in STEM-related subjects, a lack of female role models, and preferences and interests (Blickenstaff 2005; Dasgupta and Stout 2014; White and Massiha 2016).
The 2016 Census data also indicate that the specific STEM fields of study differed for men and women. While over half of men with a STEM bachelor’s degree studied engineering or engineering technology (52.2%), only one-quarter of women with a STEM degree had studied in this field (25.3%). The majority of women (54.1%) who had a bachelor’s degree in a STEM field had studied in science or science technology programs. The difference in the proportion of men and women with a STEM degree who had studied mathematics or computer and information sciences was less pronounced (23.8% of men and 20.6% of women).Note
The differences in choice of STEM field of study among men and women may be associated with their likelihood of working in a STEM occupation. Canadian research has shown that among young STEM graduates (aged 25 to 34), men were more likely than women to work in STEM occupations (Statistics Canada 2017a). This was partly attributable to STEM graduates’ specific field of study. For example, engineering graduates were more likely than biological science graduates to work in a STEM occupation. Previous research also indicates that young engineering graduates were largely concentrated in engineering occupations, while physical and life science graduates tended to work across a wider range of occupations, many of which were non-STEM occupationsNote (Frenette and Frank 2017). Therefore, since a higher proportion of women with STEM credentials studied life sciences than men (and, conversely, a higher proportion of male STEM graduates studied engineering than female STEM graduates), the likelihood of working in a STEM occupation is expected to differ between women and men.
Increasing female representation in high-paying occupations has been identified as a way to reduce the gender pay gap (Lemieux and Riddell 2015). Considering that STEM occupations are generally high paying (Xu 2015), gender differences in the likelihood of STEM graduates working in a STEM occupation may have an impact on women’s economic well-being. However, previous research has found that the positions held by women in some STEM fields are lower paying than the ones held by their male counterparts (Broyles 2009). Therefore, while increased female representation in STEM occupations may improve women’s overall economic standing, they may still encounter gender pay differences within these occupations. Furthermore, women who are among the top 1% of earners in Canada were primarily concentrated in health occupations rather than STEM occupations (Richards 2019), indicating that women with STEM credentials may also prosper in non-STEM occupations.
Individuals who work in jobs that are closely related to their field of study have been found to have better career outcomes than those who do not (Xu 2013). Recent Canadian research concluded that over half of young graduates with a bachelor’s degree in a STEM field worked in a STEM occupation in 2016 (Statistics Canada 2017b).Note This was primarily driven by men, who tend to select fields of study associated with a greater likelihood of working in STEM occupations than women, as discussed above. However, employment in a non-STEM occupation is not necessarily an indication that STEM graduates encountered difficulties in obtaining employment in a STEM occupation. The skills developed within STEM programs can be applied to a range of occupations, which gives STEM graduates many labour market options (Council of Canadian Academies 2015). Additionally, some STEM graduates may work in management-level positions in non-STEM occupations or prefer non-STEM jobs.
Researchers and policy makers have raised concerns about the persistence of women in STEM careers, suggesting that women’s employment in STEM occupations is not static over time (Glass et al. 2013; Mavriplis et al. 2010; Mortillaro 2018). Glass et al. (2013) found that women in STEM occupations moved to non-STEM occupations at high rates and generally did not return after leaving. Studies analyzing the employment interruptions of women in STEM occupations found that barriers arose for those who sought to return to STEM occupations later in life. For example, Dasgupta and Stout (2014, 26) noted that the career gaps of women seeking to re-enter STEM occupations may be deemed problematic by potential employers who believe that their STEM-related skills have become “rusty” or outdated. Furthermore, a loss of professional networks may hinder women from returning to STEM careers after time away. However, both women and men may face similar challenges after leaving a STEM occupation.
A report by Engineers Canada and Geoscientists Canada (2016) found that difficulties in retaining workers in STEM fields were often related to career progression obstacles following maternity or parental leaves of absence. However, women are more likely to experience career interruptions because of parenthood and often cite different reasons for leaving their fields than men, including family obligations, a lack of mentoring or guidance, a lack of flexible work hours, and the perception that science- and engineering-oriented workplaces are “unfriendly to women” (Blickenstaff 2005; Dasgupta and Stout 2014; Mavriplis et al. 2010; Preston 2004, 30). Researchers in the United States found that 42% of women left full-time STEM occupations within three years of having their first child, compared with 15% of new fathers (Cech and Blair-Loy 2019). The study also found that both new mothers and new fathers were more likely to move out of STEM occupations than their childless peers, and most did not move back into these occupations when their children reached school age. Additionally, the attrition of new mothers and fathers was not found to be driven by a specific STEM field, suggesting that this “may be a feature of STEM more broadly” (Cech and Blair-Loy 2019, 4).
3 Data and measures
This study uses the 2006 and 2016 longitudinal census files, which link individuals across the two census years. For this study, only women and men who responded to both the 2006 and 2016 census long-form questionnaires were included in the sample.Note As a result, there could be differences between this sample and the general population. To minimize concerns about this limitation, survey weights from the 2006 Census were applied. Descriptive analyses were also conducted to compare key characteristics of the weighted longitudinal sample with the weighted 2006 Census sample. Across most characteristics, the two samples differed by less than 1 percentage point. In particular, differences between the samples were narrow for STEM fields of study, education level, visible minority status, Aboriginal identity and employment in a STEM occupation.Note
The longitudinal sample was limited to Canadian-born and immigrant individuals aged 25 to 54 in 2006 who completed a college, CEGEP or other non-university certificate or diploma or university certificate below a bachelor’s degree, or a university degree (bachelor’s degree or above) in a STEM field of study.Note This age range was selected to include people of prime working age over the 10-year period studied.Note Furthermore, only those who reported the same level of education in 2006 and 2016 were included to minimize the possibility of including individuals who obtained additional educational credentials in non-STEM programs over this period. These restrictions resulted in a sample size of 48,271 (33,686 men and 14,585 women). Sample restrictions varied across different analytical sections because of the specific questions being addressed. Details about each of these samples are addressed in the results section.
Two key variables in this study are field of study and occupation. Statistics Canada’s (2018) STEM field of study classification was used to assign the field of study of each respondent’s highest certificate, diploma or degree (in 2006) to a STEM group. Some STEM groups were combined to ensure adequate sample sizes for more detailed descriptive analyses, resulting in four STEM fields: (a) physical and chemical sciences; (b) biological, general and integrated sciences; (c) engineering and engineering technology; and (d) mathematics and computer and information sciences.
The classification of STEM occupations follows Picot and Hou’s (2018; forthcoming) work, which provides a consistent categorization of STEM occupations over several census years. Appendix Table 1 provides a detailed list of STEM occupations and their corresponding 2006 National Occupational Classification for Statistics (NOC-S 2006) and 2016 National Occupational Classification (NOC 2016) codes. Generally, this classification includes occupations in the NOC’s “natural and applied sciences and related occupations” category and some STEM-related management occupations (e.g., engineering managers).
This study takes a gender-based analytical approach, presenting sex-disaggregated statistics for men and women. These results represent only STEM graduates and do not account for men and women with non-STEM credentials who may be employed in STEM occupations.Note
4 Results
4.1 Description of sample characteristics
The main characteristics of the longitudinal sample are provided in Table 1. Results are presented for two samples. The first includes all STEM graduates, regardless of whether they were employed in 2006 or 2016, and the second includes only STEM graduates who were employed in both 2006 and 2016. Few differences were found between these two samples.
Generally, the majority (7 in 10) of STEM graduates were men, while 3 in 10 were women. Just over three-quarters of the sample were married or in a common-law relationship in 2006. About 17% were single.Note Nearly two-thirds of the sample did not have children younger than 6 in either 2006 or 2016, and about one-third had a young child in either 2006 or 2016. Only 2.1% had children younger than 6 in both years.
One-quarter of respondents reported being a member of a visible minority group, while just over one-third of the sample were immigrants. Compared with men, a slightly higher proportion of women with STEM credentials were immigrants.
A small proportion of STEM graduates identified as a member of an Aboriginal groupNote in the longitudinal sample (just over 1%). Similar proportions of men and women reported being a member of an Aboriginal group.
About 2 in 10 respondents achieved their highest level of education outside Canada. This proportion was slightly higher among women than men (22.8% and 20.1%, respectively). A higher proportion of STEM graduates reported a college diploma or university certificate below the bachelor’s level (43.2%) than a bachelor’s degree (41.6%) as their highest level of education. However, men were more likely than women to have college-level credentials, while women were more likely to hold a bachelor’s degree.
Overall, the largest proportion of STEM graduates had studied engineering or engineering technology (47.9%). However, this was largely driven by men. Over half of male STEM graduates had studied engineering or engineering technology, compared with just under one-quarter of women with STEM credentials. Conversely, women were much more likely to have studied biological, general or integrated sciences than men (37.5% and 12.5%, respectively). About one-quarter of STEM graduates had studied mathematics or computer and information sciences, while less than 1 in 10 had studied physical or chemical sciences.
| Sample including all STEM graduates |
Sample including only STEM graduates employed in 2006 and 2016 |
|||||
|---|---|---|---|---|---|---|
| Overall | Men | Women | Overall | Men | Women | |
| percent | percent | |||||
| Sex | ||||||
| Female | 30.2 | Note ...: not applicable | 100.0 | 28.0 | Note ...: not applicable | 100.0 |
| Male | 69.8 | 100.0 | Note ...: not applicable | 72.0 | 100.0 | Note ...: not applicable |
| Age group (2006) | ||||||
| 25 to 34 | 30.0 | 28.4 | 33.8 | 31.7 | 30.2 | 35.5 |
| 35 to 44 | 38.8 | 38.8 | 38.9 | 40.8 | 40.7 | 41.0 |
| 45 to 54 | 31.2 | 32.8 | 27.3 | 27.5 | 29.1 | 23.5 |
| Marital status (2006) | ||||||
| Single, never married | 17.1 | 17.3 | 16.6 | 17.1 | 16.8 | 17.7 |
| Married or common law | 77.5 | 78.3 | 75.4 | 77.8 | 79.1 | 74.4 |
| Separated, divorced or widowed | 5.5 | 4.4 | 8.0 | 5.1 | 4.1 | 7.9 |
| Immigrant status | ||||||
| Canadian-born | 65.8 | 66.7 | 63.6 | 66.3 | 66.7 | 65.2 |
| Immigrant | 34.2 | 33.3 | 36.5 | 33.7 | 33.3 | 34.8 |
| Aboriginal identity | ||||||
| Does not identify as member of an Aboriginal group | 98.9 | 99.0 | 98.7 | 98.9 | 99.0 | 98.7 |
| Identifies as member of an Aboriginal group | 1.1 | 1.0 | 1.3 | 1.1 | 1.0 | 1.3 |
| Visible minority status | ||||||
| Not a visible minority | 74.8 | 75.5 | 73.2 | 75.2 | 75.5 | 74.4 |
| Visible minority | 25.2 | 24.6 | 26.8 | 24.9 | 24.6 | 25.6 |
| Presence of children younger than 6 | ||||||
| Had children younger than 6 in 2006 and 2016 | 2.1 | 2.1 | 2.1 | 2.1 | 2.2 | 1.9 |
| Had children younger than 6 in 2006, not in 2016 | 22.0 | 21.8 | 22.3 | 22.9 | 23.3 | 22.0 |
| Had children younger than age 6 in 2016, not in 2006 | 10.6 | 10.9 | 9.8 | 11.4 | 11.7 | 10.7 |
| Did not have children younger than 6 in 2006 or 2016 | 65.3 | 65.1 | 65.8 | 63.5 | 62.8 | 65.4 |
| Highest certificate, diploma or degree | ||||||
| College, CEGEP or other non-university certificate or diploma or university certificate below a bachelor's degree | 43.2 | 45.3 | 38.2 | 42.6 | 44.6 | 37.6 |
| Bachelor's degree | 41.6 | 40.2 | 45.0 | 41.7 | 40.5 | 44.8 |
| University degree above a bachelor's degree | 15.2 | 14.5 | 16.8 | 15.7 | 14.9 | 17.6 |
| Location of postsecondary study | ||||||
| Canada | 79.1 | 79.9 | 77.2 | 79.7 | 79.9 | 79.2 |
| Outside Canada | 20.9 | 20.1 | 22.8 | 20.3 | 20.1 | 20.8 |
| STEM field of study | ||||||
| Physical and chemical sciences | 7.0 | 6.3 | 8.6 | 6.9 | 6.2 | 8.5 |
| Biological, general and integrated sciences | 20.0 | 12.5 | 37.5 | 19.7 | 12.5 | 38.0 |
| Engineering and engineering technology | 47.9 | 58.2 | 24.1 | 48.6 | 58.1 | 24.3 |
| Mathematics and computer and information sciences | 25.1 | 23.0 | 29.8 | 24.9 | 23.2 | 29.2 |
| Area of residence (2006) | ||||||
| Newfoundland and Labrador | 1.1 | 1.1 | 1.2 | 1.2 | 1.1 | 1.3 |
| Prince Edward Island | 0.3 | 0.3 | 0.4 | 0.3 | 0.3 | 0.4 |
| Nova Scotia | 2.5 | 2.4 | 2.8 | 2.5 | 2.4 | 2.9 |
| New Brunswick | 1.9 | 2.0 | 1.8 | 2.0 | 2.0 | 2.0 |
| Quebec | 23.3 | 23.8 | 22.0 | 23.2 | 23.6 | 22.3 |
| Ontario | 44.3 | 43.8 | 45.3 | 44.1 | 43.8 | 44.7 |
| Manitoba | 2.6 | 2.6 | 2.5 | 2.6 | 2.6 | 2.6 |
| Saskatchewan | 1.7 | 1.7 | 1.8 | 1.8 | 1.8 | 1.9 |
| Alberta | 11.4 | 11.6 | 10.8 | 11.5 | 11.8 | 10.7 |
| British Columbia | 10.7 | 10.5 | 11.1 | 10.7 | 10.6 | 11.1 |
| Territories | 0.2 | 0.2 | 0.3 | 0.2 | 0.2 | 0.3 |
| number | ||||||
| Sample size | 48,271 | 33,686 | 14,585 | 42,142 | 30,312 | 11,830 |
|
... not applicable Notes: STEM stands for science, technology, engineering and mathematics. The sample consisted of Canadian-born and immigrant individuals aged 25 to 54 in 2006 who completed a college, CEGEP or other non-university certificate or diploma or university certificate below a bachelor's degree or a university degree in a STEM field of study and reported the same level of education in 2006 and 2016. Sources: Statistics Canada, 2006 and 2016 longitudinal census files. |
||||||
4.2 Proportion of STEM graduates working in STEM occupations, 2006 and 2016
This section presents the proportion of STEM graduates in the longitudinal sample who worked in STEM occupations, non-STEM occupations, or who were not in the labour force.Note Results for both 2006 and 2016 are reported. For this analysis, the sample included all STEM graduates regardless of their employment status in 2006 and 2016, allowing for potential movement into and out of the labour force.
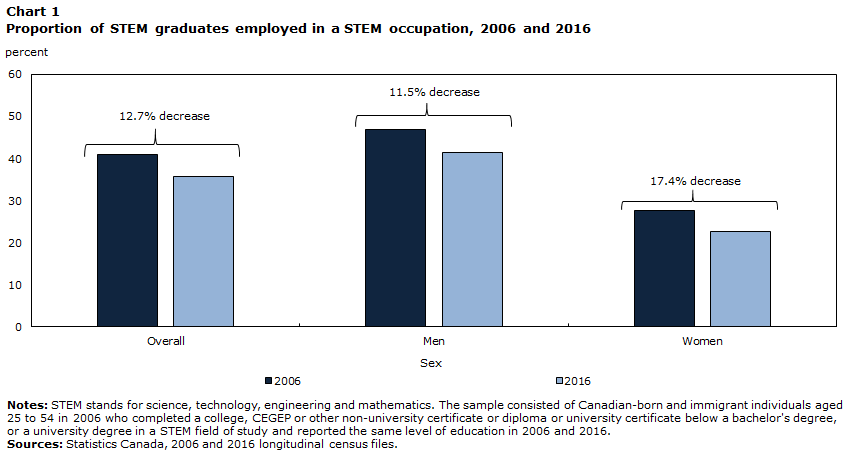
Overall, just over 4 in 10 STEM graduates in the longitudinal sample were employed in a STEM occupation in 2006 (41.1%; Chart 1). A smaller proportion (35.8%) worked in a STEM occupation in 2016, representing a 12.7% decrease between 2006 and 2016.
There were notable differences in the proportion of men and women with STEM credentials working in STEM occupations (Chart 1).Note While nearly half of male STEM graduates worked in a STEM occupation in 2006 (46.9%), less than 3 in 10 women with STEM credentials worked in similar occupations (27.6%). Both women and men were less likely to be employed in a STEM occupation in 2016—women experienced a 17.4% decrease, while men experienced an 11.5% decrease.Note Generally, the gap between men and women was similar between 2006 and 2016 (about 19 percentage points).
Detailed information about the occupations of STEM graduates is presented in Chart 2. In both 2006 and 2016, half of male STEM graduates worked in non-STEM occupations.Note In comparison, over 6 in 10 women with STEM credentials worked in non-STEM occupations in the two years. Overall, a higher proportion of men than women had managerial occupations in both 2006 and 2016. Moreover, women with STEM credentials were more likely than their male counterparts to be unemployed or not in the labour force.Note
Data table for Chart 1
| Sex | 2006 | 2016 |
|---|---|---|
| percent | ||
| Overall | 41.1 | 35.8 |
| Men | 46.9 | 41.5 |
| Women | 27.6 | 22.8 |
|
Notes: STEM stands for science, technology, engineering and mathematics. The sample consisted of Canadian-born and immigrant individuals aged 25 to 54 in 2006 who completed a college, CEGEP or other non-university certificate or diploma or university certificate below a bachelor's degree, or a university degree in a STEM field of study and reported the same level of education in 2006 and 2016. Sources: Statistics Canada, 2006 and 2016 longitudinal census files. |
||

Data table for Chart 2
| Men | Women | |||
|---|---|---|---|---|
| 2006 | 2016 | 2006 | 2016 | |
| percent | ||||
| STEM management occupation | 3.2 | 4.1 | 1.7 | 2.1 |
| STEM non-management occupation | 43.7 | 37.4 | 25.9 | 20.6 |
| Non-STEM management occupation | 11.4 | 13.4 | 6.5 | 8.7 |
| Non-STEM non-management occupation | 38.9 | 36.9 | 56.6 | 54.8 |
| Unemployed/not in labour force | 2.8 | 8.3 | 9.4 | 13.7 |
|
Note: STEM stands for science, technology, engineering and mathematics. The sample consisted of Canadian-born and immigrant individuals aged 25 to 54 in 2006 who completed a college, CEGEP or other non-university certificate or diploma or university certificate below a bachelor's degree, or a university degree in a STEM field of study and reported the same level of education in 2006 and 2016. Sources: Statistics Canada, 2006 and 2016 longitudinal census files. |
||||
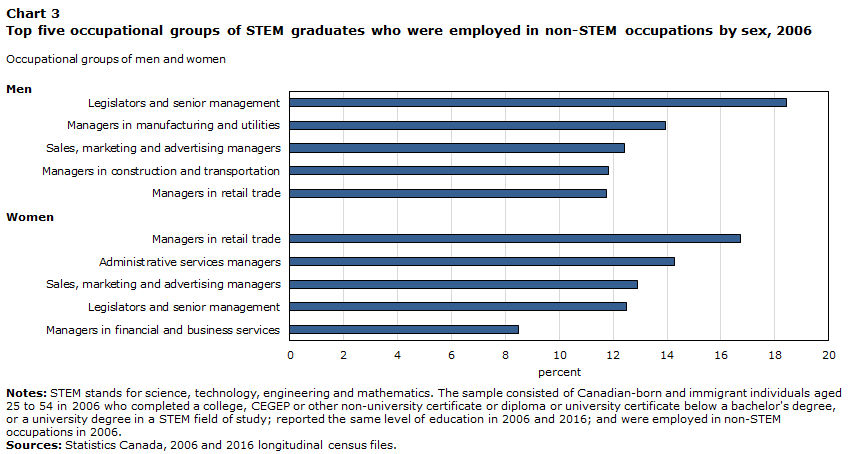
Female and male STEM graduates who worked in non-STEM occupations in 2006 were generally in similar occupational groups (Chart 3).Note Three of the top five occupational groups were the same for both women and men: legislators and senior management; sales, marketing and advertising managers; and managers in retail trade. However, a higher proportion of men than women worked in the legislators and senior management group (18.4% and 12.5%, respectively), while a higher proportion of women than men worked in the managers in retail trade group (16.7% and 11.8%, respectively).
Some differences in women’s and men’s non-STEM occupations were also observed. For example, while administrative services managers and managers in financial and business services were among the top five occupational groups of women working in non-STEM occupations, they were not among the top occupational groups for their male counterparts (Chart 3). About one-quarter of male STEM graduates in non-STEM occupations had worked as managers in manufacturing and utilities or as managers in construction and transportation, which were not in the top occupational groups of women employed in non-STEM occupations.
Data table for Chart 3
| Occupational groups of men and women | Percent |
|---|---|
| Men | |
| Legislators and senior management | 18.4 |
| Managers in manufacturing and utilities | 13.9 |
| Sales, marketing and advertising managers | 12.4 |
| Managers in construction and transportation | 11.8 |
| Managers in retail trade | 11.8 |
| Women | |
| Managers in retail trade | 16.7 |
| Administrative services managers | 14.3 |
| Sales, marketing and advertising managers | 12.9 |
| Legislators and senior management | 12.5 |
| Managers in financial and business services | 8.5 |
|
Notes: STEM stands for science, technology, engineering and mathematics. The sample consisted of Canadian-born and immigrant individuals aged 25 to 54 in 2006 who completed a college, CEGEP or other non-university certificate or diploma or university certificate below a bachelor's degree, or a university degree in a STEM field of study; reported the same level of education in 2006 and 2016; and were employed in non-STEM occupations in 2006. Sources: Statistics Canada, 2006 and 2016 longitudinal census files. |
|
To determine whether sociodemographic and educational characteristics were associated with the likelihood of working in a STEM occupation in 2006,Note ordinary least squares (OLS) regression models were employed.Note The variables entered in the model include age group in 2006 (25 to 34, 35 to 44 or 45 to 54); marital status in 2006 (single; married or common law; or divorced, separated or widowed); binary variables for immigrant status, Aboriginal identity and visible minority status; number of children younger than 6 in 2006 (none, one, two, or three or more); highest certificate, diploma or degree in 2006 (college diploma or university certificate below a bachelor’s degree, bachelor’s degree, or university degree above a bachelor’s degree); STEM field of study (physical and chemical sciences; biological, general and integrated sciences; engineering and engineering technology; or mathematics and computer and information sciences); location of study (within Canada or outside Canada); and province or territoryNote of residence in 2006. For these models, only individuals who were employed in 2006 were included in the sample.
Results for the regression models are presented in Table 2. Among both men and women, STEM graduates in older age groups were less likely than their counterparts aged 25 to 34 to work in a STEM occupation.Note Furthermore, men and women who identified as visible minorities were less likely than their counterparts who did not identify as a minority to work in a STEM occupation.
Differences between men and women with STEM credentials were observed in the relationship between Aboriginal identity and the likelihood of working in a STEM occupation. While Aboriginal men with STEM credentials were less likely than their non-Aboriginal counterparts to be employed in a STEM occupation in 2006, there was no statistically significant difference between Aboriginal women and non-Aboriginal women.
The relationship between the number of children younger than age 6 and the likelihood of working in a STEM occupation also differed between women and men. Men who had one or two children younger than 6 were more likely than men with no young children to work in a STEM occupation. Similarly, women with one child younger than 6 were more likely to be employed in a STEM occupation than women with no young children. However, women who had three or more children younger than 6 were less likely than those with no young children to be employed in a STEM occupation.
Level of education also mattered. Compared with bachelor’s degree holders, STEM graduates who held a college diploma or a university certificate below the bachelor’s level were less likely to be employed in a STEM occupation, while those with a university degree above a bachelor’s degree were more likely to work in a STEM occupation. This was true for both men and women. Furthermore, men and women who obtained their STEM credentials in Canada were more likely than their counterparts who studied outside Canada to work in a STEM occupation. This may be an indication of a preference among STEM employers for Canadian-educated workers.
| Men | Women | |||
|---|---|---|---|---|
| coefficient | standard error | coefficient | standard error | |
| Age group (2006) (reference group: 25 to 34) | ||||
| 35 to 44 | -0.033Note *** | 0.007 | -0.028Note ** | 0.010 |
| 45 to 54 | -0.074Note *** | 0.008 | -0.069Note *** | 0.012 |
| Marital status (2006) (reference group: married or common law) | ||||
| Single or never married | -0.003 | 0.009 | -0.019 | 0.012 |
| Separated, divorced or widowed | -0.025Table 2 Note † | 0.014 | -0.021 | 0.016 |
| Number of children younger than 6 (2006) (reference group: none) | ||||
| One | 0.024Note ** | 0.009 | 0.023Table 2 Note † | 0.013 |
| Two | 0.022Table 2 Note † | 0.012 | 0.001 | 0.019 |
| Three or more | 0.000 | 0.034 | -0.114Note * | 0.053 |
| Visible minority status (reference group: not a visible minority) | -0.062Note *** | 0.009 | -0.025Table 2 Note † | 0.014 |
| Aboriginal identity (reference group: does not identify as member of an Aboriginal group) | -0.085Note ** | 0.027 | -0.045 | 0.036 |
| Immigrant status (reference group: Canadian-born) | 0.016 | 0.010 | 0.019 | 0.015 |
| Highest certificate, diploma or degree (reference group: bachelor's degree) | ||||
| College, CEGEP or other non-university certificate or diploma or university certificate below a bachelor's degree | -0.177Note *** | 0.007 | -0.126Note *** | 0.010 |
| University degree above a bachelor's degree | 0.031Note ** | 0.009 | 0.046Note *** | 0.013 |
| Location of study (reference group: outside Canada) | 0.106Note *** | 0.010 | 0.140Note *** | 0.014 |
| STEM field of study (reference group: engineering and engineering technology) | ||||
| Physical and chemical sciences | -0.080Note *** | 0.013 | -0.101Note *** | 0.018 |
| Biological, general and integrated sciences | -0.316Note *** | 0.009 | -0.315Note *** | 0.011 |
| Mathematics and computer and information sciences | 0.129Note *** | 0.007 | -0.037Note ** | 0.013 |
| Area of residence (2006) (reference group: Ontario) | ||||
| Newfoundland and Labrador | 0.015 | 0.028 | -0.097Note ** | 0.032 |
| Prince Edward Island | -0.011 | 0.054 | 0.013 | 0.067 |
| Nova Scotia | -0.059Note ** | 0.019 | -0.080Note ** | 0.024 |
| New Brunswick | -0.007 | 0.021 | -0.080Note ** | 0.027 |
| Quebec | 0.011 | 0.008 | 0.052Note *** | 0.012 |
| Manitoba | 0.040Note * | 0.019 | 0.050Table 2 Note † | 0.027 |
| Saskatchewan | 0.039Table 2 Note † | 0.023 | 0.084Note * | 0.034 |
| Alberta | 0.091Note *** | 0.010 | 0.040Note ** | 0.014 |
| British Columbia | 0.017Table 2 Note † | 0.010 | 0.002 | 0.014 |
| Territories | 0.038 | 0.054 | 0.109 | 0.073 |
Sources: Statistics Canada, 2006 and 2016 longitudinal census files. |
||||
Men and women who studied physical or chemical sciences or biological, general or integrated sciences were less likely to be working in STEM occupations than their counterparts who studied engineering or engineering technology. However, differences between women and men were found for mathematics and computer and information science graduates. Men who studied mathematics or computer and information sciences were more likely than men who studied engineering or engineering technology to be working in a STEM occupation. By comparison, women who studied mathematics or computer and information sciences were less likely to be employed in a STEM occupation than women who had studied engineering or engineering technology.
While the results presented in this section provide an overview of the occupational attainment of STEM graduates in 2006 and 2016, different factors may play a role in the proportion of individuals working in STEM occupations in each of the two years. For example, while some individuals leave STEM occupations, others may enter from non-STEM occupations. To better understand the occupational changes of STEM graduates, the remaining sections concentrate on the pathways of STEM graduates who were employed in both 2006 and 2016.
4.3 Occupational pathways of STEM graduates
This section examines only the STEM graduates who reported an occupation in both 2006 and 2016. Since the primary goal of this study is to understand the occupational changes of STEM graduates, focusing on this group provides insight into the pathways of individuals who had an occupation in both years.
Descriptive analyses are presented for four occupational pathways: (a) employed in a STEM occupation in both 2006 and 2016 (persisted in STEM), (b) employed in a STEM occupation in 2006 and employed in a non-STEM occupation in 2016 (exited STEM), (c) employed in a non-STEM occupation in 2006 and employed in a STEM occupation in 2016 (entered STEM), and (d) worked in a non-STEM occupation in 2006 and 2016 (never in STEMNote ).
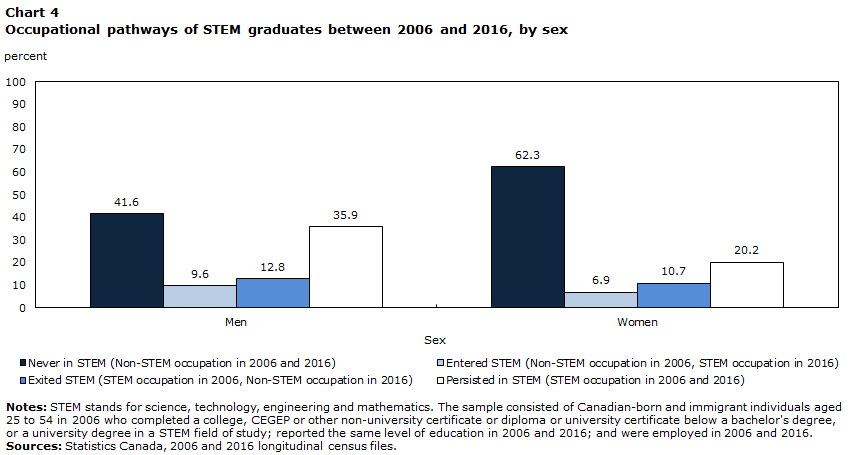
The occupational pathways of men and women with STEM credentials differed.Note
Generally, a higher proportion of men (35.9%) than women (20.2%) worked in a STEM occupation in both 2006 and 2016 (persisted in STEM, Chart 4). Notably, just over 6 in 10 women with STEM credentials did not work in a STEM occupation in either year, compared with about 4 in 10 men (never in STEM, Chart 4). The differences observed in the proportion of men and women who exited or entered STEM occupations between 2006 and 2016 were less pronounced.Note
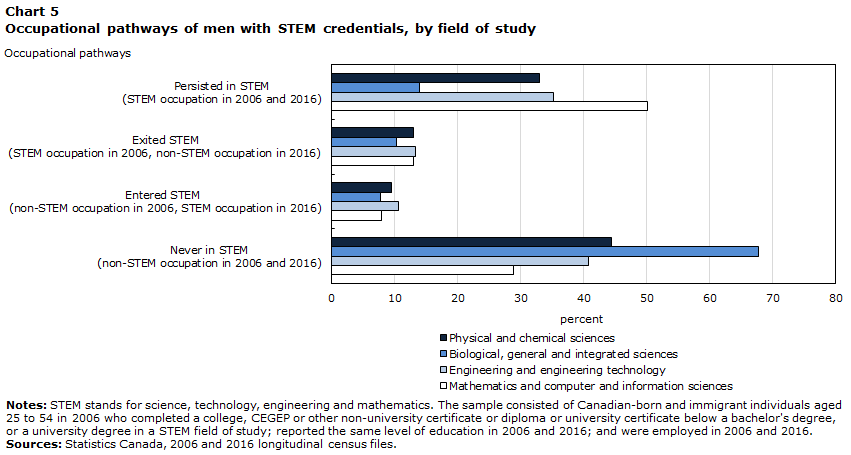
The occupational pathways of STEM graduates also varied by field of study. Among men, about half of mathematics and computer and information science graduates and just over one-third of engineering and engineering technology graduates persisted in a STEM occupation between 2006 and 2016 (Chart 5).Note Notably, about two-thirds of men who studied biological, general or integrated sciences did not have a STEM occupation in either 2006 or 2016. Across STEM fields, men who studied mathematics or computer and information sciences had the lowest proportion of graduates who had never worked in a STEM occupation (28.9%).
The highest proportion of women who persisted in a STEM occupation between 2006 and 2016 was for engineering and engineering technology graduates (30.7%; Chart 6). Over one-quarter of women who studied mathematics or computer and information sciences also persisted in STEM occupations over the 10-year period. Among women who studied biological, general or integrated sciences, less than 1 in 10 had a STEM occupation in both 2006 and 2016, while over three-quarters never worked in a STEM occupation.Note More than half of women who studied physical or chemical sciences or mathematics or computer and information sciences did not have a STEM occupation in either 2006 or 2016.
Overall, women from all four STEM fields were less likely than their male counterparts to persist in STEM occupations. They were also more likely than men who studied in the same STEM field to have never worked in a STEM occupation. This was particularly noticeable among men and women who studied mathematics or computer and information sciences. However, similar proportions of men and women with STEM credentials in physical or chemical sciences exited a STEM occupation between 2006 and 2016.Note
Data table for Chart 4
| Men | Women | |
|---|---|---|
| percent | ||
| Never in STEM (Non-STEM occupation in 2006 and 2016) | 41.6 | 62.3 |
| Entered STEM (Non-STEM occupation in 2006, STEM occupation in 2016) | 9.6 | 6.9 |
| Exited STEM (STEM occupation in 2006, Non-STEM occupation in 2016) | 12.8 | 10.7 |
| Persisted in STEM (STEM occupation in 2006 and 2016) | 35.9 | 20.2 |
|
Notes: STEM stands for science, technology, engineering and mathematics. The sample consisted of Canadian-born and immigrant individuals aged 25 to 54 in 2006 who completed a college, CEGEP or other non-university certificate or diploma or university certificate below a bachelor's degree, or a university degree in a STEM field of study; reported the same level of education in 2006 and 2016; and were employed in 2006 and 2016.
Sources: Statistics Canada, 2006 and 2016 longitudinal census files. |
||
Data table for Chart 5
| Occupational pathways | Persisted in STEM (STEM occupation in 2006 and 2016) |
Exited STEM (STEM occupation in 2006, non-STEM occupation in 2016) |
Entered STEM (non-STEM occupation in 2006, STEM occupation in 2016) |
Never in STEM (non-STEM occupation in 2006 and 2016) |
|---|---|---|---|---|
| percent | ||||
| Physical and chemical sciences | 33.0 | 13.1 | 9.5 | 44.5 |
| Biological, general and integrated sciences | 14.0 | 10.4 | 7.8 | 67.8 |
| Engineering and engineering technology | 35.2 | 13.3 | 10.7 | 40.8 |
| Mathematics and computer and information sciences | 50.2 | 13.0 | 7.9 | 28.9 |
|
Notes: STEM stands for science, technology, engineering and mathematics. The sample consisted of Canadian-born and immigrant individuals aged 25 to 54 in 2006 who completed a college, CEGEP or other non-university certificate or diploma or university certificate below a bachelor's degree, or a university degree in a STEM field of study; reported the same level of education in 2006 and 2016; and were employed in 2006 and 2016. Sources: Statistics Canada, 2006 and 2016 longitudinal census files. |
||||

Data table for Chart 6
| Occupational pathways | Persisted in STEM (STEM occupation in 2006 and 2016) |
Exited STEM (STEM occupation in 2006, non-STEM occupation in 2016) |
Entered STEM (non-STEM occupation in 2006, STEM occupation in 2016) |
Never in STEM (non-STEM occupation in 2006 and 2016) |
|---|---|---|---|---|
| percent | ||||
| Physical and chemical sciences | 21.5 | 13.2 | 7.7 | 57.6 |
| Biological, general and integrated sciences | 8.0 | 8.3 | 5.6 | 78.1 |
| Engineering and engineering technology | 30.7 | 12.8 | 8.4 | 48.1 |
| Mathematics and computer and information sciences | 26.9 | 11.5 | 7.0 | 54.7 |
|
Notes: STEM stands for science, technology, engineering and mathematics. The sample consisted of Canadian-born and immigrant individuals aged 25 to 54 in 2006 who completed a college, CEGEP or other non-university certificate or diploma or university certificate below a bachelor's degree, or a university degree in a STEM field of study; reported the same level of education in 2006 and 2016; and were employed in 2006 and 2016. Sources: Statistics Canada, 2006 and 2016 longitudinal census files. |
||||
4.4 Factors associated with STEM graduates exiting a STEM occupation
While the previous section provides insight into the occupational pathways of STEM graduates, this section focuses on STEM graduates who were employed in a STEM occupation in 2006 and had either persisted in or exited a STEM occupation by 2016.
In addition to providing descriptive information on the occupational pathways of these STEM graduates, this section presents OLS regression results to determine whether certain sociodemographic and educational characteristics were associated with the likelihood of exiting a STEM occupation between 2006 and 2016.Note For these models, the same set of sociodemographic and educational variables used in the regression model described in Section 4.2 (Table 2) was analyzed, except the variable for the number of young children. For the models presented in this section, a variable was created to account for potential changes in the presence of young children between 2006 and 2016. This variable includes the following categories: children younger than 6 in both 2006 and 2016, children younger than 6 in 2006 only, children younger than 6 in 2016 only, and no children younger than 6 in 2006 or 2016.Note
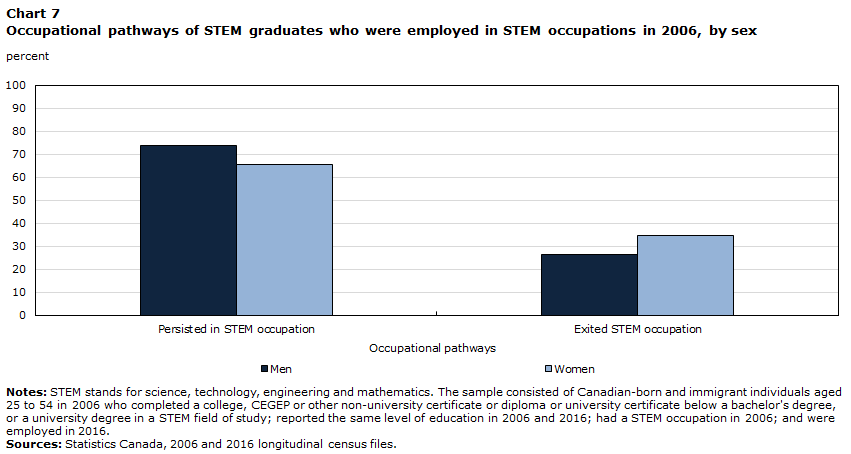
The occupational pathways of STEM graduates who were employed in a STEM occupation in 2006 are presented in Chart 7.Note The majority of men and women who were employed in a STEM occupation in 2006 persisted in STEM occupations. However, women were more likely than men to have exited a STEM occupation between 2006 and 2016. Just over one-third of women (34.7%) who were employed in a STEM occupation in 2006 had moved to a non-STEM occupation 10 years later, while about one-quarter of men (26.4%) followed the same occupational pathway.Note
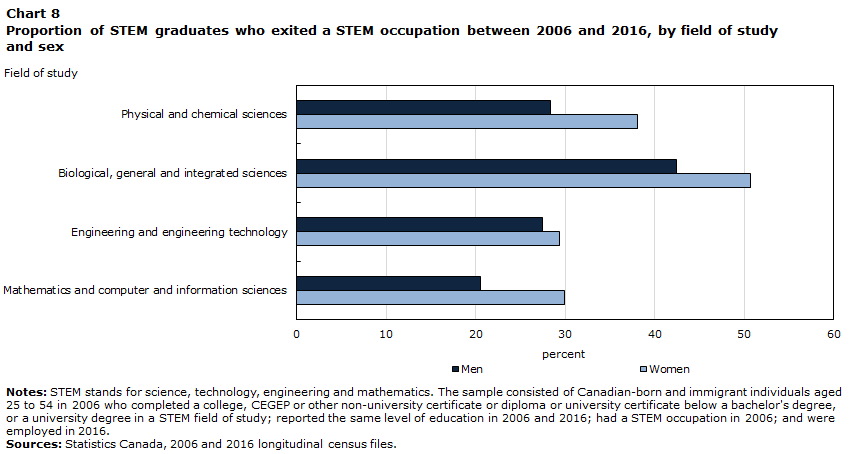
Chart 8 shows the proportion of women and men with STEM credentials who exited a STEM occupation by field of study. Generally, a higher proportion of women than men exited a STEM occupation across all STEM fields. The gap was widest among women and men who studied physical or chemical sciences (38.1% and 28.4%, respectively). The narrowest gap was between women and men who studied engineering or engineering technology; however, the difference in exit rates between male and female engineering graduates was not statistically significant.
The multivariate models presented in Table 3 indicate that age was associated with the likelihood of men and women exiting STEM occupations. Generally, men aged 35 to 44 and women aged 45 to 54 were less likely to exit STEM occupations than their younger (25 to 34) counterparts. However, other sociodemographic characteristics, such as Aboriginal identity, immigrant status and visible minority status, did not show statistically significant associations with exiting a STEM occupation for men or women.
Data table for Chart 7
| Occupational pathways | Men | Women |
|---|---|---|
| percent | ||
| Persisted in STEM occupation | 73.6 | 65.3 |
| Exited STEM occupation | 26.4 | 34.7 |
|
Notes: STEM stands for science, technology, engineering and mathematics. The sample consisted of Canadian-born and immigrant individuals aged 25 to 54 in 2006 who completed a college, CEGEP or other non-university certificate or diploma or university certificate below a bachelor's degree, or a university degree in a STEM field of study; reported the same level of education in 2006 and 2016; had a STEM occupation in 2006; and were employed in 2016. Sources: Statistics Canada, 2006 and 2016 longitudinal census files. |
||
Data table for Chart 8
| Fiels of study | Men | Women |
|---|---|---|
| percent | ||
| Physical and chemical sciences | 28.4 | 38.1 |
| Biological, general and integrated sciences | 42.5 | 50.7 |
| Engineering and engineering technology | 27.4 | 29.4 |
| Mathematics and computer and information sciences | 20.6 | 29.9 |
|
Notes: STEM stands for science, technology, engineering and mathematics. The sample consisted of Canadian-born and immigrant individuals aged 25 to 54 in 2006 who completed a college, CEGEP or other non-university certificate or diploma or university certificate below a bachelor's degree, or a university degree in a STEM field of study; reported the same level of education in 2006 and 2016; had a STEM occupation in 2006; and were employed in 2016. Sources: Statistics Canada, 2006 and 2016 longitudinal census files. |
||
The previous literature suggests that women’s occupational pathways may be associated with family obligations, such as caring for young children (e.g., Xu 2015). Interestingly, having children younger than 6 was not significantly associated with the likelihood of women or men exiting STEM occupations. However, marital status mattered. Single women were less likely to exit a STEM occupation between 2006 and 2016 than women who were married or in a common law relationship. Men who were separated, divorced or widowed were more likely to exit a STEM occupation than their married or common law counterparts.
Since this section focuses only on those who were employed in a STEM occupation in 2006, selection bias may affect the results for the presence of young children variable. For example, as the results in Table 2 showed, women with three or more young children were less likely to be employed in a STEM occupation in 2006 than women with no young children. Therefore, it is possible that some women with young children self-selected out of STEM occupations to begin with.Note As a result, the potential influence of the presence of young children may be minimized in this set of results.
With respect to education, men and women with a college diploma or university certificate below the bachelor’s level were more likely to exit a STEM occupation than their counterparts with a bachelor’s degree (Table 3). Field of study was also an important factor in graduates’ persistence in STEM occupations. Similar to the descriptive results, men and women who studied physical or chemical sciences or biological, general or integrated sciences were more likely to exit a STEM occupation than their counterparts who studied engineering or engineering technology. However, differences were observed between women and men who studied mathematics or computer and information sciences. Men who studied in these fields were less likely to exit STEM occupations than men who studied engineering or engineering technology. In contrast, there was no statistically significant difference in the likelihood of exiting a STEM occupation between women who studied mathematics or computer and information sciences and women who studied engineering or engineering technology.
One question that arises regarding STEM graduates who left STEM occupations is whether they were concentrated in particular STEM occupations prior to their exit. Moreover, because of a lack of longitudinal data with occupational information, previous studies do not provide much information about the non-STEM occupations to which they moved. Charts 9 and 10 show the most common STEM and non-STEM occupations of men and women who worked in STEM occupations in 2006 and moved to a non-STEM occupation by 2016.
The top two STEM occupational groups in 2006 for individuals who exited STEM occupations were the same for both men and women: information systems analysts and consultants, and computer programmers and interactive media developers (Chart 9).Note Among men who exited STEM occupations, about 1 in 10 worked as either electrical and electronics engineering technologists or civil engineers in 2006. Biologists and related scientists, chemical technologists and technicians, and chemists were also among the top occupational groups that female STEM graduates exited.
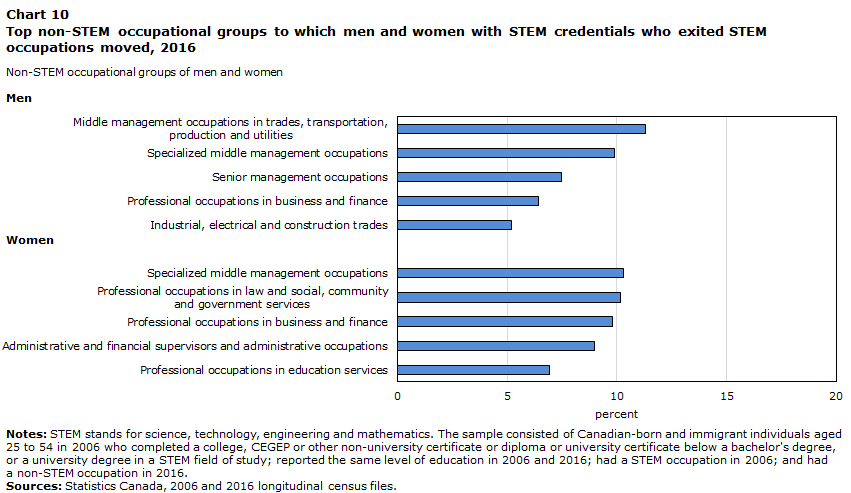
The top five non-STEM occupational groups in which STEM “leavers” worked in 2016 are presented in Chart 10.Note Just over 2 in 10 women moved into either specialized middle management occupations or professional occupations in law and social, community and government services. Professional occupations in business and finance, as well as administrative and financial supervisors and administrative occupations, were also among the top occupations of women who exited STEM occupations. About 2 in 10 men moved into middle management occupations in trades, transportation, production and utilities, or into specialized middle management occupations, while 7.5% of men moved into senior management occupations.
Additional results showing the top five occupational groups of men and women who exited STEM occupations are presented in Appendix Table 2 by field of study. Some differences were observed across STEM fields. For example, senior management occupations was one of the top five occupational groups to which men moved across all STEM fields, but was not among the top five for women. Conversely, office support occupations was in the top five occupational groups for women who studied physical or chemical sciences, engineering or engineering technology, or mathematics or computer and information science programs, but was not in the top five for men. The results also indicated that many women who studied physical or chemical sciences or biological, general or integrated sciences moved into professional occupations in education services.
| Men | Women | |||
|---|---|---|---|---|
| coefficient | standard error | coefficient | standard error | |
| Age group (2006) (reference group: 25 to 34) | ||||
| 35 to 44 | -0.019Table 3 Note † | 0.010 | -0.030 | 0.022 |
| 45 to 54 | -0.018 | 0.013 | -0.072Note ** | 0.028 |
| Marital status (2006) (reference group: married or common law) | ||||
| Single or never married | -0.009 | 0.011 | -0.043Table 3 Note † | 0.024 |
| Separated, divorced or widowed | 0.041Table 3 Note † | 0.022 | -0.016 | 0.035 |
| Presence of children younger than 6 (reference group: did not have children younger than 6 in 2006 or 2016) | ||||
| Had children younger than 6 in 2006 and 2016 | -0.0003 | 0.027 | 0.048 | 0.063 |
| Had children younger than 6 in 2006, not in 2016 | 0.008 | 0.011 | 0.001 | 0.024 |
| Had children younger than 6 in 2016, not in 2006 | -0.007 | 0.013 | -0.030 | 0.030 |
| Visible minority status (reference group: not a visible minority) | -0.009 | 0.012 | -0.029 | 0.027 |
| Aboriginal identity (reference group: does not identify as member of Aboriginal group) | 0.021 | 0.043 | 0.013 | 0.083 |
| Immigrant status (reference group: Canadian-born) | 0.008 | 0.014 | 0.017 | 0.030 |
| Highest certificate, diploma or degree (reference group: bachelor's degree) | ||||
| College, CEGEP or other non-university certificate or diploma or university certificate below a bachelor's degree | 0.098Note *** | 0.009 | 0.052Note * | 0.021 |
| University degree above a bachelor's degree | -0.018 | 0.012 | -0.008 | 0.024 |
| Location of study (reference group: outside Canada) | -0.016 | 0.013 | 0.016 | 0.029 |
| STEM field of study (reference group: engineering and engineering technology) | ||||
| Physical and chemical sciences | 0.040Note * | 0.018 | 0.093Note ** | 0.033 |
| Biological, general and integrated sciences | 0.183Note *** | 0.019 | 0.223Note *** | 0.026 |
| Mathematics and computer and information sciences | -0.079Note *** | 0.009 | -0.004 | 0.021 |
| Area of residence (in 2006) (reference group: Ontario) | ||||
| Newfoundland and Labrador | 0.0003 | 0.038 | 0.086 | 0.096 |
| Prince Edward Island | 0.032 | 0.083 | -0.308Note ** | 0.116 |
| Nova Scotia | -0.023 | 0.029 | 0.020 | 0.066 |
| New Brunswick | 0.033 | 0.031 | 0.059 | 0.073 |
| Quebec | 0.009 | 0.011 | -0.023 | 0.023 |
| Manitoba | -0.004 | 0.025 | -0.074 | 0.053 |
| Saskatchewan | 0.005 | 0.031 | 0.035 | 0.065 |
| Alberta | -0.023Table 3 Note † | 0.012 | -0.047Table 3 Note † | 0.028 |
| British Columbia | -0.020 | 0.013 | -0.045 | 0.031 |
| Territories | 0.096 | 0.090 | -0.003 | 0.140 |
Sources: Statistics Canada, 2006 and 2016 longitudinal census files. |
||||

Data table for Chart 9
| STEM occupations of men and women | Percent |
|---|---|
| Men | |
| Information systems analysts and consultants | 10.4 |
| Computer programmers and interactive media developers | 6.9 |
| Electrical and electronics engineering technologists | 5.4 |
| Civil engineers | 5.3 |
| Computer and information systems managers | 4.7 |
| Women | |
| Information systems analysts and consultants | 14.0 |
| Computer programmers and interactive media developers | 8.5 |
| Biologists and related scientists | 8.2 |
| Chemical technologists and technicians | 8.0 |
| Chemists | 5.5 |
|
Notes: STEM stands for science, technology, engineering and mathematics. The sample consisted of Canadian-born and immigrant individuals aged 25 to 54 in 2006 who completed a college, CEGEP or other non-university certificate or diploma or university certificate below a bachelor's degree, or a university degree in a STEM field of study; reported the same level of education in 2006 and 2016; had a STEM occupation in 2006; and had a non-STEM occupation in 2016. Sources: Statistics Canada, 2006 and 2016 longitudinal census files. |
|
Data table for Chart 10
| Non-STEM occupational groups of men and women |
Percent |
|---|---|
| Men | |
| Middle management occupations in trades, transportation, production and utilities |
11.3 |
| Specialized middle management occupations | 9.9 |
| Senior management occupations | 7.5 |
| Professional occupations in business and finance | 6.4 |
| Industrial, electrical and construction trades | 5.2 |
| Women | |
| Specialized middle management occupations | 10.3 |
| Professional occupations in law and social, community and government services |
10.2 |
| Professional occupations in business and finance | 9.8 |
| Administrative and financial supervisors and administrative occupations | 9.0 |
| Professional occupations in education services | 7.0 |
|
Notes: STEM stands for science, technology, engineering and mathematics. The sample consisted of Canadian-born and immigrant individuals aged 25 to 54 in 2006 who completed a college, CEGEP or other non-university certificate or diploma or university certificate below a bachelor's degree, or a university degree in a STEM field of study; reported the same level of education in 2006 and 2016; had a STEM occupation in 2006; and had a non-STEM occupation in 2016. Sources: Statistics Canada, 2006 and 2016 longitudinal census files. |
|
4.5 An examination of the earnings of STEM graduates: Does persisting in a STEM occupation pay off?
Studies comparing the earnings of postsecondary graduates by field of study found that STEM graduates earn more than non-STEM graduates (e.g., Hango 2013; Statistics Canada 2017a). However, graduates of some STEM fields work in higher-paying jobs than graduates of other STEM fields (Frenette and Frank 2016). Graduates working in STEM sectors have also been found to earn more than those working in other types of occupations (Caranci, Judge and Kobelak 2017). While these results suggest a general earnings advantage for STEM graduates, little is known about whether their persistence in a STEM occupation is positively associated with greater wage growth than their peers who left STEM occupations.
The primary purpose of the results presented in this section is to determine whether STEM graduates who persisted in a STEM occupation between 2006 and 2016 experienced greater wageNote growth than their counterparts who had moved to a non-STEM occupation by 2016, after accounting for their differences in sociodemographic and educational characteristics. For this part of the analysis, only STEM graduates who had a STEM occupation in 2006, were employed full year, full timeNote in both 2006 and 2016, and had positive wages in both 2006 and 2016 were included in the sample.
The dependent variable for this model measures the difference in respondents’ log wages between 2006 and 2016 (i.e., 2016 log wages minus 2006 log wages). The independent variables for this model include age group; marital status; presence of children younger than 6 in 2006; visible minority status; Aboriginal identity status; immigrant status; highest certificate, diploma or degree; STEM field of study; province or territory of birth (those born outside Canada are identified as a separate group);Note and a binary variable that identifies whether the respondent persisted in or exited a STEM occupation between 2006 and 2016.
Regression results for both men and women are presented in Table 4.
The analysis of wage changes between 2006 and 2016 indicated that individuals who persisted in a STEM occupation did not experience significantly greater earnings growth than their counterparts who had moved to a non-STEM occupation by 2016. This was true for both men and women, indicating that the wage growth of STEM graduates who exited a STEM occupation was similar to that of STEM graduates who remained in a STEM occupation.
The results also showed interesting relationships between STEM graduates’ sociodemographic characteristics and wage growth. For example, older men and women experienced lower earnings growth than their younger counterparts. However, visible minority status, Aboriginal identity and immigrant status were not statistically significant. This may be because the sample was limited to individuals who were working in similar occupations (STEM occupations) in 2006.
Moreover, the wage growth of single men was higher than that of married men, while women who were divorced, separated or widowed had lower earnings growth than their married counterparts. Furthermore, while the presence of young children was not significantly associated with the wage growth of men, women who had children younger than 6 in 2006 experienced higher wage growth than their counterparts who did not have young children. Again, this finding may be attributable to the particular sample examined, as only women who were employed in a STEM occupation in 2006 were included in this part of the analysis.
The field of study results also indicated that, among men, mathematics and computer and information science graduates experienced lower wage growth than their engineering and engineering technology counterparts. Similarly, the wage growth of women who studied physical or chemical sciences was lower than that of women who studied engineering or engineering technology.
Lastly, since senior management occupations was one of the top occupational groups to which male STEM “leavers” moved (see Chart 10), additional models were run which excluded individuals who had moved to these occupations by 2016Note because they likely earn much higher wages than individuals who moved into other types of non-STEM occupations. The results from these models supported the conclusion that the wage growth of men and women who persisted in a STEM occupation did not differ significantly from their counterparts who moved to a non-STEM occupation.
| Men | Women | |||
|---|---|---|---|---|
| coefficient | standard error | coefficient | standard error | |
| Age group (2006) (reference group: 25 to 34) | ||||
| 35 to 44 | -0.202Note *** | 0.020 | -0.103Note ** | 0.036 |
| 45 to 54 | -0.326Note *** | 0.024 | -0.192Note *** | 0.044 |
| Marital status (2006) (reference group: married or common law) | ||||
| Single or never married | 0.071Note ** | 0.022 | -0.006 | 0.038 |
| Separated, divorced or widowed | -0.033 | 0.057 | -0.086Table 4 Note † | 0.049 |
| Presence of young children in 2006 (reference group: did not have children younger than 6) | -0.005 | 0.019 | 0.171Note *** | 0.048 |
| Visible minority status (reference group: not a visible minority) | -0.014 | 0.024 | -0.026 | 0.063 |
| Aboriginal identity (reference group: does not identify as member of Aboriginal group) | 0.062 | 0.057 | 0.085 | 0.069 |
| Immigrant status (reference group: Canadian-born) | -0.016 | 0.078 | -0.174 | 0.176 |
| Highest certificate, diploma or degree (reference group: bachelor's degree) | ||||
| College, CEGEP or other non-university certificate or diploma or university certificate below a bachelor's degree | -0.031 | 0.019 | 0.000 | 0.031 |
| University degree above a bachelor's degree | 0.050Table 4 Note † | 0.026 | 0.033 | 0.049 |
| Location of study (reference group: outside Canada) | -0.011 | 0.029 | -0.087 | 0.067 |
| STEM field of study (reference group: engineering and engineering technology) | ||||
| Physical and chemical sciences | -0.027 | 0.048 | -0.130Note * | 0.051 |
| Biological, general and integrated sciences | -0.038 | 0.042 | -0.015 | 0.055 |
| Mathematics and computer and information sciences | -0.047Note ** | 0.017 | -0.047 | 0.032 |
| Area of birth (reference group: Ontario) | ||||
| Newfoundland and Labrador | 0.077Table 4 Note † | 0.042 | 0.099 | 0.096 |
| Prince Edward Island | 0.230 | 0.145 | 0.247Table 4 Note † | 0.144 |
| Nova Scotia | -0.031 | 0.081 | 0.076 | 0.099 |
| New Brunswick | 0.036 | 0.032 | 0.028 | 0.053 |
| Quebec | 0.002 | 0.022 | 0.035 | 0.032 |
| Manitoba | 0.060 | 0.041 | 0.072 | 0.115 |
| Saskatchewan | 0.051 | 0.064 | 0.076 | 0.111 |
| Alberta | 0.138Note ** | 0.044 | 0.072 | 0.051 |
| British Columbia | 0.015 | 0.048 | 0.132Note * | 0.060 |
| Territories | 0.171 | 0.118 | 0.020 | 0.108 |
| Born outside Canada | 0.054 | 0.077 | 0.255 | 0.164 |
| Persisted in a STEM occupation | -0.012 | 0.022 | 0.050 | 0.037 |
Sources: Statistics Canada, 2006 and 2016 longitudinal census files. |
||||
5 Conclusion
Although many studies have examined women’s persistence in STEM fields throughout their education, less is known about the occupational pathways of women with STEM credentials and how they compare with their male peers. This study addressed this gap by conducting a gender analysis of the occupational mobility of STEM graduates in Canada and providing detailed results by different STEM fields of study.
Similar to previous research (e.g., Statistics Canada 2017a), the results indicated that men were more likely than women to be employed in a STEM occupation. Furthermore, the occupational pathways of women and men with STEM credentials differed. For example, more than 3 in 10 men were employed in a STEM occupation in both 2006 and 2016, compared with 2 in 10 women. The majority of women were not employed in a STEM occupation in either year.
Differences in the occupational pathways of men and women with STEM credentials were attributable in part to their specific field of study choices. In this study, over half of male STEM graduates had studied engineering or engineering technology, compared with less than one-quarter of female STEM graduates. Conversely, over one-third of female STEM graduates had studied biological, general or integrated sciences, compared with 12.5% of men. However, previous research indicates that engineering graduates were generally more likely than life science graduates to work in STEM occupations (Statistics Canada 2017a). Furthermore, Frenette and Frank (2017) found that physical and life science graduates tended to be employed across a wider range of occupations than engineering graduates, and many of these occupations were in non-STEM fields.
Among STEM graduates who were employed in a STEM occupation in 2006, women were more likely than men to have moved to a non-STEM occupation by 2016. Previous literature indicates that this difference may be due to differing career goals or interests. For example, Fouad et al. (2017) found that women had a greater tendency to leave engineering occupations and attributed this decision to factors such as an interest in applying their skills in another field, a desire to find work that makes a greater contribution to the community, or unmet expectations related to promotions or status within their field. Previous longitudinal research also found that much of the attrition of women in STEM occupations in the United States occurred during their first few years on the job (Glass et al. 2013). While data on job tenure were not available for this study, further research into this finding in the Canadian context would lead to a better understanding of women’s retention in STEM occupations.
This study also found that STEM graduates who had studied physical or chemical sciences or biological, general or integrated sciences were more likely to exit STEM occupations than their engineering or engineering technology counterparts. This was true for both women and men. However, some field of study differences were observed. Men who studied mathematics or computer and information sciences were less likely than their counterparts who studied engineering or engineering technology to exit a STEM occupation between 2006 and 2016, while there was no statistically significant difference among women who studied in these two fields. The degree of occupational mobility among graduates of particular STEM fields could depend on the extent to which these graduates can apply their skills to a range of jobs, their professional networks or their preference for different types of work.
Family obligations are often identified as an important factor in women’s labour market decisions. Research from the United States found that mothers and fathers of young children were more likely than their childless peers to exit STEM occupations (Cech and Blair-Loy 2019). However, results from this study showed that the presence of young children was not associated with the likelihood of exiting a STEM occupation for either women or men. Data limitations may be the reason for these differing results. Cech and Blair-Loy (2019) used data on parental leave, as well as knowledge of exactly when STEM workers’ children were born. In addition to this lack of detail in the longitudinal census data files, the longer period of study may have also contributed to different findings. Furthermore, the divergent results could stem from differences in the parental leave policies of Canada and the United States.
Previous research has also found that graduates who work in occupations closely related to their fields of study have higher earnings than those who do not (Xu 2013). This study measured wage growth, providing an indication of how STEM graduates’ wages changed between 2006 and 2016, depending on whether they remained in a STEM occupation or moved to a non-STEM occupation. The findings indicated that the wage growth of women and men who persisted in a STEM occupation between these years did not differ significantly from that of their counterparts who had moved to non-STEM occupations. Therefore, while STEM occupations may be higher paying than non-STEM occupations on average (Xu 2015), STEM graduates who exited a STEM occupation did not experience lower wage growth than their peers who persisted in a STEM occupation.
The results of this study help fill the information gap on the occupational mobility of STEM graduates in Canada. However, data limitations hindered a more thorough investigation of some questions of interest. For example, restricting the sample to only those who responded to the 2006 and 2016 census long-form questionnaires prevented additional occupational information from being analyzed. While the inclusion of 2011 National Household Survey data could provide a more detailed picture of the occupational mobility of STEM graduates over time, it would also substantially decrease the sample size, potentially preventing specific groups from being analyzed (e.g., women in particular STEM fields). Additionally, data on parental leave would provide a more nuanced understanding of the relationship between parenthood—particularly among new parents—and the occupational changes of STEM graduates. Lastly, because of a lack of historical information on job vacancies in STEM occupations, it is difficult to ascertain how labour market opportunities may have affected the employment of STEM graduates in these occupations over the years studied. Future research would benefit from addressing these data and knowledge gaps.
The results of this study can help inform educators and policy makers about how the occupational pathways of different groups of STEM graduates vary, which would provide a better understanding of where policy interventions may be needed.
Appendices
| NOC-S 2006 | NOC 2016 | ||
|---|---|---|---|
| Code | Occupational title | Code | Occupational title |
| A121 | Engineering managers | 0211 | Engineering managers |
| A122 | Computer and information systems managers | 0212 | Architecture and science managers |
| A123 | Architecture and science managers | 0213 | Computer and information systems managers |
| C011 | Physicists and astronomers | 2111 | Physicists and astronomers |
| C012 | Chemists | 2112 | Chemists |
| C013 | Geologists, geochemists and geophysicists | 2113 | Geoscientists and oceanographers |
| C014 | Meteorologists | 2114 | Meteorologists and climatologists |
| C015 | Other professional occupations in physical sciences | 2115 | Other professional occupations in physical sciences |
| C021 | Biologists and related scientists | 2121 | Biologists and related scientists |
| C022 | Forestry professionals | 2122 | Forestry professionals |
| C023 | Agricultural representatives, consultants and specialists | 2123 | Agricultural representatives, consultants and specialists |
| C031 | Civil engineers | 2131 | Civil engineers |
| C032 | Mechanical engineers | 2132 | Mechanical engineers |
| C033 | Electrical and electronics engineers | 2133 | Electrical and electronics engineers |
| C034 | Chemical engineers | 2134 | Chemical engineers |
| C041 | Industrial and manufacturing engineers | 2141 | Industrial and manufacturing engineers |
| C042 | Metallurgical and materials engineers | 2142 | Metallurgical and materials engineers |
| C043 | Mining engineers | 2143 | Mining engineers |
| C044 | Geological engineers | 2144 | Geological engineers |
| C045 | Petroleum engineers | 2145 | Petroleum engineers |
| C046 | Aerospace engineers | 2146 | Aerospace engineers |
| C047 | Computer engineers (except software engineers and designers) | 2147 | Computer engineers (except software engineers and designers) |
| C048 | Other professional engineers, n.e.c. | 2148 | Other professional engineers, n.e.c. |
| C051 | Architects | 2151 | Architects |
| C052 | Landscape architects | 2152 | Landscape architects |
| C053 | Urban and land use planners | 2153 | Urban and land use planners |
| C054 | Land surveyors | 2154 | Land surveyors |
| C061 | Mathematicians, statisticians and actuaries | 2161 | Mathematicians, statisticians and actuaries |
| C071 | Information systems analysts and consultants | 2171 | Information systems analysts and consultants |
| C072 | Database analysts and data administrators | 2172 | Database analysts and data administrators |
| C073 | Software engineers and designers | 2173 | Software engineers and designers |
| C074 | Computer programmers and interactive media developers | 2174 | Computer programmers and interactive media developers |
| C075 | Web designers and developers | 2175 | Web designers and developers |
| C111 | Chemical technologists and technicians | 2211 | Chemical technologists and technicians |
| C112 | Geological and mineral technologists and technicians | 2212 | Geological and mineral technologists and technicians |
| C113 | Meteorological technicians | N/A | Not applicable |
| C121 | Biological technologists and technicians | 2221 | Biological technologists and technicians |
| C122 | Agricultural and fish products inspectors | 2222 | Agricultural and fish products inspectors |
| C123 | Forestry technologists and technicians | 2223 | Forestry technologists and technicians |
| C124 | Conservation and fishery officers | 2224 | Conservation and fishery officers |
| C125 | Landscape and horticultural technicians and specialists | 2225 | Landscape and horticulture technicians and specialists |
| C131 | Civil engineering technologists and technicians | 2231 | Civil engineering technologists and technicians |
| C132 | Mechanical engineering technologists and technicians | 2232 | Mechanical engineering technologists and technicians |
| C133 | Industrial engineering and manufacturing technologists and technicians | 2233 | Industrial engineering and manufacturing technologists and technicians |
| C141 | Electrical and electronics engineering technologists and technicians | 2241 | Electrical and electronics engineering technologists and technicians |
| C142 | Electronic service technicians (household and business equipment) | 2242 | Electronic service technicians (household and business equipment) |
| C143 | Industrial instrument technicians and mechanics | 2243 | Industrial instrument technicians and mechanics |
| C144 | Aircraft instrument, electrical and avionics mechanics, technicians and inspectors | 2244 | Aircraft instrument, electrical and avionics mechanics, technicians and inspectors |
| C151 | Architectural technologists and technicians | 2251 | Architectural technologists and technicians |
| C152 | Industrial designers | 2252 | Industrial designers |
| C153 | Drafting technologists and technicians | 2253 | Drafting technologists and technicians |
| C154 | Land survey technologists and technicians | 2254 | Land survey technologists and technicians |
| C155 | Mapping and related technologists and technicians | 2255 | Technical occupations in geomatics and meteorology |
| C161 | Non-destructive testers and inspectors | 2261 | Non-destructive testers and inspection technicians |
| C162 | Engineering inspectors and regulatory officers | 2262 | Engineering inspectors and regulatory officers |
| C171 | Air pilots, flight engineers and flying instructors | 2271 | Air pilots, flight engineers and flying instructors |
| C172 | Air traffic control and related occupations | 2272 | Air traffic controllers and related occupations |
| C181 | Computer network technicians | 2281 | Computer network technicians |
| C182 | User support technicians | 2282 | User support technicians |
| C183 | Systems testing technicians | 2283 | Information systems testing technicians |
|
Note: STEM stands for science, technology, engineering and mathematics. Source: Statistics Canada, Picot and Hou (forthcoming 2019). |
|||
| Non-STEM occupational groups | Share |
|---|---|
| percent | |
| Men | |
| Physical and chemical sciences | |
| Professional occupations in law and social, community and government services | 12.0 |
| Middle management occupations in trades, transportation, production and utilities | 8.8 |
| Senior management occupations | 7.6 |
| Professional occupations in education services | 6.8 |
| Processing, manufacturing and utilities supervisors and central control operators | 6.4 |
| Biological, general and integrated sciences | |
| Professional occupations in law and social, community and government services | 14.2 |
| Specialized middle management occupations | 11.1 |
| Senior management occupations | 8.3 |
| Middle management occupations in trades, transportation, production and utilities | 6.2 |
| Professional occupations in business and finance | 5.7 |
| Engineering and engineering technology | |
| Middle management occupations in trades, transportation, production and utilities | 15.0 |
| Specialized middle management occupations | 8.1 |
| Senior management occupations | 7.2 |
| Industrial, electrical and construction trades | 7.0 |
| Maintenance and equipment operation trades | 5.6 |
| Mathematics and computer and information sciences | |
| Specialized middle management occupations | 15.8 |
| Professional occupations in business and finance | 12.1 |
| Senior management occupations | 8.1 |
| Administrative and financial supervisors and administrative occupations | 6.2 |
| Middle management occupations in retail and wholesale trade and customer services | 5.3 |
| Women | |
| Physical and chemical sciences | |
| Specialized middle management occupations | 10.9 |
| Professional occupations in education services | 10.1 |
| Office support occupations | 7.8 |
| Professional occupations in law and social, community and government services | 7.8 |
| Care providers and educational, legal and public protection support occupations | 6.2 |
| Biological, general and integrated sciences | |
| Professional occupations in law and social, community and government services | 18.1 |
| Professional occupations in education services | 9.7 |
| Technical occupations in health | 8.6 |
| Specialized middle management occupations | 7.0 |
| Professional occupations in business and finance | 7.0 |
| Engineering and engineering technology | |
| Middle management occupations in trades, transportation, production and utilities | 11.5 |
| Specialized middle management occupations | 10.6 |
| Professional occupations in business and finance | 9.8 |
| Administrative and financial supervisors and administrative occupations | 8.9 |
| Office support occupations | 6.1 |
| Mathematics and related studies, computer and information sciences | |
| Professional occupations in business and finance | 16.9 |
| Administrative and financial supervisors and administrative occupations | 15.1 |
| Specialized middle management occupations | 13.6 |
| Office support occupations | 6.5 |
| Professional occupations in law and social, community and government services | 6.5 |
|
Note: STEM stands for science, technology, engineering and mathematics. Sources: Statistics Canada, 2006 and 2016 longitudinal census files. |
|

Data table for Chart A1
| Labour market pathways | Men | Women |
|---|---|---|
| percent | ||
| Persisted in STEM occupation | 69.0 | 59.4 |
| Exited STEM occupation | 24.7 | 31.5 |
| Exited the labour force | 6.4 | 9.1 |
|
Notes: STEM stands for science, technology, engineering and mathematics. The sample consisted of Canadian-born and immigrant individuals aged 25 to 54 in 2006 who completed a college, CEGEP or other non-university certificate or diploma or university certificate below a bachelor's degree, or a university degree in a STEM field of study and reported the same level of education in 2006 and 2016. Sources: Statistics Canada, 2006 and 2016 longitudinal census files. |
||
References
Blickenstaff, J.C. 2005. “Women and science careers: Leaky pipeline or gender filter?” Gender and Education 17 (4): 369–386.
Broyles, P. 2009. “The gender pay gap of STEM professions in the United States.” International Journal of Sociology and Social Policy 29 (5/6): 214–226.
Caranci, B., K. Judge, and O. Kobelak. 2017. Women and STEM: Bridging the Divide. September 12. TD Economics. Available at: http://economics.td.com/women-and-stem-bridging-divide (accessed December 20, 2018).
Cech, E.A., and M. Blair-Loy. 2019. “The changing career trajectories of new parents in STEM.” Proceedings of the National Academy of Sciences of the United States of America 116 (10): 4182–4187. DOI: 10.1073/pnas.1810862116.
Chaykowski, R.P., and L.M. Powell. 1999. “Women and the labour market: Recent trends and policy issues.” Canadian Public Policy 25 (S1): S1–S25.
Chen, X. 2015. “STEM attrition among high-performing college students in the United States: Scope and potential causes.” Journal of Technology and Science Education 5 (1): 41–59.
Council of Canadian Academies. 2015. Some Assembly Required: STEM Skills in Canada’s Economic Productivity. Ottawa: Council of Canadian Academies.
Dan, I. 2010. Gender Based Self-Selection Into Industries and Occupations. Toronto: Department of Economics University of Toronto. Available at: http://www.hec.ca/iea/seminaires/110124_IoanaDan.pdf (accessed February 26, 2019). Manuscript.
Dasgupta, N., and J.G. Stout. 2014. “Girls and women in science, technology, engineering, and mathematics: STEMing the tide and broadening participation in STEM careers.” Policy Insights from the Behavioral and Brain Sciences 1 (1): 21–29.
Diekman, A.B., E.S. Weisgram, and A.L. Belanger. 2015. “New routes to recruiting and retaining women in STEM: Policy implications of a communal goal congruity perspective.” Social Issues and Policy Review 9 (1): 52–88.
Dionne-Simard, D., D. Galarneau, and S. LaRochelle-Côté. 2016. Women in Scientific Occupations in Canada. Insights on Canadian Society. Statistics Canada Catalogue no. 75-006-X. Ottawa: Statistics Canada.
Engineers Canada and Geoscientists Canada. 2016. Managing Transitions: Before, During and After Leave.Available at: https://engineerscanada.ca/sites/default/files/Managing-Transitions-en.pdf (accessed June 25, 2018).
Ferguson, S.J. 2016. “Women and education: Qualifications, skills and technology.” Women in Canada: A Gender-based Statistical Report, 7th edition. Statistics Canada Catalogue no. 89-503-X. Ottawa: Statistics Canada.
Fouad, N.A., W-H. Chang, M. Wan, and R. Singh. 2017. “Women’s reasons for leaving the engineering field.” Frontiers in Psychology 8 (875): 1–11. DOI: 10.3389/fpsyg.2017.00875.
Frenette, M., and K. Frank. 2016. Earnings of Postsecondary Graduates by Detailed Field of Study. Economic Insights, no. 56. Statistics Canada Catalogue no. 11-626-X. Ottawa: Statistics Canada.
Frenette, M., and K. Frank. 2017. Do Postsecondary Graduates Land High-skilled Jobs? Analytical Studies Branch Research Paper Series, no. 388. Statistics Canada Catalogue no. 11F0019M. Ottawa: Statistics Canada.
George-Jackson, C.E. 2011. “STEM switching: Examining departures of undergraduate women in STEM fields.” Journal of Women and Minorities in Science and Engineering 17 (2): 149–171.
Glass, J.L., S. Sassler, Y. Levitte, and K.M. Michelmore. 2013. “What’s so special about STEM? A comparison of women’s retention in STEM and professional occupations.” Social Forces 92 (2): 723–756.
Hango, D. 2013. Gender Differences in Science, Technology, Engineering, Mathematics and Computer Science (STEM) Programs at University. Insights on Canadian Society. Statistics Canada Catalogue no. 75-006-X. Ottawa: Statistics Canada.
Herrmann, M., and C. Machado. 2012. Patterns of Selection in Labor Market Participation. Paper presented at the 11th IZA/SOLE Transatlantic Meeting of Labor Economists.
Landivar, L.C. 2013. “Disparities in STEM employment by sex, race and Hispanic origin.” American Community Survey Reports ACS-24. Washington, D.C.: U.S. Census Bureau.
Lemieux, T., and W.C. Riddell. 2015. “Who are Canada’s top 1 percent?” In Income Inequality: The Canadian Story, ed. D.A. Green, W.C.
Riddell, and F. St-Hilaire, The Art of the State Series, Vol. 5, Part 1: Inequality Trends in Canada, p. 103–155. Montréal: Institute for Research on Public Policy.
Maltese, A.V., and R.H. Tai. 2011. “Pipeline persistence: Examining the association of educational experiences with earned degrees in STEM among U.S. students.” Science Education Policy 95 (5): 877–907.
Mavriplis, C., R. Heller, C. Beil, K. Dam, N. Yassinskaya, M. Shaw, and C. Sorensen. 2010. “Mind the gap: Women in STEM career breaks.” Journal of Technology Management and Innovation 5 (1): 140–151.
Miller, D.I., and J. Wai. 2015. “The bachelor’s to Ph.D. STEM pipeline no longer leaks more women than men: A 30-year analysis.” Frontiers in Psychology 6 (37): 1–10.
Mortillaro, N. 2018. “Women encouraged to pursue STEM careers, but many not staying.” CBC News. March 8. Available at: http://www.cbc.ca/news/technology/women-in-stem-1.4564384 (accessed June 20, 2018).
Picot, G., and F. Hou. 2018. “Immigrant STEM workers in the Canadian economy: Skill utilization and earnings.” Canadian Public Policy 44 (S1): S113–S124.
Picot, G., and F. Hou. The Skill Utilization and Earnings of STEM Educated Immigrants in Canada: Differences by Degree Level and Field of Study. Ottawa: Statistics Canada. Forthcoming 2019.
Preston, A.E. 2004. Leaving Science: Occupational Exit from Scientific Careers. New York: Russell Sage Foundation.
Richards, E. 2019. Who are the Working Women in Canada’s Top 1%? Analytical Studies Branch Research Paper Series, no. 414. Statistics Canada Catalogue no. 11F0019M. Ottawa: Statistics Canada.
Statistics Canada. 2016. Data tables, 2016 Census of Population. Catalogue no. 98-400-X2016263.Available at https://www12.statcan.gc.ca/census-recensement/2016/dp-pd/dt-td/Rp-eng.cfm?LANG=E&APATH=3&DETAIL=0&DIM=0&FL=A&FREE=0&GC=0&GID=0&GK=0&GRP=1&PID=111841&PRID=10&PTYPE=109445&S=0&SHOWALL=0&SUB
=0&Temporal=2017&THEME=123&VID=0&VNAMEE=&VNAMEF Accessed July 18, 2019.
Statistics Canada. 2017a. Is field of study a factor in the earnings of young bachelor’s degree holders? Census in Brief. Statistics Canada Catalogue no. 98-200-X. Ottawa: Statistics Canada.
Statistics Canada. 2017b. Are young bachelor’s degree holders finding jobs that match their studies? Census in Brief. Statistics Canada Catalogue no. 98-200-X. Ottawa: Statistics Canada.
Statistics Canada. 2018. Variant of CIP 2016 – STEM and BHASE groupings. Last updated March 29, 2018. Available at: http://www23.statcan.gc.ca/imdb/p3VD.pl?Function=getVD&TVD=401856 (accessed June 21, 2018).
Turcotte, M. 2011. “Women and education.” In Women in Canada: A Gender-based Statistical Report. Statistics CanadaCatalogue no. 89-503-X. Ottawa: Statistics Canada.
Wall, K. 2019. Persistence and Representation of Women in STEM Programs. Insights on Canadian Society. Statistics Canada Catalogue no. 75-006-X. Ottawa: Statistics Canada.
White, J.L., and G.H. Massiha. 2016. “The retention of women in science, technology, engineering, and mathematics: A framework for persistence.” International Journal of Evaluation and Research in Education 5 (1): 1–8.
Xu, Y. 2015. “Focusing on women in STEM: A longitudinal examination of gender-based earning gap of college graduates.” The Journal of Higher Education 86 (4): 489–523.
Xu, Y.J. 2013. “Career outcomes of STEM and non-STEM college graduates: Persistence in majored-field and influential factors in career choices.” Research in Higher Education 54 (3): 349–382.
- Date modified: