
Analytical Studies Branch Research Paper Series
How Do Women in Male-dominated Apprenticeships Fare in the Labour Market?

Archived Content
Information identified as archived is provided for reference, research or recordkeeping purposes. It is not subject to the Government of Canada Web Standards and has not been altered or updated since it was archived. Please "contact us" to request a format other than those available.
Abstract
Increasing women’s participation in male-dominated trades has been identified as a means of improving the supply of skilled tradespersons in Canada, creating a more diverse workforce, and increasing women’s wages. However, little information exists about women’s decision to enter male-dominated apprenticeship programs and their subsequent labour market outcomes. This study addresses both information gaps by examining the characteristics associated with women selecting male-dominated apprenticeship programs and their labour market outcomes relative to men who selected the same types of programs. A range of outcomes are examined, including employment status, self-employment, obtaining a job related to the trade of study, hours worked per week, union membership, a series of job benefits (such as extended health care, sick leave, and retirement plan benefits) and hourly wages. Results indicate that women who were Canadian-born, who were older, or who had a father with a trades certificate were more likely than other female apprentices to choose a male-dominated program. Women who studied in male-dominated apprenticeship programs generally had poorer labour market outcomes than their male counterparts. Among apprentices who selected male-dominated programs, women were as likely as men to receive sick leave benefits in their jobs but received lower median hourly wages than men. Fewer gender differences were found among apprentices who selected female-dominated or mixed (neither male- nor female-dominated) programs. However, while the median wages of women who studied in female-dominated or mixed apprenticeship programs did not differ significantly from those of their male counterparts, these women did earn less than men at the higher end of the wage distribution (75th percentile).
Keywords: apprenticeship, labour market outcomes, postsecondary education, skilled trades, women
Executive summary
Although women’s labour force participation increased substantially over the last several decades, women continue to be underrepresented within the skilled trades. Increasing women’s participation in male-dominated trades has been identified as a means of improving the supply of skilled tradespersons in Canada, creating a more diverse labour force and increasing women’s wages.
Female apprentices are concentrated in a few female-dominated programs, such as hairstylist or esthetician. Research has shown substantial differences between the wages of workers in male-dominated and female-dominated trades (Boothby and Drewes 2010); however, less is known about how women who studied in male-dominated apprenticeship programs fare compared with their male counterparts.
This study examined the characteristics associated with women selecting male-dominated apprenticeship programs and men selecting female-dominated programs. The labour market outcomes of female apprentices relative to those of men who selected the same types of apprenticeship programs were also studied. The following questions were addressed:
- What proportion of female apprentices select male-dominated apprenticeship programs, and what proportion of male apprentices select female-dominated programs?
- Among apprentices, what characteristics are associated with women selecting male-dominated programs and men selecting female-dominated programs?
- What are the labour market outcomes of women who selected male-dominated apprenticeship programs relative to those of men who selected the same types of programs?
To answer these questions, this study uses the 2015 National Apprenticeship Survey (NAS), which contains a nationally representative sample of apprentices who completed or discontinued their programs in 2011, 2012 or 2013. The 2015 NAS was also linked to four years of tax data (2011 to 2014) from the T1 Family File (T1FF). Male-dominated programs were defined as those programs in which men accounted for at least 75% of apprentices. Similarly, female-dominated programs were those in which women accounted for at least 75% of apprentices. All other programs were classified as “mixed” (neither male- nor female-dominated).
Overall, just over one in five (20.7%) female apprentices were in male-dominated programs. By contrast, only 0.5% of male apprentices selected female-dominated programs. Women in male-dominated programs were concentrated in welder or other machining or metal forming, electrician, carpenter or cabinetmaker.
Results indicated that female apprentices who were Canadian-born, older, had a father with a trades certificate, or had participated in a Youth Apprenticeship Program (YAP) or a trade, vocational or technical program during high school were more likely than other female apprentices to choose to study in a male-dominated apprenticeship program. Among male apprentices, previous certification in a trade or having participated in a YAP or trade, vocational or technical program during high school was negatively associated with selecting a female-dominated program.
Women who studied in male-dominated apprenticeship programs generally had poorer labour market outcomes than their male counterparts. Among apprentices who selected male-dominated programs, women were as likely as men to receive sick leave benefits in their jobs but received lower median hourly wages than men did. Fewer gender differences were found among apprentices who selected female-dominated or mixed (neither male- nor female-dominated) programs. However, while the median wages of women who studied in female-dominated or mixed apprenticeship programs did not differ significantly from those of their male counterparts, these women did earn less than men at the higher end of the wage distribution (75th percentile).
This study expands on previous research by providing more comprehensive information about the factors affecting female apprentices’ choice of a male-dominated apprenticeship program and the labour market prospects of women who study these trades. The findings presented can increase women’s awareness and knowledge of these trades and aid in their selection of an apprenticeship program. Policymakers can also use these findings to facilitate women’s entry into male-dominated apprenticeship programs.
1 Introduction
Women’s participation in the Canadian labour force has increased substantially over the last several decades (Morissette 2015). Although this increase has contributed to more women entering male-dominated occupations, women continue to account for a small proportion of workers in these jobs overall. Canadian women are still largely concentrated in historically female-dominated occupations, such as teaching, nursing and related health occupations, social work, and sales and service occupations (Moyser 2017).Note 1 Occupational segregation by sex is particularly pronounced among Canadians who do not hold a university degree (Uppal and LaRochelle-Côté 2014).
Increasing women’s participation in the skilled trades has been identified as a means of creating a more diverse labour force, improving women’s wages, and fully utilizing women’s skills (Ericksen and Palladino Schultheiss 2009; Greene and Stitt-Gohdes 1997). Concerns have also been expressed about the supply of skilled tradespersons in an aging Canadian workforce (Carey 2014; Pyper 2008).Note 2 Greater interest from women in pursuing these occupations could help address these concerns. However, results from the 2015 National Apprenticeship Survey (NAS) indicate that only about 1 in 10 Canadian apprentices are women and that most of them are concentrated in female-dominated programs (Frank and Jovic 2017; Laryea and Medu 2010).Note 3
Very little is known about the factors influencing the decision of female apprentices to pursue male-dominated programs.Note 4 This study addresses that information gap with information available from the 2015 NAS. Previous research has suggested that pre-program information, such as highest level of education or whether an apprentice’s parents held a trades certificate, can be particularly useful in examining this issue.
One factor that could play an important role in female apprentices’ program selection is knowledge of the labour market outlook for women in male-dominated trades. This warrants a separate analysis, and that is the approach adopted in this study.
Most studies that have examined the labour market outcomes of apprentices have focused on comparing their earnings to those of graduates with different levels of education. Results from the 2016 Census showed that Canadian men who held apprenticeship certificates earned more than their peers whose highest level of education was a high school diploma or college diploma (Statistics Canada 2017a). However, the same was not true for women. Female apprentices earned about 12% less than women who held only a high school diploma.Note 5 Previous studies found similar differences and attributed female apprentices’ lower earnings to their selection of apprenticeship programs in lower-paying trades (Gunderson and Krashinsky 2012; Boothby and Drewes 2010).
To further explore how women’s selection of apprenticeship programs factor into their labour market outcomes, Boothby and Drewes (2010) compared the earnings of women in male-dominated trades with those of their peers whose highest level of education was a high school diploma. The results showed that women who selected male-dominated trades earned about 27% more than women with a high school diploma. These results suggest that female apprentices who choose to study in a male-dominated apprenticeship program have more favourable labour market outcomes than those who study in female-dominated programs.
Although research shows notable wage differences between apprentices who studied in male-dominated and female-dominated programs, one question that has not been addressed is how well female apprentices fare in the labour market relative to their male counterparts who studied the same type of program. This study examines differences in the labour market outcomes of women and men who selected the same type of apprenticeship program, identified as male-dominated, mixed (neither male- nor female-dominated), or female-dominated. A wide range of outcomes are examined, including employment status, self-employment, obtaining a job related to the trade of study, hours worked per week, union membership, a series of job benefits, and hourly wages.
By providing a more detailed picture of women’s labour market prospects after studying in male-dominated apprenticeship programs, women can obtain a clearer idea of what to expect from this type of career choice.
This study addresses the following questions:
- What proportion of female apprentices select male-dominated apprenticeship programs and what proportion of male apprentices select female-dominated programs?
- Among apprentices, what characteristics are associated with women selecting male-dominated programs and men selecting female-dominated programs?
- What are the labour market outcomes of women who selected male-dominated apprenticeship programs relative to those of men who selected the same type of program?
This paper is organized as follows. Section 2 reviews the data and methodology. Results are discussed in Section 3. Section 4 concludes, providing an overview of the findings.
2 Data and methodology
Data from the 2015 National Apprenticeship Survey (NAS) were used in this study. The NAS is a cross-sectional survey that sampled registered apprentices in Canada who ended (i.e., completed or discontinued) their program in 2011, 2012 or 2013. The data were collected from September 2015 to March 2016 and linked to four years of tax data (2011 to 2014) from the T1 Family File (T1FF). The sample size is 28,359.Note 6
The categorization of apprenticeship programs was based primarily on the 25 major trade groups used in the Registered Apprenticeship Information System (RAIS), an administrative database that collects information about registered apprentices from Canada’s provinces and territories. Programs were first assessed using National Occupational Classification (NOC) codes (four-digit level) that were associated with each program. Programs that were classified in a male-dominated RAIS major group but were female-dominated or mixed (neither male- nor female-dominated) at the four-digit NOC level were removed from the major group and reclassified to either the female-dominated or mixed group of programs.Note 7 The focus of this study was to examine women who were registered in male-dominated apprenticeship programs. However, comparisons between women and men in female-dominated apprenticeship programs and “mixed” programs (i.e., neither male- nor female-dominated) were also made. Overall, women accounted for 13.7% of the NAS sample.Note 8
2.1 Analysis of women’s selection of male-dominated apprenticeship programs
This study is divided into two analytical sections. The first section is a multivariate analysis in which women’s selection of a male-dominated apprenticeship program (conditional on completing or discontinuing an apprenticeship program) is regressed on sociodemographic characteristics by ordinary least squares (OLS). These characteristics include
- age at the time of registration in the apprenticeship program
- age squared
- highest certificate, diploma or degree completed prior to entering the apprenticeship program
- immigrant status
- father has a trades certificate
- mother has a trades certificate
- apprentice participated in a Youth Apprenticeship Program (YAP) or a trade, vocational or technical program in high schoolNote 9
- province or territory of program of study.
Year of registration fixed effects were also included in the model. A second OLS model was run for male apprentices. This model examined the relationships between the same set of characteristics and the likelihood of selecting a female-dominated apprenticeship program.Note 10
For the selection models, all apprenticeship programs were included in the analysis and identified as either male- or female-dominated programs. A “male-dominated” apprenticeship program was defined as one in which men accounted for at least 75% of apprentices in the program.Note 11 Similarly, a “female-dominated” apprenticeship program was defined as one in which women accounted for at least 75% of apprentices in the program. Programs that met neither of these criteria were classified as “mixed” programs.Note 12 In these cases, programs were coded as zero for both the male-dominated and female-dominated indicator variables.Note 13 A list of the apprenticeship programs included in the male-dominated, mixed, and female-dominated groups and the proportion of men and women represented in each are presented in Appendix Table 1.
2.2 Analysis of labour market outcomes
The second analytical section examines the labour market outcomes of women by type of apprenticeship program (male-dominated, mixed, or female-dominated).
Descriptive results (means) are presented for all labour outcomes by sex across the three apprenticeship program groups. Median hourly wages are also provided for the hourly wage outcome.Note 14 For this part of the analysis, only those apprentices who had valid information about their employment status, age and program completion status were examined. These restrictions reduced the analytical samples by less than 1%.Note 15 Differences that are discussed refer primarily to the descriptive findings. However, multivariate analyses were also conducted to examine the statistical significance of gender differences and to verify whether differences between men and women remained after accounting for other factors.Note 16 Any notable changes in the findings resulting from the multivariate models are reported.
The first labour market outcome is a measure of whether apprentices were employed during the week prior to their NAS interview (i.e., the reference week). Specifically, apprentices were asked whether they had worked in a job or business during the reference week. The second outcome measured is the likelihood of being self-employed. Only those apprentices who were employed during the reference week were examined for the self-employment measure.
For the remaining labour market outcomes, only paid employees were examined. These measures include
- holding a job related to the trade of study (as reported by the apprentice)Note 17
- hours worked per week
- union membership, measured as the payment of union dues in 2014 (determined from T1FF data)
- receipt of a series of benefits (i.e., extended health benefits, dental plan, retirement plan, paid vacation leave, sick leave and other benefits)
- median hourly wages.
Median regression models were used to compare the median log hourly wages of women and men who were apprentices in the same type of program. Wages were reported by NAS respondents according to the job they held the week prior to their NAS interview.Note 18 Since the primary objective of this study is to examine how women fare relative to men who studied the same type of apprenticeship program, the coefficient of interest is that associated with the sex variable (measured with a “female” indicator variable). Therefore, to obtain a baseline for comparison, the only covariate included in Model 1 was sex. Model 2 accounted for
- sex
- age at the time of survey (2015)
- age squared
- completion status (completed or discontinued program in 2011, 2012 or 2013)Note 19
- pre-apprenticeship experience in trade of study
- program of study (RAIS major groups)
- year of completion or discontinuation
- highest level of education in 2015
- year of registration fixed effects.
Census divisionNote 20 fixed effects were added in Model 3 to account for variations in local labour market conditions, as well as jurisdictional differences (e.g., provincial minimum wage laws or other factors that may affect specific trades). Model 4 included a variable that indicates whether an apprentice’s job was related to his/her trade of study and Model 5 included a measure of union membership (in 2014). The variables introduced in Models 3, 4 and 5 were included in a step-wise manner to address their possibly endogenous relationship with the variables introduced in earlier models.Note 21
The median regression coefficients and statistical significance for the female indicator variable for all models of the log hourly wage outcome are presented for each of the three types of apprenticeship programs. As a result of the large quantity of regression results produced, information for the other covariates is not presented in this paper but is available upon request.
Quantile regression results examining differences between women and men at different points in the wage distribution (25th and 75th percentiles) are also presented, accounting for all covariates listed above (Model 5).
3 Results
3.1 Male-dominated and female-dominated apprenticeship programs
The two analytical sections to follow (apprenticeship selection and labour market outcomes) rely on a classification of male- and female-dominated apprenticeships, which was described in the Data and methodology section.
Across the majority of male-dominated apprenticeship programs, men accounted for at least 90% of apprentices (Appendix Table 1).Note 22 Among female-dominated programs, 94.1% of apprentices were women. Apprentices in chef and cook programs and user support technician programs had more equal representations of men and women (62.3% male and 53.4% female, respectively).
Overall, 20.7% of female apprentices selected male-dominated apprenticeship programs. By contrast, only 0.5% of male apprentices selected female-dominated programs. Nearly one in five women who selected a male-dominated apprenticeship program were in welder or other machining or metal forming programs (19.7%), while slightly lower proportions chose electrician (18.5%) or carpenter or cabinetmaker (17.3%) programs.Note 23 The majority of men in a female-dominated program were hairstylist or barber apprentices (84.6%).Note 24,Note 25
3.2 Apprentices’ selection of male-dominated or female-dominated programs
Table 1 shows results for the OLS regressions of women’s selection of male-dominated apprenticeship programs and men’s selection of female-dominated programs on sociodemographic characteristics.Note 26
The likelihood of female apprentices selecting a male-dominated program increased with age. Immigrant women were less likely than Canadian-born women to select a male-dominated apprenticeship program. Moreover, women who had less than a high school education were less likely than those with only a high school diploma to select a male-dominated apprenticeship program. Women in all provinces and territories were more likely to select a male-dominated apprenticeship program than women in Ontario. This may be because many women in Ontario choose to study in early-childhood and assistants programs (female-dominated programs), which are not designated trades in other provinces and territories.
Parents’ certification in a trade also mattered. Previous qualitative research on Canadian women working in male-dominated trades found that having a father working in a trade was often influential to a woman’s decision to enter an apprenticeship program (Taylor, Hamm and Raykov 2015). Results from Table 1 support these findings, indicating that women whose father had a trades certificate were more likely to select male-dominated apprenticeship programs than those whose father did not have this training. However, mother’s certification in a trade was negatively associated with women selecting a male-dominated trade. Although the data do not indicate the type of trades certificate held by each parent, women may be influenced by the male- or female-dominated nature of the certificate held by the father or mother.
| Variables | Women's selection of male-dominated apprenticeship program | Men's selection of female-dominated apprenticeship program | ||
|---|---|---|---|---|
| coefficient | standard error | coefficient | standard error | |
| Age at registration | 0.0371Note *** | 0.0060 | 0.0003 | 0.0004 |
| Age squared | -0.0005Note *** | 0.0001 | 0.0000 | 0.0000 |
| Highest certificate/degree completed pre-apprenticeship (high school diploma=reference group) | ||||
| Less than high school | -0.121Note ** | 0.045 | 0.000 | 0.001 |
| Trades certificate or diploma | -0.015 | 0.051 | -0.002Note * | 0.001 |
| College / CEGEP / other non-university | 0.020 | 0.025 | 0.001 | 0.002 |
| University certificate/degree | 0.052 | 0.033 | 0.005 | 0.007 |
| Immigrant status | -0.128Note *** | 0.024 | 0.009Note ** | 0.003 |
| Father has trades certificate | 0.077Note ** | 0.024 | -0.001 | 0.001 |
| Mother has trades certificate | -0.078Note ** | 0.029 | 0.000 | 0.001 |
| Took Youth Apprenticeship Program or trade/vocational/technical program in high school | 0.044Note * | 0.021 | -0.003Note * | 0.001 |
| Province/territory of registration (Ontario=reference group) | ||||
| Newfoundland and Labrador | 0.362Note *** | 0.033 | -0.003 | 0.002 |
| Prince Edward Island | 0.237Note *** | 0.059 | -0.006Note *** | 0.002 |
| Nova Scotia | 0.354Note *** | 0.041 | -0.006Note ** | 0.002 |
| New Brunswick | 0.519Note *** | 0.044 | -0.006Note ** | 0.002 |
| Quebec | 0.328Note *** | 0.051 | -0.005 | 0.003 |
| Manitoba | 0.067Note *** | 0.018 | -0.004Table 1 Note † | 0.002 |
| Saskatchewan | 0.143Note *** | 0.023 | -0.001 | 0.003 |
| Alberta | 0.334Note *** | 0.027 | -0.004 | 0.002 |
| British Columbia | 0.328Note *** | 0.037 | -0.007Note ** | 0.002 |
| Northwest Territories | 0.480Note *** | 0.064 | -0.007Note ** | 0.002 |
| Yukon | 0.472Note *** | 0.109 | -0.006Note ** | 0.002 |
| Nunavut | 0.609Note ** | 0.216 | -0.007Note * | 0.003 |
Source: Statistics Canada, 2015 National Apprenticeship Survey. |
||||
Among male apprentices, previous certification in a trade or participating in a YAP or a trade, vocational or technical program in high school both had negative relationships with selecting a female-dominated apprenticeship program (Table 1). Results also indicated that immigrant men were more likely than Canadian-born men to select a female-dominated apprenticeship program.Note 27
3.3 Labour market outcomes of women in male-dominated apprenticeship programs
Descriptive results on labour market outcomes appear in Table 2. Additional regression analyses were run to test the statistical significance of differences between men and women in the same type of apprenticeship program.Note 28 All differences that are discussed within the text are statistically significant at the 10% level (p < 0.10) unless otherwise indicated.
Women were less likely to be employed than men across all three types of apprenticeship programs studied. Among employed apprentices, women who studied male-dominated or female-dominated programs were less likely to be self-employed than men who selected the same type of program. However, there was no statistically significant difference in the likelihood of being self-employed between men and women who were apprentices in mixed programs.
A labour market outcome that is of particular interest to postsecondary students is obtaining employment that is related to their program of study. Women who were apprentices in male-dominated or female-dominated programs were substantially less likely than their male counterparts to report holding a job that was related to their trade of study. Among apprentices in mixed programs, women were as likely as men to hold a job that was related to their trade of study.
Overall, female apprentices worked fewer hours per week than men who studied the same type of apprenticeship program. The largest difference was between men and women who were apprentices in female-dominated trades, where women worked about 6.5 fewer hours than men on average. In comparison, women worked 3.8 fewer hours than their male counterparts in male-dominated programs.
Across the three different types of apprenticeship programs, few gender differences in union membership were observed. There were no statistically significant differences between men and women who were apprentices in mixed or female-dominated programs. Moreover, while women who studied male-dominated apprenticeship programs were less likely than their male counterparts to be union members, this difference ceased to be statistically significant when differences in location (census division) were accounted for.
Another important labour market outcome is holding a job with benefits. The 2015 NAS collected information on six different types of benefits: extended health, dental plan, retirement plan, paid vacation leave, sick leave, and “other” benefits. Gender differences in the receipt of benefits by type of apprenticeship program are presented in Table 2.
Notably, there were no statistically significant gender differences in the receipt of sick leave benefits across all three types of apprenticeship programs. Overall, the fewest differences in benefits were between women and men who studied female-dominated or mixed apprenticeship programs. Women who studied female-dominated programs were significantly less likely than their male counterparts to receive paid vacation leave, while women in mixed programs were less likely than their male peers to receive dental benefits.Note 29 Conversely, women who studied male-dominated apprenticeship programs were less likely than their male counterparts to receive 5 of the 6 types of benefits.Note 30 However, when sociodemographic characteristics and census division were accounted for, there was no longer a statistically significant gender difference in the receipt of “other” benefits.
| Labour market outcomes and sex | Type of apprenticeship program | ||
|---|---|---|---|
| Male-dominated program | Mixed program | Female-dominated program | |
| mean | |||
| Employed | |||
| Men | 0.87 | 0.91 | 0.92 |
| Women | 0.75 | 0.79 | 0.81 |
| Self-employed | |||
| Men | 0.11 | 0.04 | 0.29 |
| Women | 0.08 | 0.06 | 0.19 |
| Job related to trade | |||
| Men | 0.71 | 0.56 | 0.72 |
| Women | 0.56 | 0.56 | 0.61 |
| Hours per week | |||
| Men | 46.42 | 43.49 | 42.24 |
| Women | 42.59 | 37.52 | 35.75 |
| Union membership | |||
| Men | 0.43 | 0.19 | 0.14 |
| Women | 0.35 | 0.21 | 0.17 |
| Has extended health benefits | |||
| Men | 0.70 | 0.61 | 0.29 |
| Women | 0.60 | 0.55 | 0.33 |
| Has dental benefits | |||
| Men | 0.68 | 0.62 | 0.24 |
| Women | 0.56 | 0.52 | 0.32 |
| Has retirement plan benefits | |||
| Men | 0.56 | 0.39 | 0.15 |
| Women | 0.42 | 0.43 | 0.22 |
| Has paid vacation leave benefits | |||
| Men | 0.70 | 0.72 | 0.54 |
| Women | 0.53 | 0.68 | 0.51 |
| Has sick leave benefits | |||
| Men | 0.44 | 0.48 | 0.22 |
| Women | 0.40 | 0.50 | 0.25 |
| Has other benefits | |||
| Men | 0.24 | 0.25 | 0.07 |
| Women | 0.20 | 0.22 | 0.12 |
| median | |||
| Hourly wages | |||
| Men | 33.94 | 20.69 | 20.57 |
| Women | 28.03 | 18.66 | 18.43 |
|
Note: Sample: Apprentices who completed or discontinued their program in 2011, 2012 or 2013, worked as paid employees during the reference week, and had valid information for hourly wages, age, completion status and year of completion. Source: Statistics Canada, 2015 National Apprenticeship Survey. |
|||
The last labour market outcome examined was median hourly wages. The descriptive results show that women generally had lower median wages than men who studied the same type of apprenticeship program. The median wage difference was largest between women and men who selected male-dominated apprenticeship programs.
Wage differences are explored further in the hourly wage median regression models. Descriptive information on the main covariates used for these models (mean age, proportion who completed their apprenticeship program, and proportion who completed/discontinued by year) are reported in Appendix Table 2. These results show that female apprentices were slightly older than their male counterparts in male-dominated and mixed programs and slightly younger in female-dominated programs.
Multivariate results for median log hourly wages are presented by apprenticeship program in Charts 1 to 3.Note 31 To obtain more information about potential gender differences at different points in the wage distribution, Charts 4 to 6 provide quantile regression results at the 25th, 50th and 75th percentiles. Since the focus of this paper is the labour market prospects of female apprentices, each chart shows the regression coefficients for the sex variable (female=1, male=0) for each of the regression models.
Female apprentices who studied male-dominated programs earned less than their male counterparts (Chart 1). Although wage differences between women and men were reduced when age, completion status, level of education in 2015, and year of registration were included in the regression model, the wage differences remained statistically significant across all models (Chart 1, Model 5). The gender difference in median log hourly wages in Models 2 to 5 were generally about 0.11 to 0.13, corresponding to roughly 12% to 14%.Note 32 Overall, median wage differences were not statistically significant between women and men in mixed apprenticeship programs or female-dominated apprenticeship programs (Chart 2 and Chart 3, respectively).
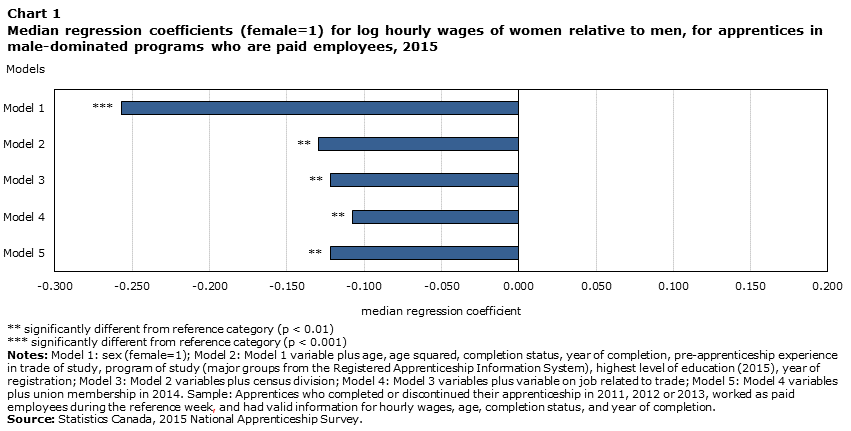
Data table for Chart 1
| Models | Log hourly wages |
|---|---|
| median regression coefficient | |
| Model 1 | -0.2569Note *** |
| Model 2 | -0.1293Note ** |
| Model 3 | -0.1218Note ** |
| Model 4 | -0.1075Note ** |
| Model 5 | -0.1220Note ** |
Source: Statistics Canada, 2015 National Apprenticeship Survey. |
|
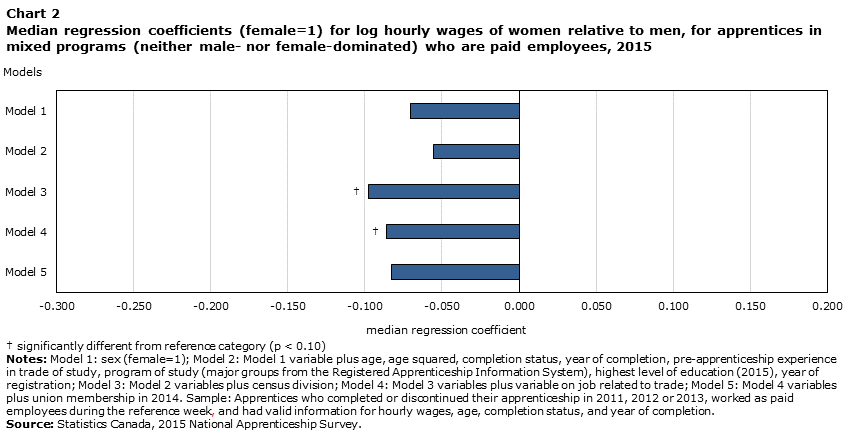
Data table for Chart 2
| Models | Log hourly wages |
|---|---|
| median regression coefficient | |
| Model 1 | -0.0702 |
| Model 2 | -0.0555 |
| Model 3 | -0.0978Data table Note † |
| Model 4 | -0.0857Data table Note † |
| Model 5 | -0.0828 |
Source: Statistics Canada, 2015 National Apprenticeship Survey. |
|
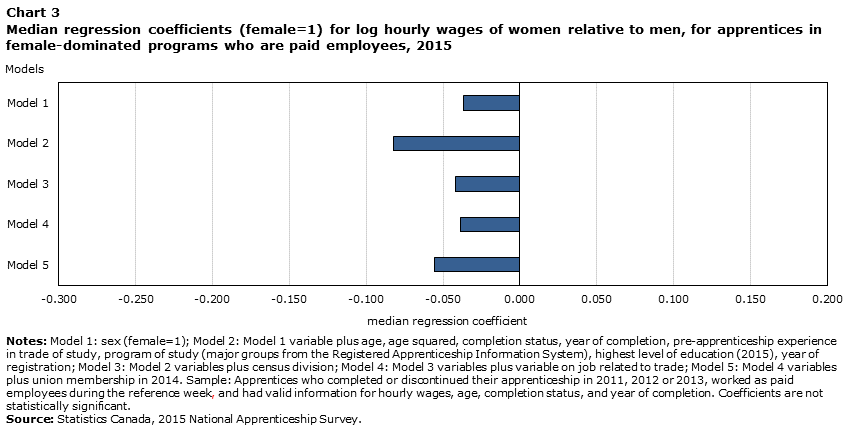
Data table for Chart 3
| Models | Log hourly wages |
|---|---|
| median regression coefficient | |
| Model 1 | -0.0369 |
| Model 2 | -0.0822 |
| Model 3 | -0.0419 |
| Model 4 | -0.0385 |
| Model 5 | -0.0555 |
|
Notes: Model 1: sex (female=1); Model 2: Model 1 variable plus age, age squared, completion status, year of completion, pre-apprenticeship experience in trade of study, program of study (major groups from the Registered Apprenticeship Information System), highest level of education (2015), year of registration; Model 3: Model 2 variables plus census division; Model 4: Model 3 variables plus variable on job related to trade; Model 5: Model 4 variables plus union membership in 2014. Sample: Apprentices who completed or discontinued their apprenticeship in 2011, 2012 or 2013, worked as paid employees during the reference week, and had valid information for hourly wages, age, completion status, and year of completion. Coefficients are not statistically significant. Source: Statistics Canada, 2015 National Apprenticeship Survey. |
|
Little is known about gender differences among apprentices at different points in the wage distribution. Among apprentices who studied male-dominated programs, women’s wages were significantly lower than men’s wages at all three points of the distribution examined (Chart 4).
Women who studied in mixed apprenticeship programs did not differ significantly from men who selected the same program in the 25th or 50th percentiles of the wage distribution (Chart 5). However, their wages were significantly lower than their male counterparts at the higher end of the distribution (75th percentile; p < 0.10). Similar results were found among apprentices who studied female-dominated programs, where women earned less than men at the 75th percentile (p < 0.10).
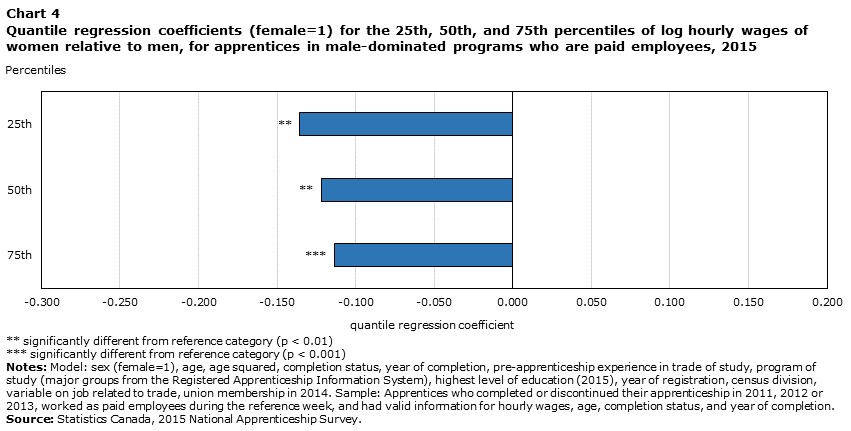
Data table for Chart 4
| Percentiles | Log hourly wages |
|---|---|
| quantile regression coefficient | |
| 25th | -0.1356Note ** |
| 50th | -0.1220Note ** |
| 75th | -0.1137Note *** |
Source: Statistics Canada, 2015 National Apprenticeship Survey. |
|
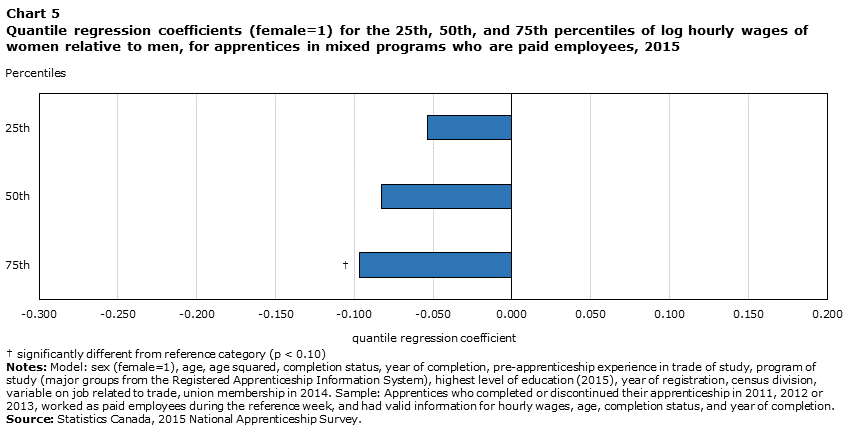
Data table for Chart 5
| Percentiles | Log hourly wages |
|---|---|
| quantile regression coefficient | |
| 25th | -0.0534 |
| 50th | -0.0828 |
| 75th | -0.0966Data table Note † |
Source: Statistics Canada, 2015 National Apprenticeship Survey. |
|
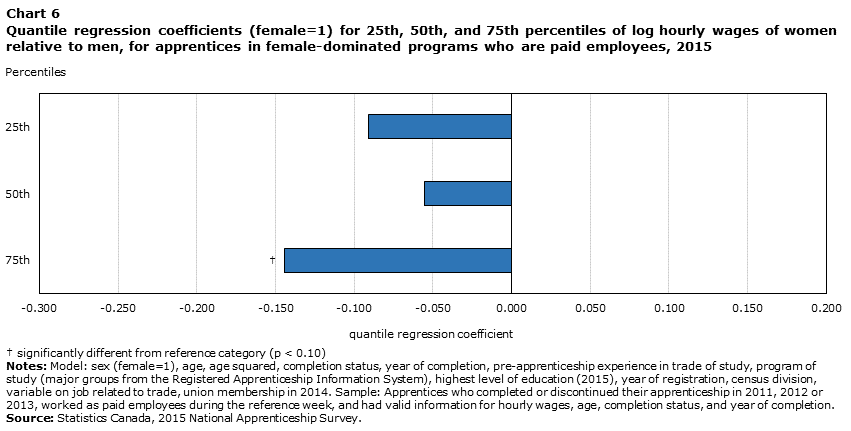
Data table for Chart 6
| Percentiles | Log hourly wages |
|---|---|
| quantile regression coefficient | |
| 25th | -0.0906 |
| 50th | -0.0555 |
| 75th | -0.1442Data table Note † |
Source: Statistics Canada, 2015 National Apprenticeship Survey. |
|
4 Conclusion
Increasing women’s participation in male-dominated trades has been identified as a means of improving the supply of skilled tradespersons in Canada, creating a more diverse workforce, and increasing women’s wages. Previous studies suggest that women working in male-dominated trades have higher earnings than women in female-dominated trades (Boothby and Drewes 2010). However, little information exists about women’s decision to enter male-dominated apprenticeship programs and their labour market outcomes. This study examined two previously understudied dimensions of women in male-dominated apprenticeship programs: factors associated with their decision and their labour market prospects.
About one in five female apprentices selected a male-dominated apprenticeship program. Several sociodemographic factors were associated with women’s program choice. Women who were Canadian-born, older, had a father with a trades certificate, or participated in a YAP or a trade, vocational or technical program during high school were more likely to choose a male-dominated apprenticeship program. In addition, having a mother with a trades certificate was negatively associated with female apprentices selecting a male-dominated program. The influence of a parent’s certification in a trade may be linked to the male- or female-dominated nature of the certificate held by the father or mother. Among male apprentices, previous certification in a trade or having participated in a YAP or a trade, vocational or technical program during high school was associated with a lower likelihood of selecting a female-dominated program.
Women who studied male-dominated apprenticeship programs generally had poorer labour market outcomes than their male counterparts. Women who selected these programs were less likely to be employed than their male peers, hold a job related to their trade of study, or receive 5 of the 6 types of benefits that were examined. However, female apprentices who studied male-dominated programs were as likely as their male counterparts to receive sick leave benefits in their jobs. Additionally, when sociodemographic and census division variables were accounted for, women who studied male-dominated programs were as likely as men to be union members.
Women who selected mixed or female-dominated apprenticeship programs experienced fewer disadvantages across labour market outcomes compared to men who selected the same types of programs. For example, women who selected mixed programs were as likely as their male counterparts to work in a job related to their trade, be union members, and receive paid vacation leave and retirement plan benefits in their jobs. Although women who selected female-dominated programs were less likely than their male counterparts to be employed or hold a job related to their trade of study, they were as likely to be union members and receive extended health, dental plan, retirement plan, and sick leave benefits.
Female apprentices who studied male-dominated apprenticeship programs received lower median hourly wages than their male counterparts. Gender differences were also observed at the lower and upper ends of the wage distribution for apprentices in male-dominated programs. Although the median wages of female apprentices who studied in mixed or female-dominated programs did not differ significantly from those of their male peers, female apprentices did earn less than their male counterparts at the higher end of the wage distribution (75th percentile).
Several factors that contribute to gender gaps in labour outcomes could not be accounted for with the data used in this study. For example, previous studies have identified job tenure, accumulated work experience, performance-based pay, firm size, overtime pay, foreign ownership, work schedules, the division of labour within households, and discrimination as factors associated with the gender wage gap (Blau and Kahn 2007; Drolet 2002; O’Neill 2003). Therefore, conclusions made from the results of this study should keep this limitation in mind.
The findings presented in this study can help to increase women’s awareness and knowledge of careers in male-dominated trades. School and career counsellors may also find this information useful for guiding girls and women whose interests and abilities align with occupations in male-dominated trades. Furthermore, results from this study can be used by policymakers to inform strategies for increasing women’s participation in male-dominated apprenticeship programs.
Appendix Tables
| Proportion of apprentices | |
|---|---|
| percent | |
| Male-dominated programs (percentage of men) | 96.6 |
| Agricultural service contractors, farm supervisors and specialized livestock workers | 88.5 |
| Aircraft mechanics and aircraft inspectors | 94.4 |
| Automotive service technicians, truck and bus mechanics, and mechanical repairers | 98.1 |
| Boilermakers | 99.8 |
| Bricklayers | 96.1 |
| Cabinetmakers | 87.9 |
| Carpenters | 97.1 |
| Concrete finishers | 100.0 |
| Construction millwrights and industrial mechanics | 98.3 |
| Construction trades helpers and labourers | 90.0 |
| Crane operators | 99.9 |
| Electrical power and telecommunications line and cable workers | 98.0 |
| Electricians (except industrial and power system) | 96.0 |
| Elevator constructors and mechanics | 94.6 |
| Floor covering installers | 85.3 |
| Gas fitters | 98.6 |
| Glaziers | 100.0 |
| Heavy equipment operators (except crane) | 96.8 |
| Heavy-duty equipment mechanics | 99.0 |
| Industrial electricians | 97.9 |
| Industrial instrument technicians and mechanics | 98.4 |
| Insulators | 83.9 |
| Ironworkers | 97.1 |
| Landscape and horticulture technicians and specialists | 88.6 |
| Machining tool operators | 93.4 |
| Machinists and machining and tooling inspectors | 93.8 |
| Motor vehicle body repairers | 98.1 |
| Motorcycle, all-terrain vehicle and other related mechanics | 100.0 |
| Oil and gas well drillers, servicers, testers and related workers | 100.0 |
| Oil and solid fuel heating mechanics | 99.2 |
| Other small engine and small equipment repairers and other automotive mechanical installers and servicers | 95.0 |
| Other trades and related occupations, not elsewhere classified | 100.0 |
| Painters and decorators (except interior decorators) | 89.6 |
| Plasterers, drywall installers and finishers, and lathers | 95.6 |
| Plumbers | 97.2 |
| Power engineers and power systems operators | 100.0 |
| Power system electricians | 100.0 |
| Refrigeration and air conditioning mechanics | 97.0 |
| Roofers and shinglers | 100.0 |
| Sheet metal workers | 98.1 |
| Steamfitters, pipefitters and sprinkler system installers | 97.8 |
| Structural metal and platework fabricators and fitters | 99.4 |
| Tilesetters | 100.0 |
| Tool and die makers | 100.0 |
| Transport truck drivers | 94.3 |
| Water and waste treatment plant operators | 85.8 |
| Welders and related machine operators | 93.3 |
| Other male-dominated programs | 95.6 |
|
Notes: The National Occupational Classification (NOC) occupational groups presented are at the unit group (four-digit) level; some NOC groups were aggregated into "other" groups because of small sample sizes. Sample: Apprentices who completed or discontinued their program in 2011, 2012, or 2013. Source: Statistics Canada, 2015 National Apprenticeship Survey. |
|
| Proportion of apprentices | |
|---|---|
| percent | |
| Mixed programs (percentage of men) | 54.6 |
| Bakers | 56.1 |
| Chefs and cooks | 62.3 |
| User support technicians | 46.6 |
| Other mixed programs | 49.5 |
| Female-dominated programs (percentage of women) | 94.1 |
| Estheticians, electrologists and related occupations | 100.0 |
| Hairstylists and barbers | 93.1 |
| Other female-dominated programs | 96.4 |
|
Notes: The National Occupational Classification (NOC) occupational groups presented are at the unit group (four-digit) level; some NOC groups were aggregated into "other" groups because of small sample sizes. Sample: Apprentices who completed or discontinued their program in 2011, 2012, or 2013. Source: Statistics Canada, 2015 National Apprenticeship Survey. |
|
| Type of program | Age | Completed apprenticeship | Year apprentice completed or discontinued program | |||||||
|---|---|---|---|---|---|---|---|---|---|---|
| Men | Women | Men | Women | Men | Women | |||||
| 2011 | 2012 | 2013 | 2011 | 2012 | 2013 | |||||
| mean | ||||||||||
| Male-dominated program | 33.5 | 34.3 | 0.58 | 0.44 | 0.33 | 0.31 | 0.36 | 0.30 | 0.34 | 0.36 |
| Mixed program | 32.5 | 35.1 | 0.49 | 0.51 | 0.25 | 0.33 | 0.42 | 0.22 | 0.32 | 0.46 |
| Female-dominated program | 31.7 | 29.3 | 0.53 | 0.64 | 0.30 | 0.29 | 0.41 | 0.30 | 0.34 | 0.36 |
|
Note: Sample: Apprentices who completed or discontinued their apprenticeship in 2011, 2012 or 2013, worked as paid employees during the reference week, and had valid information for hourly wages, age, completion status, and year of completion. Source: Statistics Canada, 2015 National Apprenticeship Survey. |
||||||||||
References
Blau, F.D., and L.M. Kahn. 2007. “The gender pay gap: have women gone as far as they can?” Academy of Management Perspectives 21 (1): 7–23.
Boothby, D., and T. Drewes. 2010. Returns to Apprenticeship in Canada. Working paper no. 70. Vancouver: Canadian Labour Market and Skills Researcher Network.
Cadieux, B. 2010. National Apprenticeship Survey 2007: Factors Influencing Completion of Apprenticeship. Ottawa: Human Resources and Skills Development Canada.
Carey, D. 2014. Overcoming skills shortages in Canada. OECD Economics Department Working Papers, no. 1143. Paris: OECD Publishing. Available at: http://dx.doi.org/10.1787/5jz123fgkxjl-en.
Drolet, M. 2002. The “Who, What, When and Where” of Gender Pay Differentials. The Evolving Workplace Series no. 4. Statistics Canada Catalogue no. 71-584-MIE. Ottawa: Statistics Canada and Human Resources Development Canada.
Ericksen, J.A., and D.E. Palladino Schultheiss. 2009. “Women pursuing careers in trades and construction.” Journal of Career Development 36 (1): 68–89.
Frank, K., and E. Jovic. 2017. National Apprenticeship Survey: Canada overview report, 2015. Catalogue no. 81-598-X. Ottawa: Statistics Canada.
Frome, P.M., C.J. Alfeld, J.S. Eccles, and B.L. Barber. 2006. “Why don’t they want a male-dominated job? An investigation of young women who changed their occupational aspirations.” Educational Research and Evaluation 12 (4): 359–372.
Greene, C.K., and W.L. Stitt-Gohdes. 1997. “Factors that influence women’s choices to work in the trades.” Journal of Career Development 23 (4): 265–276.
Gunderson, M., and H. Krashinsky. 2012. Returns to Apprenticeship: Analysis based on the 2006 Census. Working Paper no. 99. Vancouver: Canadian Labour Market and Skills Researcher Network.
Laporte, C., and R.E. Mueller. 2011. The Completion Behaviour of Registered Apprentices: Who Continues, Who Quits, and Who Completes Programs? Analytical Studies Branch Research Paper Series, no. 333. Statistics Canada Catalogue no. 11F0019M. Ottawa: Statistics Canada.
Laryea, S.A., and K. Medu. 2010. National Apprenticeship Survey, 2007: Participation of Women, Immigrants and Aboriginal People in Apprenticeship Programs. Ottawa: Human Resources and Skills Development Canada.
Lillydahl, J.H. 1986. “Women and traditionally male blue-collar jobs.” Work and Occupations 13 (3): 307–323.
Massé, P., R. Roy, and Y. Gingras. 1998. The changing skill structure of employment in Canada. HRDC Applied Research Branch Paper R99-7-E. Ottawa: Human Resources Development Canada.
Morissette, R. 2015. The surge of women in the workforce, 1950 to 2014. Canadian Megatrends. Catalogue no. 11-630-X. Ottawa: Statistics Canada.
Moyser, M. 2017. Women and Paid Work. Catalogue no. 89-503-X. Ottawa: Statistics Canada.
O’Neill, J. 2003. “The gender gap in wages, circa 2000.” The American Economic Review 93 (2): 309–314.
Pyper, W. 2008. “Skilled trades employment.” Perspectives on Labour and Income 9 (10): 5–14. Statistics Canada Catalogue no. 75-001-X.
Sharpe, A., and J. Gibson. 2005. The apprenticeship system in Canada: trends and issues. Report 2005-04. Ottawa: Centre for the Study of Living Standards Research.
Statistics Canada. n.d. Table 37-10-0123-01 Demographic characteristics of apprentices, Canada.
Available at: https://www150.statcan.gc.ca/t1/tbl1/en/tv.action?pid=3710012301 (accessed October 16, 2018).
Statistics Canada. 2017a. Census in Brief: Does education pay? A comparison of earnings by level of education in Canada and its provinces and territories. Statistics Canada Catalogue no. 98-200-X2016024. Ottawa.
Statistics Canada. 2017b. Geography Catalogue, Census year 2016. Statistics Canada Catalogue no. 92-196-X. Ottawa.
Taylor, A., Z. Hamm, and M. Raykov. 2015. “The experiences of female youth apprentices in Canada: just passing through?” Journal of Vocational Education and Training 67 (1): 93-108.
United States Department of Labor. 2014. Non-traditional (male-dominated) occupations, 2014 annual averages.
Available at: https://dol.gov/wb/stats/nontra_traditional_occupations.htm (accessed December 21, 2017).
Uppal, S., and S. LaRochelle-Côté. 2014. Changes in the occupational profile of young men and women in Canada. Insights on Canadian Society. Statistics Canada Catalogue no. 75-006-X.
Walshok, M. L. 1981. Blue-collar women: pioneers on the male frontier. Garden City, NY: Anchor Press.
- Date modified: