
Analytical Studies Branch Research Paper Series
Are the Career Prospects of Postsecondary Graduates Improving?

Archived Content
Information identified as archived is provided for reference, research or recordkeeping purposes. It is not subject to the Government of Canada Web Standards and has not been altered or updated since it was archived. Please "contact us" to request a format other than those available.
Abstract
Given the time and money invested in higher education by students, parents and governments, there is considerable interest in the economic outcomes of postsecondary graduates. Most assessments of recent graduates have focused on their short-term, early labour market results. As new entrants to the labour force, recent postsecondary graduates may be particularly vulnerable to the economic cycle. Consequently, comparisons of short-term outcomes across graduating cohorts may be highly dependent on prevailing economic conditions and may not reflect the longer-term returns on investments. This is the first study to compare the long-term labour market outcomes of two cohorts of young postsecondary graduates using linked census and tax data. Specifically, graduates who were 26 to 35 years old in 1991 were followed from 1991 to 2005 (when they were 40 to 49 years old) and compared with a similarly aged 2001 cohort, which was followed from 2001 to 2015.
The results suggest that median cumulative earnings were higher among members of the more recent cohort of male and female postsecondary graduates. Increases were observed across all postsecondary levels and across most major disciplines where sample sizes were large enough to permit analysis. Also, no discipline registered a decline in cumulative earnings. Although the economic conditions faced by the 2001 cohort over the 15-year study period were generally more favourable, this cohort also registered higher earnings than the 1991 cohort during the latter portion of the period (i.e., when the 2001 cohort was faced with an economic recession). Furthermore, the initial labour market conditions upon graduation (an important determinant of career earnings) were similar for both cohorts. The improvements in long-term earnings for postsecondary graduates are important in light of the significant increase in the number of graduates over the period. However, the results also indicate that the number of years of union membership declined or remained steady across cohorts of male and female postsecondary graduates. Furthermore, while women with postsecondary qualifications registered increases in the number of years of employer-sponsored pension plan coverage, their male counterparts experienced mixed results depending on their level of postsecondary studies.
Executive summary
Although most studies find that postsecondary education yields significant economic and non-pecuniary benefits to its participants, several developments in recent years may have affected the supply and demand conditions in the market for postsecondary graduates. On the supply side, enrolment and graduation rates have increased steadily over the last three decades. Technological changes and globalization have been cited as two factors that may have increased the relative demand for postsecondary graduates. However, not all demand-side factors are likely to have benefited individuals with higher education. For example, the construction and oil resource boom experienced during the majority of this century may have benefited workers without a university degree. Also, the 2008/2009 recession could have exerted downward pressure on the wages of all workers. Thus, it is not clear how the labour market outcomes of postsecondary graduates are expected to have evolved in recent years.
When comparing outcomes of graduates over time, most studies focus on the short-term outcomes of recent graduates. Although important, this approach may miss the long-term outlook, which is clearly an important consideration when deciding to pursue higher education. Postsecondary students invest heavily in their education—by paying tuition and other fees, and by foregoing earnings during their studies—and it is unlikely that such costs can be recovered from additional earnings shortly after graduation. Students will be better equipped to make informed decisions based on their long-term labour market prospects.
Using linked census and tax data, this is the first study to compare the long-term labour market outcomes of two cohorts of young postsecondary graduates. Specifically, graduates who were 26 to 35 years old in 1991 were followed from 1991 to 2005 (when they were 40 to 49 years old) and compared with a similarly aged 2001 cohort, which was followed from 2001 to 2015. Thus, the study examines labour market outcomes during the early to mid-career portion of the working lives of postsecondary graduates.
The results suggest that median cumulative earnings were higher among members of the more recent cohort of male and female postsecondary graduates. Increases were observed across all postsecondary levels and across most major disciplines where sample sizes were large enough to permit analysis. Also, no discipline registered a decline in cumulative earnings. Although the economic conditions faced by the 2001 cohort over the 15-year study period were generally more favourable, this cohort also registered higher earnings than the 1991 cohort during the latter portion of the period (i.e., when the 2001 cohort was faced with an economic recession). Furthermore, the initial labour market conditions upon graduation (an important determinant of career earnings) were similar for both cohorts. The improvements in long-term earnings for postsecondary graduates are important in light of the significant increase in the number of graduates over the period. However, the results also indicate that the number of years of union membership declined or remained steady across cohorts of male and female postsecondary graduates. Furthermore, while women with postsecondary qualifications registered increases in the number of years of employer-sponsored pension plan coverage, their male counterparts experienced mixed results depending on their level of postsecondary studies.
1 Introduction
Postsecondary education involves considerable investment in both money and time from students, parents and governments. As a result, there is significant interest from all parties involved to understand the benefits of attending postsecondary. Research in this area has generally found that annual earnings increase by 7% to 15% for students who complete an additional year of postsecondary education, including those who just barely qualify for the program. Non-pecuniary benefits are also prevalent, including better health outcomes, marriage to a more educated spouse and lower divorce rates.Note
However, the world is rapidly changing, and various factors affect both the supply of and demand for postsecondary graduates. On the supply side, the gradual deregulation of tuition fees has coincided with an increase in the number of postsecondary-educated young entrants to the labour market over the last quarter-century. In 1990, 41.0% of 25-year-old men and 46.1% of 25-year-old women held a postsecondary credential; by 2016, 60.1% of 25-year-old men and 73.7% of 25-year-old women did so.Note An increased supply of well-educated young workers will put downward pressure on their wages unless there is an accompanying increase in demand. On that front, technological change has often been cited as one factor that favours workers with skills that are complementary to new technology. Globalization may also disproportionately favour higher-skilled workers since lower-skilled jobs are at greater risk of being offshored. More specific to Canada, the construction and oil resource boom during most of the current century may have benefited workers with only a high school diploma relative to university-educated workers (Frenette and Morissette 2014).
As a result of all these changes, it is not clear a priori in which direction the labour market outcomes of postsecondary graduates are headed. Canadian studies on the topic have generally focused on the outcomes of recent postsecondary graduates (e.g., Finnie and Frenette 2003; Walters 2004; Frank, Frenette and Morissette 2015). These studies generally found that recent graduates’ earnings tended to remain relatively stable over the economic cycle. However, graduating during an economic recession appears to be associated with lower entry earnings among university graduates in the Maritime Provinces (Galarneau, Hinchley and Ntwari 2017).Note
Although important, the focus on short-term outcomes sheds little light on how graduates fare over their entire career—clearly an important consideration when deciding to pursue higher education. Postsecondary students invest heavily in their education—by paying tuition and other fees, and by foregoing earnings during their studies—and it is unlikely that such costs can be recovered from additional earnings shortly after graduation. Students will be better equipped to make informed decisions based on their long-term labour market prospects.
Two recent studies examined the cumulative earnings of individuals over a 20-year period across completed levels of education and major fields of study. Frenette (2014) used linked census and taxation data and found that cumulative earnings varied considerably by level of education and that the gap in annual earnings across levels also varied throughout the careers of workers. Using a similar approach, Ostrovsky and Frenette (2014) highlighted the large variation in cumulative earnings by field of study and within fields of study.
This study is a natural follow-up to the studies by Frenette (2014) and Ostrovsky and Frenette (2014). Using two linked census and tax data files, this is the first national study to compare the long-term labour market outcomes of two cohorts of young postsecondary graduates. Specifically, graduates who were 26 to 35 years old in 1991 were followed from 1991 to 2005 (when they were 40 to 49 years old) and compared with a similarly aged 2001 cohort, which was followed from 2001 to 2015. Results were generated by sex, level of completed education and (when samples permitted) major field of study. Aside from earnings, the tax data also contained two other important labour market outcomes: participation in an employer-sponsored pension plan (through the pension adjustment field in tax data, which covers registered pension plans and deferred profit-sharing plans) and union membership. Both of these outcomes were also examined in the study.
The study is organized into four sections. Section 2 describes the data and methods used. The results are presented in Section 3. The study concludes in Section 4.
2 Data and methods
This study is based on Census of Population data linked to the T1 Personal Master File (T1PMF). Both the 1991 Census and 2001 Census files were linked to the 1983-to-2015 T1PMF using information available in census and tax data, such as date of birth, sex, postal code and marital status.Note The target groups for the linkages were individuals aged 25 and older in the 1991 Census and individuals aged 19 and older in the 2001 Census. Overall, 97.0% of the 1991 target group were linked to the 1991 tax data, and 97.5% of the 2001 target group were linked to the 2001 tax data. More information on the linkage processes is available in the work of Wilkins et al. (2008) and Pinault et al. (2016).
The objective of this study is to compare the long-term labour market outcomes of successive cohorts of Canadian postsecondary graduates. While census data do not indicate when an individual has graduated, it is still possible to select and compare similarly aged graduates across census cohorts. To this end, the analytical sample consists of all individuals who were between the ages of 26 and 35 on December 31, 1991 (i.e., they were born between 1956 and 1965) or similarly aged on December 31, 2001 (i.e., they were born between 1966 and 1975). These individuals were followed in tax data for 15 years (1991 to 2005 for the 1991 Census cohort and 2001 to 2015 for the 2001 Census cohort). In other words, they were followed from the time they were 26 to 35 years old until they were 40 to 49 years old. This period roughly corresponds to the early to mid-career for most workers.
Only individuals who appeared in the tax data for all 15 years were included in the analytical sample, whether they worked or not. The inclusion of non-workers in the sample was important in case employment conditions changed, even though hourly wage conditions might not have. In other words, any employment effects will be captured in the earnings measure under this approach. Three primary reasons why individuals stopped appearing on tax files included death, departure from the country or non-filing. However, someone may file taxes for recently deceased individuals to claim income or benefits, and recent emigrants may also file Canadian taxes for the same reason. The T1PMF has flags for deceased individuals and emigrants. This study used the flags to remove those individuals from the sample. Specifically, if an individual was listed as deceased or as an emigrant at any point during the study period, they were dropped entirely from the sample.
Additional sample selection criteria were also imposed, including limiting the sample to individuals born in Canada (to focus on individuals who were likely educated in Canada), to those who did not attend school in the nine months prior to the census (conducted in the spring), and to those who did not attend a postsecondary institution at any point in the following 15 years.Note Altogether, these sample criteria resulted in an analytical sample consisting of 133,393 men and 139,317 women in the 1991 Census cohort, and of 97,806 men and 104,330 women in the 2001 Census cohort.Note
Three labour market outcomes were examined in the study, all of which were taken from tax data. The main outcome of interest was median total earnings (the sum wages and salaries shown on the T4 Statement of Remuneration Paid; net self-employment income from business, commission, farming, fishing or professional sources; and other employment income). These were expressed in 2015 constant dollars. The focus was on the median cumulative sum of total earnings over the 15-year period, although some results show annual median total earnings over the period.Note Two additional outcomes were examined. The first was the mean number of years of participation in an employer-sponsored pension plan—identified through the pension adjustment field on line 206 in the tax data, which covers registered pension plans and deferred profit-sharing plans and is used to determine remaining Registered Retirement Savings Plan (RRSP) contributions. The second was the mean number of years of union membership—determined by the payment of union, professional or like dues on line 212 in the tax data, which are used as deductions.Note
These outcomes were broken down by sex, highest level of completed schooling (no educational credentials, high school diploma, trades certificate, college certificate, bachelor’s degree, master’s degree and doctorate) and field of study (postsecondary graduates only). These variables were all available from the census files. Only cells with a minimum of 200 observations were included in the analysis. Graduates of professional degree programs (medicine, dentistry, veterinary medicine or optometry) were excluded from the analysis since many of them choose to incorporate, which requires filling out a T2 Corporation Income Tax Return to report corporate earnings.
Nine major field of study groups were used in this study. They are listed below, along with the major field of study codes:
- educational, recreational and counselling services (1-46)
- fine and applied arts (47-79)
- humanities and related fields (80-124)
- social sciences and related fields (125-187)
- commerce, management and business administration (188-220)
- agricultural, biological, nutritional, and food sciences (221-266)
- engineering and applied sciences and technologies (267-369)
- health professions and related technologies (370-441)
- mathematics, computer and physical sciences (442-480).
Results are shown by field of study only for college and university levels. Although individuals who complete a trades certificate are also asked to describe their major field of study on the census, this classification is more conducive to analyzing college and university students. For trades students and registered apprentices, program choices are more concentrated and are better described by using an occupational classification, which is the approach adopted in the National Apprenticeship Survey and the Registered Apprenticeship Information System.
Comparisons of the outcomes for each of the cells described above were made across the two census cohorts in a simple quantile (median) regression framework for cumulative earnings, and in a Poisson regression model for the number of years with an employer-sponsored pension plan and the number of years of union membership. For any given group (e.g., women with a bachelor’s degree in social sciences), a pooled regression including individuals in both cohorts was estimated, with a dummy variable indicating the cohort, and covariates such as age and age squared (from tax data), and province or territory of birth (from census data).
In all cases, the analysis was weighted to account for the initial selection probability (from the census weights) and the probability of successful linkage to tax data (from an adjustment to the census weights created as part of the project to link the files). In addition, the first 100 bootstrap weights on the files were used to calculate standard errors. This was necessary to account for the fact that the final linked file was not a simple random sample of the underlying population of interest (i.e., the 1991 or 2001 Census population corresponding to the sample criteria outlined above).
3 Results
The sample characteristics are described in Table 1. Recall that the cohorts consist of 26 to 35 year-old men and women in 1991 or 2001 who were born in Canada, did not attend school in the 9 months prior to the Census, and appeared in the tax data and did not attend PSE during the 15 year follow-up period. The main differences across cohorts involve the highest level of completed education. Both men and women in the 2001 cohort were more highly educated than their counterparts from the 1991 cohort. Specifically, the proportions who held a college certificate, bachelor’s degree, master’s degree or doctorate all increased between the two cohorts. This was especially the case among women. For example, 17.4% of the 2001 cohort held a bachelor’s degree, compared with 7.6% of the 1991 cohort. While less common, the proportion of women who held a master’s degree was also more than twice as high among the 2001 cohort. Men also registered substantial gains in college and university credentials, albeit not quite as much as women.Note
The other sample differences were much smaller. Both men and women were slightly older in the 2001 cohort (by about 0.2 years). Members of the 2001 cohort were also slightly more likely to have been born in Ontario, Alberta or British Columbia, but slightly less likely to have been born in the Maritime Provinces, Quebec or Saskatchewan.
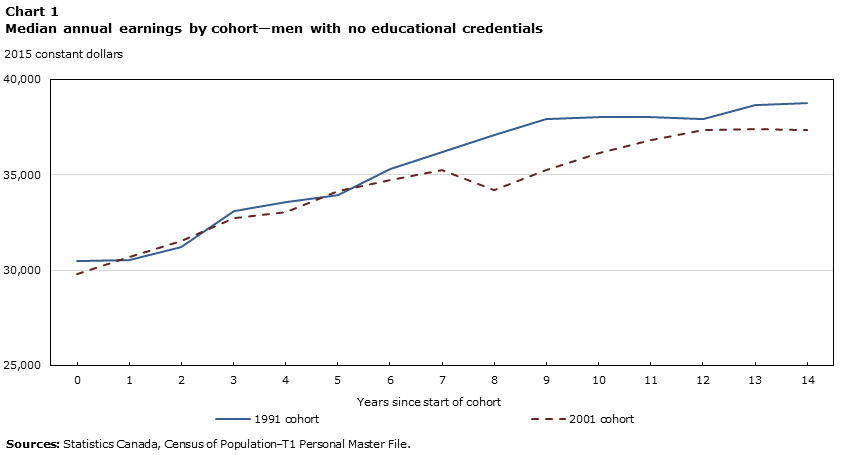
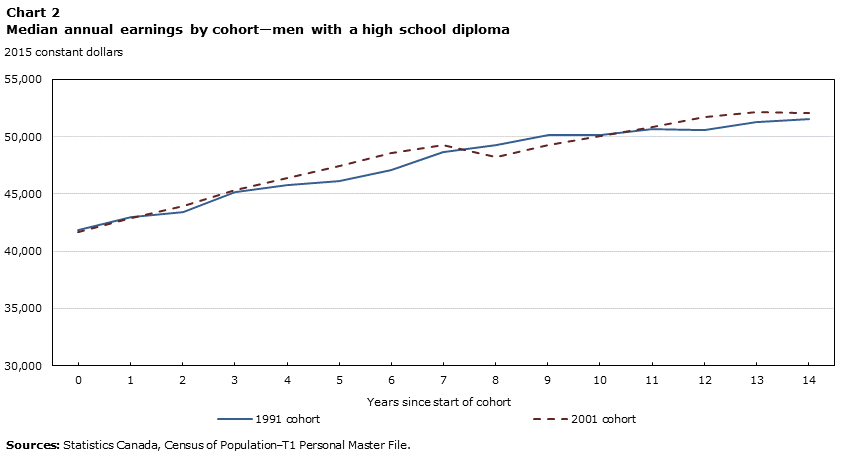
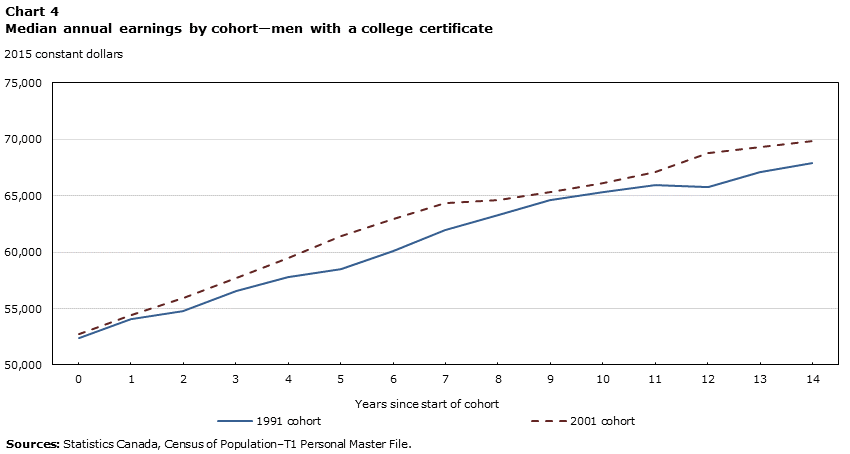
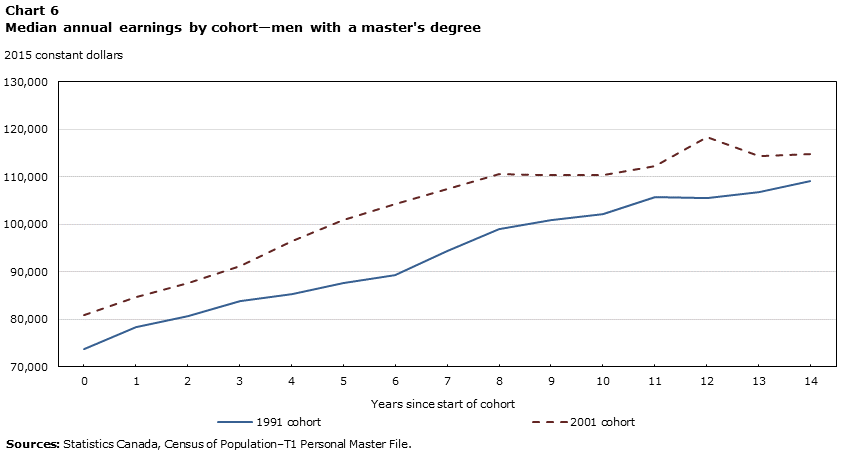
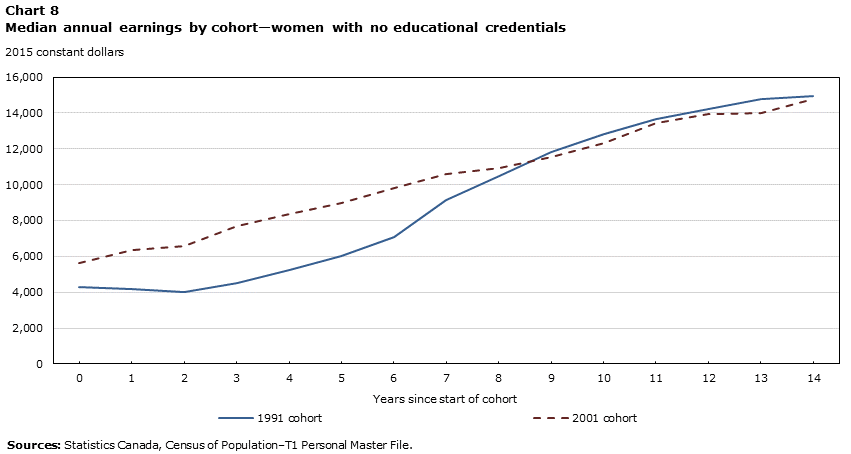
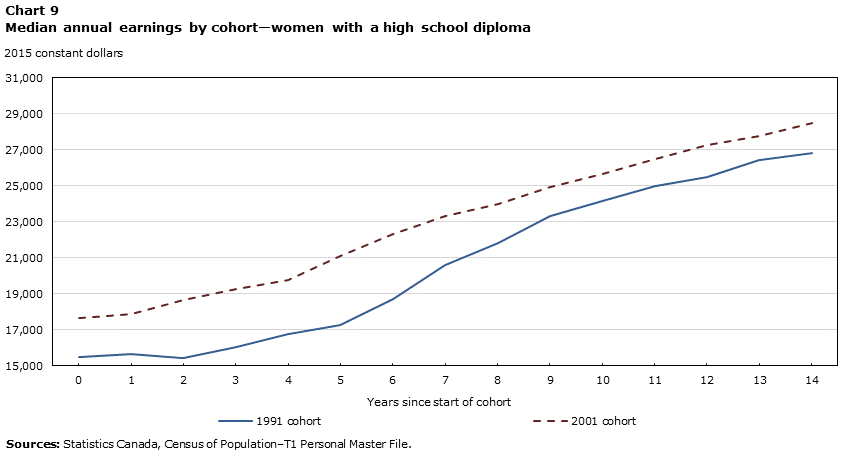
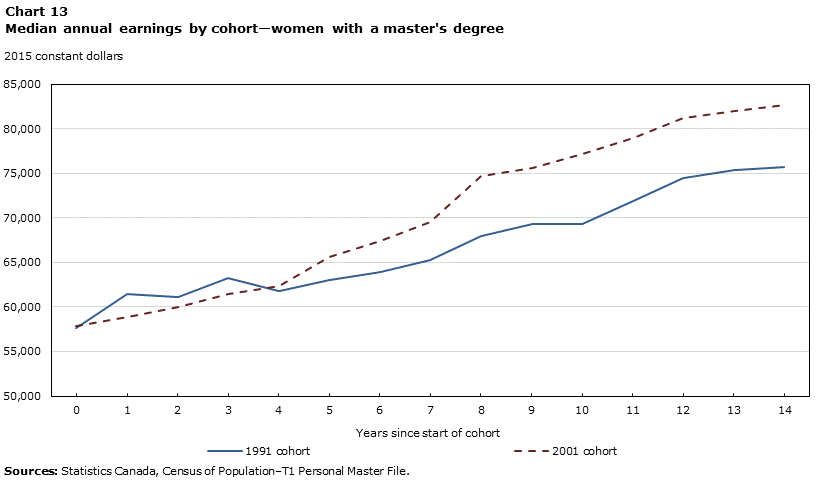
The median total annual earnings are shown by sex and education level in Charts 1 to 13. For men, annual earnings over the 15-year study period were higher for the 2001 cohort among all groups of postsecondary graduates, but particularly among masters and doctoral graduates. Men with only a high school diploma generally saw no change in median annual earnings, while those with no education credentials registered a decline in annual earnings across cohorts (particularly in the latter portion of the study period). Generally, increases were registered at all levels of educational attainment among women, even among those with no postsecondary credentials. Since the sample included non-workers, rising labour force participation over the last two decades could explain increases in earnings for women.
The median cumulative earnings over the 15-year study periods are shown in Table 2 by sex, highest level of completed education and major field of study. Many groups earned roughly $1,000,000 over the 15-year follow-up periods for both cohorts, with considerable variation by sex, education level and field of study. Men earned more than women across education levels and fields of study. Although many factors may be responsible for this earnings gap, it is important to note that individuals who did not work or who worked part-time were included in the sample—this approach will produce differences in earnings that are highly sensitive to differences in work hours. Similar to results shown in the work of Frenette (2014), cumulative earnings also increased with the level of completed educational attainment, with two exceptions. First, women with a trades certificate earned about the same as women with only a high school diploma. Similarly, male doctoral graduates earned about the same as men with a master’s degree. Low sample sizes prevented the release of results for female doctoral graduates.
Cumulative earnings also varied considerably by field of study, as was demonstrated by Ostrovsky and Frenette (2014). Generally, graduates in the following fields of study earned the most: engineering and applied sciences and technologies; mathematics, computer and physical sciences; commerce, management and business administration; health professions and related technologies; and social sciences and related fields. Graduates in the following fields of study generally earned the least: fine and applied arts; humanities and related fields; agricultural, biological, nutritional, and food sciences; and educational, recreational and counselling services.
The relevant analytical question in this study is whether or not cumulative earnings improved across cohorts. While Table 2 shows the median cumulative earnings for both cohorts, these do not account for any differences in the age structure of the two cohorts, or place of birth. Table 3 shows the results based on such adjustments through median regressions that are estimated separately by sex, education level and field of study. The coefficients shown represent the estimated differences in adjusted median cumulative earnings between the 2001 and 1991 cohorts.
Among men, those with no postsecondary credentials (i.e., no educational credentials or only a high school diploma) registered no significant changes in median cumulative earnings. A small but statistically significant increase of $20,000 was registered among men with a college certificate. All other groups of men saw more substantial gains, including $71,000 among those with a trades certificate, $66,000 among bachelor’s degree holders, $161,000 among master’s degree holders and $210,000 among doctoral graduates. Expressed as annual earnings, the gains enjoyed by master’s and doctoral graduates ranged from $11,000 to $14,000. The largest increase registered within a specific field was among commerce, management and business administration graduates at the master’s degree level ($264,000). No substantial losses were registered by graduates of any field. Interestingly, some fields typically associated with lower earnings at the bachelor’s degree level (educational, recreational and counselling services; and humanities and related fields) witnessed gains in excess of $100,000.
Median cumulative earnings increased across all education levels for women, although the gains were smallest among those with no education credentials, followed by moderate gains registered by high school and college graduates. Women and men with a trades certificate saw similar gains (about $70,000 in both cases), while women with a bachelor’s degree registered larger gains ($85,000) than men with similar qualifications ($66,000). At the master’s degree level, the overall gains were substantially smaller among women ($56,000) than among men ($161,000). The same was true among the two fields that could be examined for men and women at the master’s degree level (social sciences and related fields; and commerce, management and business administration). Thus, the largest gains for women were among bachelor’s degree graduates, and this was true for graduates of many major fields as well. In fact, sizeable gains were registered across most fields among women with a bachelor’s degree. Moreover, three of the five fields at the bachelor’s degree level with gains of $100,000 or more are typically associated with lower earnings (educational, recreational and counselling services; fine and applied arts; and agricultural, biological, nutritional, and food services).
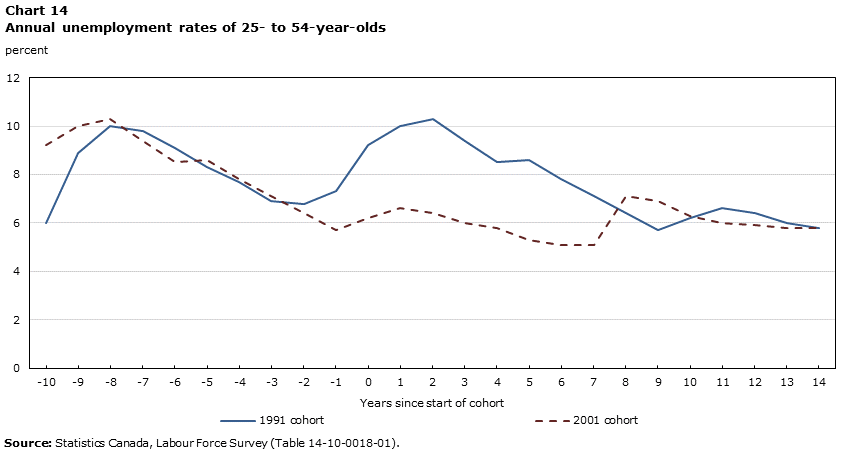
Despite rising educational attainment among men and women, the results described so far indicate that the long-term earnings outlook of postsecondary graduates has been on an upward trend for both sexes. This suggests that demand-side factors may be at play. But does it suggest the presence of a secular trend? Not necessarily, as the impact of the economic cycle has not been taken into account. Indeed, members of the 2001 cohort faced a more favourable labour market than their counterparts from the 1991 cohort. Chart 14 demonstrates this point by showing the unemployment rate for 25- to 54-year-olds across the study for both cohorts. During the first eight years of the follow-up (in the chart, between zero and seven years from the start of the cohort study), members of the 2001 cohort faced unemployment rates between 2 and 4 percentage points lower than members of the 1991 cohort. This can be explained by the fact that the early 1990s saw the beginning of an economic recession that was followed by what some termed the “jobless recovery” throughout much of the remaining part of the decade. In contrast, most of the 2000s were characterized by economic booms in the construction and resource sectors. Following the 2008/2009 recession, unemployment rates increased, which affected only the 2001 cohort in this study. As a result, the 2001 cohort faced a similar labour market as the 1991 cohort during the last seven years of the follow-up.
Thus, the 15-year study period could arguably be divided into two sub-periods: up to and including seven years after the start of the period—when the labour market was far more favourable to the 2001 cohort—and later, when both cohorts faced a similar market. If the superior outcomes of postsecondary graduates from the 2001 cohort noted so far were the result of better labour market conditions, most of the increase in cumulative earnings would be expected to have occurred during the first eight years of the period, as opposed to during the last seven years. However, this is generally not the case, as evidenced by Table 4, where the methodology was the same as in Table 3, except that the regressions were estimated separately for each sub-period. What Table 4 shows is that postsecondary graduates from the 2001 cohort outperformed their counterparts from the 1991 cohort in both sub-periods. These results are consistent with a positive secular trend in long-term labour market outcomes of postsecondary graduates.
One possible counterargument to this is the fact that previous research has suggested that initial labour market conditions upon graduation affect the long-term outcomes of postsecondary graduates (Oreopoulos, von Wachter and Heisz 2012). Census results do not indicate exactly when someone completes a program. In the first year of the study, the unemployment rate faced by the 2001 cohort was 3 percentage points lower than what was faced by the 1991 cohort (Chart 4). However, all individuals in the analytical sample were 26 to 35 years old in the first year of the study. Arguably, most of them would have entered the labour market well before the first year of the study. As the analysis moves into the pre-study period (and likely closer to the year of graduation for many individuals), the unemployment rate differential diminishes rapidly and actually levels out within only two years. Going 8 to 11 years back results in higher unemployment rates faced by the 2001 cohort (likely to affect the initial conditions faced by the oldest members of the cohorts). Thus, initial labour market conditions upon graduation were similar for the majority of members in both cohorts.
Graduates may also measure labour market success through the lens of non-pecuniary benefits. On this front, the tax data offer two possibilities: participation in an employer-sponsored pension plan and union membership. The average number of years of participation in an employer-sponsored pension plan or union membership is shown for the two cohorts by level of education in Table 5.
Generally speaking, individuals with higher levels of education spent more years in an employer-sponsored pension plan. For example, the average number of years of employer-sponsored pension plan coverage among women in the 2001 cohort was about twice as high among those with a bachelor’s degree (8.7 years), compared with those with a high school diploma (4.3 years).
A positive relationship was also evident between educational attainment and the number of years of union membership, although the association was generally weaker for men. Indeed, there was little to no difference in years of union membership among men with a trades or college certificate, or a bachelor’s or master’s degree. Among women, higher educational attainment was generally associated with more years of union membership.
Although differences in non-pecuniary benefits across the two cohorts can also be ascertained from the results in Table 5, those results do not account for any differences in age or province/territory of birth shown in Table 1. In Table 6, the differences are shown after adjusting for these factors in a series of Poisson regression models estimated separately by sex and education level.
All education groups registered a decline in union membership.Note The results were more mixed for employer-sponsored pension plan coverage. In fact, most groups of postsecondary-educated women registered increases, namely those with a trades or college certificate and those with a bachelor’s degree. An increase was also registered among women with a master’s degree, but this was not statistically significant. For postsecondary-educated men, those with a bachelor’s degree registered an increase, while a decline was evident for those with a college certificate or a doctorate.
4 Conclusion
This study examined the long-term labour market prospects of postsecondary graduates using linked census and taxation data. It focused on comparing outcomes of two groups of graduates: those aged 26 to 35 in 1991 and their counterparts in 2001. In both cases, individuals were followed for 15 years (until they were 40 to 49 years old), thus covering the early to mid-career portion of their working lives. Given changes in both supply-side and demand-side factors, it is not clear how the long-term labour market outcomes of graduates have evolved in recent years.
The results suggest that median cumulative earnings were greater among members of the more recent cohort of male and female postsecondary graduates. Increases were observed across all postsecondary levels and across most major disciplines where sample sizes were large enough to permit analysis. Also, no discipline registered a decline in cumulative earnings. Although the economic conditions faced by the 2001 cohort over the 15-year study period were generally more favourable, this cohort also registered higher earnings than the 1991 cohort during the latter portion of the period (i.e., when the 2001 cohort was faced with an economic recession). Furthermore, the initial labour market conditions upon graduation (an important determinant of career earnings) were similar for both cohorts. The improvements in long-term earnings for postsecondary graduates are important in light of the significant increase in the number of graduates over the period. However, the results also indicate that the number of years of union membership declined or remained steady across cohorts of male and female postsecondary graduates. Furthermore, while women with postsecondary qualifications registered increases in the number of years of employer-sponsored pension plan coverage, their male counterparts experienced mixed results depending on their level of postsecondary studies.
The focus of this study was on labour market outcomes of postsecondary graduates. However, previous research has suggested that higher education also confers non-pecuniary private and public benefits. To that end, the tax data contain various other outcomes, including marital status, childbearing and charitable donations. Follow-up research could examine the long-term relationship between postsecondary education and charitable donations or family formation decisions. In addition, the data have also been linked to the Canadian Mortality Database, so that examining the relationship between education level, field of study choice and mortality is also possible.
5 Tables and charts
| Men | Women | |||
|---|---|---|---|---|
| 1991 cohort | 2001 cohort | 1991 cohort | 2001 cohort | |
| mean | ||||
| Age on December 31 of first year of cohort (years) | 30.8 | 31.0 | 30.7 | 30.9 |
| percent | ||||
| Highest level of completed education | ||||
| No educational credentials | 33.2 | 21.5 | 33.0 | 19.4 |
| High school diploma | 25.0 | 24.9 | 30.6 | 23.1 |
| Trades certificate | 19.4 | 17.8 | 11.3 | 11.9 |
| College certificate | 12.7 | 19.1 | 16.8 | 25.9 |
| Bachelor's degree | 8.2 | 14.3 | 7.6 | 17.4 |
| Master's degree | 1.2 | 2.1 | 0.8 | 2.2 |
| Doctorate | 0.2 | 0.3 | 0.1 | 0.2 |
| Province or territory of birth | ||||
| Newfoundland and Labrador | 3.6 | 3.4 | 3.9 | 3.9 |
| Prince Edward Island | 0.7 | 0.6 | 0.7 | 0.6 |
| Nova Scotia | 4.5 | 3.7 | 4.9 | 4.2 |
| New Brunswick | 3.9 | 3.6 | 4.1 | 4.0 |
| Quebec | 33.9 | 33.0 | 33.6 | 31.1 |
| Ontario | 29.9 | 31.8 | 29.7 | 31.7 |
| Manitoba | 4.9 | 4.7 | 4.6 | 4.8 |
| Saskatchewan | 5.4 | 4.7 | 5.3 | 4.9 |
| Alberta | 7.2 | 7.4 | 6.9 | 7.6 |
| British Columbia | 6.0 | 6.8 | 6.2 | 6.9 |
| Yukon | 0.1 | 0.1 | 0.1 | 0.1 |
| Northwest Territories or Nunavut | 0.1 | 0.2 | 0.1 | 0.2 |
| number | ||||
| Sample size | 133,393 | 97,806 | 139,317 | 104,330 |
| Sources: Statistics Canada, Census of Population–T1 Personal Master File. | ||||
| Men | Women | |||
|---|---|---|---|---|
| 1991 cohort | 2001 cohort | 1991 cohort | 2001 cohort | |
| 2015 constant dollars | ||||
| No educational credentials | 526,351 | 523,915 | 155,934 | 172,742 |
| High school diploma | 708,115 | 723,499 | 308,442 | 344,012 |
| Trades certificate | 739,264 | 813,060 | 273,808 | 352,885 |
| College certificate | 917,660 | 938,882 | 475,553 | 517,658 |
| Educational, recreational and counselling services | 730,500 | 747,353 | 373,141 | 444,048 |
| Fine and applied arts | 674,874 | 711,140 | 293,015 | 369,726 |
| Humanities and related fields | 711,777 | 762,038 | 397,232 | 456,400 |
| Social sciences and related fields | 1,069,255 | 1,109,839 | 424,545 | 507,277 |
| Commerce, management and business administration | 890,903 | 890,912 | 469,207 | 529,330 |
| Agricultural, biological, nutritional, and food sciences | 622,389 | 666,175 | 352,113 | 397,009 |
| Engineering and applied sciences and technologies | 973,525 | 1,006,435 | 571,152 | 585,130 |
| Health professions and related technologies | 941,102 | 1,019,731 | 596,095 | 600,281 |
| Mathematics, computer and physical sciences | 932,901 | 917,718 | 582,224 | 623,861 |
| Bachelor's degree | 1,223,383 | 1,292,247 | 729,108 | 816,282 |
| Educational, recreational and counselling services | 994,389 | 1,048,580 | 684,586 | 791,748 |
| Fine and applied arts | Note ...: not applicable | Note ...: not applicable | 397,467 | 547,256 |
| Humanities and related fields | 837,632 | 987,408 | 628,257 | 696,297 |
| Social sciences and related fields | 1,177,109 | 1,296,924 | 727,480 | 768,290 |
| Commerce, management and business administration | 1,293,111 | 1,388,192 | 846,022 | 924,355 |
| Agricultural, biological, nutritional, and food sciences | 1,059,783 | 1,020,731 | 579,265 | 762,800 |
| Engineering and applied sciences and technologies | 1,474,215 | 1,538,106 | 955,925 | 1,081,357 |
| Health professions and related technologies | 1,248,697 | 1,400,673 | 819,776 | 950,769 |
| Mathematics, computer and physical sciences | 1,349,803 | 1,357,569 | 958,523 | 978,069 |
| Master's degree | 1,417,774 | 1,576,957 | 979,918 | 1,028,857 |
| Social sciences and related fields | 1,370,091 | 1,510,829 | 928,135 | 1,036,291 |
| Commerce, management and business administration | 1,721,181 | 1,940,623 | 1,354,749 | 1,395,535 |
| Engineering and applied sciences and technologies | 1,550,411 | 1,632,579 | Note F: too unreliable to be published | Note F: too unreliable to be published |
| Doctorate | 1,403,968 | 1,617,261 | Note F: too unreliable to be published | Note F: too unreliable to be published |
|
... not applicable F too unreliable to be published Sources: Statistics Canada, Census of Population–T1 Personal Master File. |
||||
| Men | Women | |||
|---|---|---|---|---|
| coefficient | bootstrap standard error | coefficient | bootstrap standard error | |
| No educational credentials | -6,164 | 5,025 | 12,563Note *** | 2,697 |
| High school diploma | 5,388 | 3,818 | 35,799Note *** | 3,657 |
| Trades certificate | 71,179Note *** | 4,219 | 71,999Note *** | 4,507 |
| College certificate | 20,423Note ** | 6,380 | 38,941Note *** | 3,619 |
| Educational, recreational and counselling services | -10,956 | 27,355 | 71,113Note *** | 10,848 |
| Fine and applied arts | 368 | 27,134 | 77,437Note *** | 15,971 |
| Humanities and related fields | 32,510 | 28,115 | 64,500Note ** | 23,004 |
| Social sciences and related fields | 43,717Table 3 Note † | 22,798 | 75,996Note *** | 14,344 |
| Commerce, management and business administration | -8,245 | 13,614 | 55,462Note *** | 5,691 |
| Agricultural, biological, nutritional, and food sciences | 28,472 | 21,361 | 45,400Note * | 19,817 |
| Engineering and applied sciences and technologies | 31,285Note *** | 7,938 | 16,179 | 18,798 |
| Health professions and related technologies | 77,874Note ** | 26,425 | 12,202 | 11,385 |
| Mathematics, computer and physical sciences | -21,733 | 56,492 | 86,826Table 3 Note † | 52,124 |
| Bachelor's degree | 65,585Note *** | 9,826 | 84,735Note *** | 6,344 |
| Educational, recreational and counselling services | 102,473Note *** | 13,465 | 116,607Note *** | 13,017 |
| Fine and applied arts | Note F: too unreliable to be published | Note F: too unreliable to be published | 138,968Note *** | 33,945 |
| Humanities and related fields | 127,153Note ** | 39,175 | 75,929Note *** | 22,445 |
| Social sciences and related fields | 115,026Note *** | 22,608 | 43,531Note * | 17,242 |
| Commerce, management and business administration | 62,134Note * | 24,395 | 70,166Note *** | 20,768 |
| Agricultural, biological, nutritional, and food sciences | -10,185 | 35,878 | 167,072Note *** | 34,832 |
| Engineering and applied sciences and technologies | 72,099Note *** | 17,110 | 83,773 | 57,624 |
| Health professions and related technologies | 126,251Note ** | 46,917 | 123,333Note *** | 14,809 |
| Mathematics, computer and physical sciences | 30,293 | 23,811 | 17,072 | 42,740 |
| Master's degree | 160,928Note *** | 26,735 | 55,681Note ** | 20,942 |
| Social sciences and related fields | 140,223Note * | 58,839 | 56,991 | 48,674 |
| Commerce, management and business administration | 263,708Note *** | 73,613 | 84,705 | 82,978 |
| Engineering and applied sciences and technologies | 99,216Table 3 Note † | 52,770 | Note F: too unreliable to be published | Note F: too unreliable to be published |
| Doctorate | 209,708Note *** | 60,893 | Note F: too unreliable to be published | Note F: too unreliable to be published |
F too unreliable to be published
Sources: Statistics Canada, Census of Population–T1 Personal Master File. |
||||
| Year 1 to year 8 | Year 9 to year 15 | |||
|---|---|---|---|---|
| coefficient | bootstrap standard error | coefficient | bootstrap standard error | |
| Men | ||||
| No educational credentials | 2,118 | 2,525 | -8,800Note *** | 2,521 |
| High school diploma | 4,432Note * | 1,869 | -541 | 1,818 |
| Trades certificate | 39,669Note *** | 2,400 | 30,997Note *** | 2,423 |
| College certificate | 11,968Note *** | 3,104 | 7,597Note * | 2,975 |
| Bachelor's degree | 43,120Note *** | 4,260 | 17,343Note ** | 5,793 |
| Master's degree | 85,135Note *** | 10,587 | 61,223Note *** | 18,445 |
| Doctorate | 100,802Note *** | 30,202 | 90,677Note *** | 26,987 |
| Women | ||||
| No educational credentials | 13,549Note *** | 1,415 | -691 | 1,424 |
| High school diploma | 22,527Note *** | 1,758 | 10,414Note *** | 2,097 |
| Trades certificate | 38,147Note *** | 2,394 | 32,548Note *** | 2,633 |
| College certificate | 17,743Note *** | 2,057 | 16,651Note *** | 1,900 |
| Bachelor's degree | 31,565Note *** | 3,603 | 47,942Note *** | 4,059 |
| Master's degree | -2,674 | 11,327 | 46,211Note *** | 12,679 |
| Doctorate | Note F: too unreliable to be published | Note F: too unreliable to be published | Note F: too unreliable to be published | Note F: too unreliable to be published |
F too unreliable to be published
Notes: Differences are adjusted for age, age squared, and province or territory of birth by median regression models that were estimated separately by sex and education level. Coefficients are expressed in 2015 constant dollars. Sources: Statistics Canada, Census of Population–T1 Personal Master File. |
||||
| Number of years with an employer-sponsored pension plan | Number of years of union membership | |||
|---|---|---|---|---|
| 1991 cohort | 2001 cohort | 1991 cohort | 2001 cohort | |
| mean | ||||
| Men | ||||
| No educational credentials | 4.5 | 3.7 | 4.8 | 3.6 |
| High school diploma | 6.4 | 5.7 | 5.6 | 4.4 |
| Trades certificate | 6.4 | 6.2 | 6.2 | 5.5 |
| College certificate | 7.7 | 7.4 | 5.7 | 5.0 |
| Bachelor's degree | 7.8 | 7.9 | 5.5 | 4.9 |
| Master's degree | 8.7 | 8.6 | 5.9 | 5.5 |
| Doctorate | 11.3 | 9.5 | 10.0 | 8.5 |
| Women | ||||
| No educational credentials | 2.5 | 2.4 | 2.6 | 2.2 |
| High school diploma | 4.5 | 4.3 | 3.4 | 2.9 |
| Trades certificate | 4.1 | 4.3 | 3.9 | 3.7 |
| College certificate | 6.1 | 6.2 | 5.3 | 4.9 |
| Bachelor's degree | 7.7 | 8.7 | 6.5 | 6.7 |
| Master's degree | 9.4 | 9.6 | 7.6 | 7.3 |
| Sources: Statistics Canada, Census of Population–T1 Personal Master File. | ||||
| Number of years with an employer-sponsored pension plan | Number of years of union membership | |||
|---|---|---|---|---|
| coefficient | bootstrap standard error | coefficient | bootstrap standard error | |
| Men | ||||
| No educational credentials | -0.770Note *** | 0.061 | -1.294Note *** | 0.065 |
| High school diploma | -0.663Note *** | 0.077 | -1.245Note *** | 0.070 |
| Trades certificate | -0.142 | 0.098 | -0.901Note *** | 0.094 |
| College certificate | -0.356Note ** | 0.115 | -0.702Note *** | 0.092 |
| Bachelor's degree | 0.280Note * | 0.123 | -0.913Note *** | 0.096 |
| Master's degree | 0.134 | 0.351 | -0.658Note ** | 0.253 |
| Doctorate | -3.219Note *** | 0.951 | -2.919Note ** | 0.907 |
| Women | ||||
| No educational credentials | -0.169Note *** | 0.040 | -0.372Note *** | 0.044 |
| High school diploma | -0.298Note *** | 0.063 | -0.389Note *** | 0.052 |
| Trades certificate | 0.258Note ** | 0.085 | -0.271Note *** | 0.079 |
| College certificate | 0.215Note ** | 0.080 | -0.442Note *** | 0.067 |
| Bachelor's degree | 1.412Note *** | 0.134 | -0.076 | 0.110 |
| Master's degree | 0.272 | 0.348 | -0.449 | 0.377 |
Sources: Statistics Canada, Census of Population–T1 Personal Master File. |
||||
Data table for Chart 1
| Years since start of cohort | 1991 cohort | 2001 cohort |
|---|---|---|
| 2015 constant dollars | ||
| 0 | 30,470 | 29,811 |
| 1 | 30,515 | 30,688 |
| 2 | 31,215 | 31,501 |
| 3 | 33,095 | 32,707 |
| 4 | 33,552 | 33,031 |
| 5 | 33,931 | 34,134 |
| 6 | 35,312 | 34,732 |
| 7 | 36,180 | 35,227 |
| 8 | 37,105 | 34,190 |
| 9 | 37,940 | 35,261 |
| 10 | 38,011 | 36,134 |
| 11 | 38,026 | 36,841 |
| 12 | 37,931 | 37,357 |
| 13 | 38,641 | 37,414 |
| 14 | 38,756 | 37,362 |
| Sources: Statistics Canada, Census of Population–T1 Personal Master File. | ||
Data table for Chart 2
| Years since start of cohort | 1991 cohort | 2001 cohort |
|---|---|---|
| 2015 constant dollars | ||
| 0 | 41,885 | 41,643 |
| 1 | 42,954 | 42,891 |
| 2 | 43,446 | 43,907 |
| 3 | 45,137 | 45,315 |
| 4 | 45,748 | 46,409 |
| 5 | 46,141 | 47,440 |
| 6 | 47,111 | 48,532 |
| 7 | 48,625 | 49,264 |
| 8 | 49,261 | 48,225 |
| 9 | 50,162 | 49,308 |
| 10 | 50,135 | 50,054 |
| 11 | 50,694 | 50,854 |
| 12 | 50,561 | 51,712 |
| 13 | 51,251 | 52,124 |
| 14 | 51,498 | 52,076 |
| Sources: Statistics Canada, Census of Population–T1 Personal Master File. | ||

Data table for Chart 3
| Years since start of cohort | 1991 cohort | 2001 cohort |
|---|---|---|
| 2015 constant dollars | ||
| 0 | 44,169 | 46,912 |
| 1 | 44,877 | 48,200 |
| 2 | 44,973 | 48,826 |
| 3 | 46,838 | 50,484 |
| 4 | 47,716 | 51,682 |
| 5 | 48,373 | 52,957 |
| 6 | 49,655 | 54,257 |
| 7 | 50,847 | 55,362 |
| 8 | 51,785 | 54,469 |
| 9 | 52,885 | 55,443 |
| 10 | 52,763 | 56,496 |
| 11 | 53,033 | 57,418 |
| 12 | 53,202 | 58,711 |
| 13 | 53,969 | 59,376 |
| 14 | 54,695 | 59,411 |
| Sources: Statistics Canada, Census of Population–T1 Personal Master File. | ||
Data table for Chart 4
| Years since start of cohort | 1991 cohort | 2001 cohort |
|---|---|---|
| 2015 constant dollars | ||
| 0 | 52,388 | 52,785 |
| 1 | 54,079 | 54,467 |
| 2 | 54,747 | 55,911 |
| 3 | 56,543 | 57,677 |
| 4 | 57,756 | 59,469 |
| 5 | 58,524 | 61,470 |
| 6 | 60,117 | 62,959 |
| 7 | 61,936 | 64,325 |
| 8 | 63,273 | 64,630 |
| 9 | 64,658 | 65,350 |
| 10 | 65,310 | 66,143 |
| 11 | 65,910 | 67,130 |
| 12 | 65,788 | 68,784 |
| 13 | 67,071 | 69,355 |
| 14 | 67,887 | 69,833 |
| Sources: Statistics Canada, Census of Population–T1 Personal Master File. | ||

Data table for Chart 5
| Years since start of cohort | 1991 cohort | 2001 cohort |
|---|---|---|
| 2015 constant dollars | ||
| 0 | 64,023 | 67,710 |
| 1 | 67,164 | 71,145 |
| 2 | 68,698 | 73,512 |
| 3 | 71,692 | 77,406 |
| 4 | 73,705 | 80,456 |
| 5 | 75,786 | 83,279 |
| 6 | 78,262 | 85,846 |
| 7 | 81,437 | 88,410 |
| 8 | 84,438 | 89,948 |
| 9 | 87,329 | 90,704 |
| 10 | 89,008 | 91,902 |
| 11 | 90,192 | 93,020 |
| 12 | 90,562 | 95,110 |
| 13 | 92,008 | 95,518 |
| 14 | 93,783 | 96,213 |
| Sources: Statistics Canada, Census of Population–T1 Personal Master File. | ||
Data table for Chart 6
| Years since start of cohort | 1991 cohort | 2001 cohort |
|---|---|---|
| 2015 constant dollars | ||
| 0 | 73,693 | 80,858 |
| 1 | 78,322 | 84,674 |
| 2 | 80,786 | 87,669 |
| 3 | 83,942 | 91,226 |
| 4 | 85,381 | 96,571 |
| 5 | 87,619 | 100,902 |
| 6 | 89,361 | 104,271 |
| 7 | 94,506 | 107,529 |
| 8 | 98,980 | 110,677 |
| 9 | 101,017 | 110,404 |
| 10 | 102,208 | 110,366 |
| 11 | 105,802 | 112,362 |
| 12 | 105,647 | 118,424 |
| 13 | 106,911 | 114,458 |
| 14 | 109,195 | 114,773 |
| Sources: Statistics Canada, Census of Population–T1 Personal Master File. | ||

Data table for Chart 7
| Years since start of cohort | 1991 cohort | 2001 cohort |
|---|---|---|
| 2015 constant dollars | ||
| 0 | 75,241 | 77,768 |
| 1 | 78,911 | 83,052 |
| 2 | 80,206 | 85,742 |
| 3 | 83,495 | 89,703 |
| 4 | 82,971 | 91,613 |
| 5 | 85,224 | 100,344 |
| 6 | 88,095 | 105,685 |
| 7 | 92,959 | 108,392 |
| 8 | 96,181 | 114,835 |
| 9 | 101,544 | 113,923 |
| 10 | 103,782 | 115,328 |
| 11 | 108,548 | 120,354 |
| 12 | 112,452 | 125,871 |
| 13 | 117,667 | 124,454 |
| 14 | 117,620 | 129,894 |
| Sources: Statistics Canada, Census of Population–T1 Personal Master File. | ||
Data table for Chart 8
| Years since start of cohort | 1991 cohort | 2001 cohort |
|---|---|---|
| 2015 constant dollars | ||
| 0 | 4,263 | 5,632 |
| 1 | 4,178 | 6,330 |
| 2 | 4,009 | 6,589 |
| 3 | 4,500 | 7,676 |
| 4 | 5,214 | 8,382 |
| 5 | 5,995 | 8,984 |
| 6 | 7,055 | 9,833 |
| 7 | 9,138 | 10,600 |
| 8 | 10,469 | 10,908 |
| 9 | 11,819 | 11,562 |
| 10 | 12,848 | 12,320 |
| 11 | 13,653 | 13,414 |
| 12 | 14,229 | 13,912 |
| 13 | 14,777 | 13,985 |
| 14 | 14,959 | 14,750 |
| Sources: Statistics Canada, Census of Population–T1 Personal Master File. | ||
Data table for Chart 9
| Years since start of cohort | 1991 cohort | 2001 cohort |
|---|---|---|
| 2015 constant dollars | ||
| 0 | 15,472 | 17,680 |
| 1 | 15,674 | 17,880 |
| 2 | 15,429 | 18,653 |
| 3 | 16,049 | 19,290 |
| 4 | 16,754 | 19,763 |
| 5 | 17,297 | 21,086 |
| 6 | 18,688 | 22,327 |
| 7 | 20,594 | 23,337 |
| 8 | 21,804 | 23,982 |
| 9 | 23,306 | 24,921 |
| 10 | 24,152 | 25,660 |
| 11 | 25,006 | 26,483 |
| 12 | 25,504 | 27,250 |
| 13 | 26,441 | 27,775 |
| 14 | 26,814 | 28,490 |
| Sources: Statistics Canada, Census of Population–T1 Personal Master File. | ||

Data table for Chart 10
| Years since start of cohort | 1991 cohort | 2001 cohort |
|---|---|---|
| 2015 constant dollars | ||
| 0 | 14,736 | 18,532 |
| 1 | 14,473 | 18,310 |
| 2 | 14,203 | 19,033 |
| 3 | 14,346 | 19,811 |
| 4 | 14,993 | 20,173 |
| 5 | 15,386 | 21,281 |
| 6 | 16,261 | 22,481 |
| 7 | 17,774 | 23,571 |
| 8 | 19,109 | 24,354 |
| 9 | 20,397 | 25,247 |
| 10 | 21,056 | 26,372 |
| 11 | 21,908 | 27,047 |
| 12 | 22,672 | 28,323 |
| 13 | 23,447 | 28,980 |
| 14 | 23,817 | 29,220 |
| Sources: Statistics Canada, Census of Population–T1 Personal Master File. | ||

Data table for Chart 11
| Years since start of cohort | 1991 cohort | 2001 cohort |
|---|---|---|
| 2015 constant dollars | ||
| 0 | 27,347 | 29,618 |
| 1 | 27,591 | 29,350 |
| 2 | 27,509 | 29,742 |
| 3 | 28,090 | 30,688 |
| 4 | 28,684 | 31,473 |
| 5 | 29,503 | 32,850 |
| 6 | 30,261 | 34,414 |
| 7 | 31,825 | 35,485 |
| 8 | 33,249 | 36,629 |
| 9 | 34,567 | 37,496 |
| 10 | 35,175 | 38,161 |
| 11 | 36,086 | 38,898 |
| 12 | 36,592 | 40,028 |
| 13 | 37,506 | 40,389 |
| 14 | 37,769 | 41,036 |
| Sources: Statistics Canada, Census of Population–T1 Personal Master File. | ||

Data table for Chart 12
| Years since start of cohort | 1991 cohort | 2001 cohort |
|---|---|---|
| 2015 constant dollars | ||
| 0 | 40,951 | 45,482 |
| 1 | 41,660 | 45,403 |
| 2 | 41,467 | 46,305 |
| 3 | 42,490 | 47,536 |
| 4 | 43,356 | 48,484 |
| 5 | 44,729 | 50,339 |
| 6 | 45,724 | 52,457 |
| 7 | 48,726 | 54,844 |
| 8 | 50,422 | 57,519 |
| 9 | 52,479 | 59,265 |
| 10 | 52,952 | 60,819 |
| 11 | 54,766 | 62,548 |
| 12 | 55,820 | 64,824 |
| 13 | 57,173 | 65,830 |
| 14 | 58,634 | 67,500 |
| Sources: Statistics Canada, Census of Population–T1 Personal Master File. | ||
Data table for Chart 13
| Years since start of cohort | 1991 cohort | 2001 cohort |
|---|---|---|
| 2015 constant dollars | ||
| 0 | 57,681 | 57,879 |
| 1 | 61,449 | 58,898 |
| 2 | 61,130 | 60,044 |
| 3 | 63,222 | 61,506 |
| 4 | 61,823 | 62,384 |
| 5 | 62,981 | 65,645 |
| 6 | 63,891 | 67,400 |
| 7 | 65,275 | 69,556 |
| 8 | 67,917 | 74,704 |
| 9 | 69,264 | 75,534 |
| 10 | 69,269 | 77,154 |
| 11 | 71,911 | 78,911 |
| 12 | 74,511 | 81,244 |
| 13 | 75,376 | 81,971 |
| 14 | 75,753 | 82,682 |
| Sources: Statistics Canada, Census of Population–T1 Personal Master File. | ||
Data table for Chart 14
| Years since start of cohort | 1991 cohort | 2001 cohort |
|---|---|---|
| percent | ||
| -10 | 6.0 | 9.2 |
| -9 | 8.9 | 10.0 |
| -8 | 10.0 | 10.3 |
| -7 | 9.8 | 9.4 |
| -6 | 9.1 | 8.5 |
| -5 | 8.3 | 8.6 |
| -4 | 7.7 | 7.8 |
| -3 | 6.9 | 7.1 |
| -2 | 6.8 | 6.4 |
| -1 | 7.3 | 5.7 |
| 0 | 9.2 | 6.2 |
| 1 | 10.0 | 6.6 |
| 2 | 10.3 | 6.4 |
| 3 | 9.4 | 6.0 |
| 4 | 8.5 | 5.8 |
| 5 | 8.6 | 5.3 |
| 6 | 7.8 | 5.1 |
| 7 | 7.1 | 5.1 |
| 8 | 6.4 | 7.1 |
| 9 | 5.7 | 6.9 |
| 10 | 6.2 | 6.3 |
| 11 | 6.6 | 6.0 |
| 12 | 6.4 | 5.9 |
| 13 | 6.0 | 5.8 |
| 14 | 5.8 | 5.8 |
| Source: Statistics Canada, Labour Force Survey (Table 14-10-0018-01). | ||
References
Finnie, R., and M. Frenette. 2003. “Earning differences by major field of study: Evidence from three cohorts of recent Canadian graduates.” Economics of Education Review 22 (2): 179–192.
Frank, K., M. Frenette, and R. Morissette. 2015. Labour Market Outcomes of Young Postsecondary Graduates, 2005 to 2012. Economic Insights, no. 50. Statistics Canada Catalogue no. 11-626-X. Ottawa: Statistics Canada.
Frenette, M. 2014. An Investment of a Lifetime? The Long-term Labour Market Premiums Associated with a Postsecondary Education. Analytical Studies Branch Research Paper Series, no. 359. Statistics Canada Catalogue no. 11F0019M. Ottawa: Statistics Canada.
Frenette, M. 2017. Postsecondary Enrolment by Parental Income: Recent National and Provincial Trends. Economic Insights, no. 70. Statistics Canada Catalogue no. 11-626-X. Ottawa: Statistics Canada.
Frenette, M., and R. Morissette. 2014. Wages and Full-time Employment Rates of Young High School Graduates and Bachelor’s Degree Holders, 1997 to 2012. Analytical Studies Branch Research Paper Series, no. 360. Statistics Canada Catalogue no. 11F0019M. Ottawa: Statistics Canada.
Galarneau, D., C. Hinchley, and A. Ntwari. 2017. “Labour market outcomes of graduates from universities in the Maritime provinces.” Insights on Canadian Society (April). Statistics Canada Catalogue no. 75-006-X. Ottawa: Statistics Canada.
Oreopoulos, P., and U. Petronijevic. 2013. “Making college worth it: A review of the returns to higher education.” The Future of Children 23 (1): 41–65.
Oreopoulos, P., T. von Wachter, and A. Heisz. 2012. “The short- and long-term career effects of graduating in a recession.” American Economic Journal: Applied Economics 4 (1): 1–29.
Ostrovsky, Y., and M. Frenette. 2014. The Cumulative Earnings of Postsecondary Graduates Over 20 Years: Results by Field of Study. Economic Insights, no. 40. Statistics Canada Catalogue no. 11-626-X. Ottawa: Statistics Canada.
Pinault, P., P. Finès, F. Labrecque-Synnott, A. Saidi, and M. Tjepkema. 2016. The 2001 Canadian Census–Tax–Mortality Cohort: A 10-Year Follow-up. Analytical Studies: Methods and References, no. 3. Statistics Canada Catalogue no. 11-633-X. Ottawa: Statistics Canada.
Statistics Canada, n.d. Table 17-10-0059-01 Estimates of the components of natural increase, quarterly. (accessed September 4, 2018).
Walters, D. 2004. “A comparison of labour market outcomes of postsecondary graduates of various levels and fields over a four-cohort period.” Canadian Journal of Sociology 29 (1): 1–27.
Wilkins, R., M. Tjepkema, C. Mustard, and R. Choinière. 2008. “The Canadian census mortality follow-up study, 1991 through 2001.” Health Reports 19 (3): 25–43. Statistics Canada Catalogue no. 82-003-X.
- Date modified: