
Analytical Studies Branch Research Paper Series
Who Are the Working Women in Canada’s Top 1%?

Archived Content
Information identified as archived is provided for reference, research or recordkeeping purposes. It is not subject to the Government of Canada Web Standards and has not been altered or updated since it was archived. Please "contact us" to request a format other than those available.
Acknowledgements
This study is funded by the Department for Women and Gender Equality.
Abstract
Rising income inequality in industrialized nations has motivated research on high-income Canadians and how they differ from the general population. Despite notable advancements in education and labour force participation over the last half century, women continue to be less represented relative to men among top income groups, accounting for one in five workers in Canada’s top 1% in 2015. This paper fills an important information gap by providing a gender-based analysis of key socio-demographic and employment characteristics of working women and men in the top 1%, based on the 2016 Census of Population.
Keywords: Women in the labour market, hours of work, unpaid work, high income, employment and unemployment
Executive summary
Within the context of rising income inequality in industrialized nations, researchers have examined high-income Canadians (Lemieux and Riddell 2015; Murphy, Roberts and Wolfson 2007; Statistics Canada 2013). Despite notable advancements in educational attainment over the last half century, women continue to be less represented relative to men in top income groups, accounting for one in five workers in the top 1% and one in eight workers in the top 0.1% in 2015. Forthcoming research shows that the underrepresentation of women in top income groups is responsible for an increasingly large share of the gender pay gap (Fortin, Bonikowska and Drolet forthcoming). This study addresses an important information gap in the literature by providing a gender-based analysis of the top 1% in terms of socio-economic characteristics, exploring differences in income levels and hours of paid work.
Leveraging linked tax data from the 2016 Census of Population, sex-disaggregated estimates are presented by income group. Thresholds are calculated based on total income, which includes employment, self-employment and investment income. This paper presents a gender-based analysis of workers in the top 1%, individuals with a total income of $270,900 or more in 2015. In total, about 35,000 women and 137,000 men were included in the top 1%.
Working women in the top 1% were relatively younger than their male counterparts and have obtained a higher level of educational attainment. Further, working women in the top 1% were more likely than their male counterparts to hold a degree above the bachelor’s level and to have studied in medicine or related fields. Consistent with the overrepresentation of women in health across the income distribution, the widest occupational gender gaps for workers in the top 1% were observed in management and health. Women in the top 1% were almost twice as likely as their male counterparts to work in health occupations, typically as physicians, accounting for one in five women in this income bracket. Conversely, men in the top 1% were more likely to work in management, such as in senior management positions, representing over one in three working men in the top 1%. While about one in five workers in the top 1% were immigrants, visible minorities and Indigenous people were substantially underrepresented, relative to their representation in the working population.
Notable gender disparities were observed for family status and presence of children. Working women in the top 1% were less likely than their male counterparts to be married or in a common-law relationship, accounting for 77.3% of women and 88.4% of men. Differences extended to the presence of children, as women were less likely than men to have children and when they did, they had fewer children. Specifically, 52.3% of core-aged women in the top 1% had two or more children, compared to 62.9% of their male counterparts.
Notwithstanding their higher educational attainment, working women in the top 1% had lower incomes than their male counterparts. On average, working women in the top 1% had a median income of $362,300, compared to $393,200 for their male counterparts. Where women were underrepresented, such as in senior management roles, income gaps were wider, while in health, where women were well represented and salaries are typically influenced by government policies, the gaps were narrower.
On average, working women in the top 1% spent slightly fewer hours on paid work than their male counterparts, with more notable differences for those who were married or in a common-law relationship or with children. Specifically, women in the top 1% who were married or in a common-law relationship or those with one or two children worked an average of 42 hours, about 5 hours less than their male counterparts.
1 Introduction
Over the last few decades, top income shares in Canada have increased substantially, nearly matching the gains in the United States (Saez and Veall 2005). On the evolution of income inequality in North America over the 20th century, Saez and Veall (2005) highlight that top income shares were relatively stable from the 1940s to the 1980s, prior to sharp increases in the 1990s. Top income shares peaked in 2006, as the top 1% in Canada accounted for 12.1% of total income accrued, compared with 7.1% in 1982. Given that top income shares are influenced by the business cycle (Saez and Veall 2005; Lemieux and Riddell 2015), shares in Canada declined during the 2008-2009 recession and remained below peak levels, prior to edging up to 11.2% in 2015. Rising income inequality in industrialized nations has motivated research on the socio-economic characteristics of individuals in top income groups. Previous work has shown that high-income Canadians, mainly men, are more likely than the general population to obtain a higher level of education, to work in health or senior management and to work longer hours (Lemieux and Riddell 2015).Note 1
While top income shares have increased markedly over the last few decades, the representation of women among top income groups has lagged in comparison (Fortin, Bell and Böhm 2017). Relative to their share in the labour force, women continue to be less represented among top income groups, representing one in five workers in the top 1% in 2015.Note 2 Researchers are beginning to explore gender differences among top income groups (Fortin, Bell and Böhm 2017; Fortin, Bonikowska and Drolet forthcoming; and Guvenen, Kaplan and Song 2014), responding to an important information gap in the literature. This paper helps to address this information gap by providing a gender-based analysis of the top 1%, informing on women who are breaking the glass ceiling.
Exploring the relationship between the gender pay gap and the underrepresentation of women in top income groups, Fortin, Bell and Böhm (2017) highlight that representation has increased at a slower pace than earnings growth for those in top income groups since the 1980s. Using administrative data from Canada, Sweden and the United Kingdom, the study shows that the underrepresentation of women in top income groups accounts for half or more of the gender pay gap in each country. Even when accounting for age, education, occupation and industry, the share of the gap explained by underrepresentation remains significant, from about one fifth to half of the total gap. Notably, the share of the gap explained by underrepresentation has widened over time, from 1983 to 2010.
Expanding on these findings, research by Fortin, Bonikowska and Drolet (forthcoming) using administrative data simulates gender gaps for different scenarios, examining the impact of vertical and horizontal industry differences on the gender pay gap. The study shows that vertical differences within industries, i.e., women not reaching the same income groups as men within industries, is central to the persistence of the gender pay gap in Canada (Fortin, Bonikowska and Drolet forthcoming).
Guvenen, Kaplan and Song (2014) provide the most comprehensive study to date on the socio-economic characteristics of women and men in top income groups. Using social security data from the United States, the study highlights that while women have made inroads into the top 1% in the 1980s and 1990s, there has been little improvement since then. Moreover, the top 0.1% continues to be out of reach for most women. The study also finds that life cycle patterns for lifetime top earners differ substantially, as the gender earnings gap widens for workers in their 30s but narrows prior to retirement.
Essentially, the paper describes working women in the top 1%, focussing on how they differ from men in the same income bracket in terms of key demographic and employment characteristics. It also highlights income differences and disparities in hours of paid work. Section 2 offers an overview of the data used in this study. Section 3 provides a profile of working women in the top 1% based on key socio-economic characteristics, showing differences with their male counterparts. Section 4 begins to explore disparities in income levels for the top 1%, including an analysis by occupation, while Section 5 provides an analysis of the differences in hours of paid work.
2 Data
Previous studies on female high-income earners outlined in the literature review used longitudinal administrative data. These studies focussed on employment and self-employment earnings declared to national tax agencies, using a threshold calculated from minimum wages and hours to determine employment status. While these studies provide insights on the evolution of patterns over time, the databases used limit the analysis to a few socio-economic characteristics, such as age and industry.
Leveraging data from the 2016 Census of Population, a cross-sectional data set, this study provides a detailed gender-based analysis of workers in the top 1% using sex-disaggregated estimates. Results are based on the long-form questionnaire, a mandatory survey sampling one in four households in 2016. However, when relevant, results from the 2006 Census are used to inform on the evolution of patterns over the last decade. To reduce respondent burden and improve the quality and quantity of income statistics, the 2016 Census of Population gathered income information solely from administrative data sources. Hence, data used in this study provide high-quality information on income for 2015, the year prior to the census, permitting a detailed analysis of socio-economic indicators for those in top income groups, a relatively small share of the population.
For the purposes of this study, the population selected is restricted to those who were 15 years of age or older and who reported that they were employed in the week prior to Census Day. To determine those included in top income groups, thresholds were calculated using total income. Total income is defined as before-tax income and includes employment wages and salaries, self-employment income and investment income, retirement income from private sources, other income from private sources and government transfers. While retirement income and government transfers make up a relatively small portion of total income for the top 1%, self-employment and investment income are important sources,Note 3 often a major source of income for physicians, executives and business owners.Note 4 Thus, consistent with the literature on top income groups by Statistics Canada and to ensure that physicians, executives and business owners are represented in the study, total income was selected.
The income distribution is presented in mutually exclusive groups; the bottom 90%, the next 5%, the next 4% and the top 1%. Workers needed a total individual income of $270,900 to be included the top 1% in 2015 (see Table 1). Workers who were included in the top 5%, but not the top 1% (those with a total income between $135,900 and $270,900 in 2015), were assigned to the next 4%. Similarly, those who were included in the top 10%, but not the top 5%, were assigned to the next 5% (i.e., with an income of at least $105,000 and less than $135,900), while those with an income below $105,000 were assigned to the bottom 90%.
For major socio-economic characteristics, notable differences between women and men were observed for both the top 1% and the next 4%. However, the gender gaps observed were consistently wider for the top 1%. For this reason, the analysis focusses on differences for working women and men in the top 1%. The tables present sex-disaggregated estimates for the bottom 90%, the next 5%, the next 4% and the top 1%.
3 Socio-economic characteristics
Women represented one in five workers in the top 1% in 2015
Women represented one in five workers in the top 1% in 2015 (Chart 1), relative to almost one in two in the working population. In total, about 35,000 women and 137,000 men were included in the top 1% (Table 2). Over the last decade, the representation of women in top income groups increased, advancing from about one in six for the top 1% in 2005 (16.0%). Relative to industrialized countries with similar measures for top income groups, the representation of women in the top 1% in Canada was comparable to other countries, including Norway and Denmark (Atkinson, Casarico and Voitchovsky 2016) and the United States (Guvenen, Kaplan and Song 2014, p.11–15).
Very few women made it to the apex of the income distribution, the top 0.1%. Women represented about one in eight workers in the top 0.1% in 2015. In total, about 2,200 women and 15,000 men reached the top 0.1% in 2015.
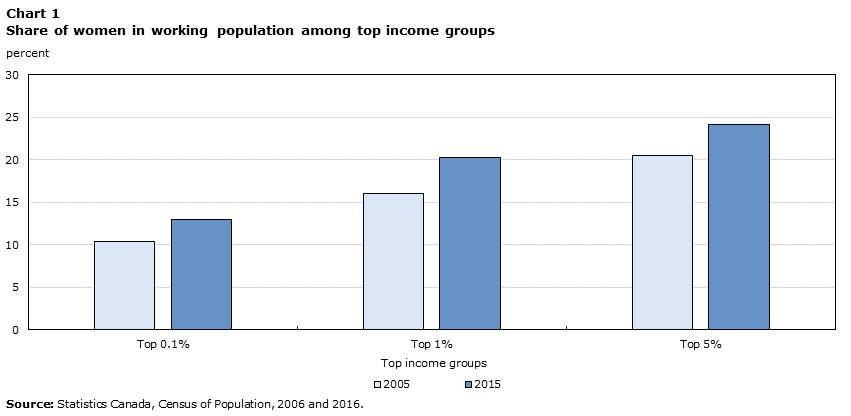
Data table for Chart 1
| Top income groups | 2015 | 2005 |
|---|---|---|
| percent | ||
| Top 0.1% | 13.0 | 10.4 |
| Top 1% | 20.3 | 16.0 |
| Top 5% | 24.2 | 20.5 |
| Source: Statistics Canada, Census of Population, 2006 and 2016. | ||
Working women in the top 1% relatively younger than their male counterparts
Working women in the top 1% were relatively younger than their male counterparts. About two thirds of working women in the top 1% were between 25 and 54 in 2015, compared with almost 60% of men (Table 4). Likewise, 27.0% of working women in the top 1% were between 25 and 44, relative to 23.3% of their male counterparts. Compared to a decade ago, working women and men in the top 1% are relatively older, consistent with trends for the bottom 90%, which reflects ageing demographics in Canada.
About three quarters of women in the top 1% obtained a bachelor’s degree or higher
Previous literature shows that Canadians in top income groups have obtained a higher level of education than the general population (Lemieux and Riddell 2015; Statistics Canada 2013). Consistent with patterns for workers in the bottom 90%, working women in the top 1% obtained a higher level of education than their male counterparts, although the educational gender gap was narrower among workers in the top 1%.
About three quarters of working women in the top 1% obtained a bachelor’s degree or higher in 2015 (Chart 2 or Table 7). Specifically, 74.2% of women obtained a bachelor’s degree or more, compared with 70.0% of their male counterparts. Even more, working women in the top 1% were more likely than their male counterparts to have obtained a university certificate or diploma above the bachelor’s level, accounting for 41.3% of women, compared to 34.7% of men. Educational attainment for workers in the top 1% informs on occupational differences, as women were more than one and half times more likely than their male counterparts to have obtained a degree in medicine, dentistry, veterinary medicine or optometry, representing 14.7% of women in this income group.
Over the last two decades, educational attainment for the general population has increased at a faster pace for women than for men, as the proportion of women aged 25 to 64 with a university certificate or degree more than doubled from 1991 to 2015 (Ferguson 2016). Likewise, the share of workers in the top 1% with a bachelor’s degree increased by about 4 percentage points for both women and men from 2005 to 2015. Similar gains were observed for a master’s degree, but increasing to a slightly greater extent for women than for men.

Data table for Chart 2
| Highest level of educational attainment | Women | Men |
|---|---|---|
| percent | ||
| Bachelor's degree | 32.9 | 35.3 |
| University certificate or diploma above bachelor level | 4.6 | 4.9 |
| Degree in medicine, dentistry, veterinary medicine or optometry | 14.7 | 8.8 |
| Master's degree | 18.5 | 17.5 |
| Earned doctorate degree | 3.5 | 3.5 |
| Source: Statistics Canada, Census of Population, 2016. | ||
Largest educational gender gaps for top 1% observed in architecture, engineering and related technologies
Despite advancements in educational attainment over the last two decades, women continue to be underrepresented in science, technology, engineering and mathematics (STEM), predominantly in engineering, mathematics and computer science (Ferguson 2016; Hango 2013; Moyser 2017), fields associated with the highest earnings for bachelor’s degree graduates (Frenette and Frank 2016).Note 5 Young women continue to be less likely than young men to choose STEM fields and are also less likely to work in STEM when they study in those fields (Ferguson 2016).
Regardless of income level, the widest educational gender gaps for workers with a bachelor’s degree or more were in architecture, engineering and related technologies (Chart 3 or Table 7). Working women in the top 1% were four times less likely than their male counterparts to have studied in this field, accounting for 4.0% of women. Representation in physical and life sciences and technology was comparable among workers in the top 1% (5.7% of women versus 5.8% of men). Similarly, 2.2% of working women in the top 1% studied mathematics, computer science and information sciences, compared to 3.2% of men. Survey results from the Pew Research Center (2018) suggest that discrimination may be important in explaining this gap. Notably, 50% of women in STEM and 78% of women in STEM in male-dominated work environments reported experiencing gender discrimination at work in the United States, compared to 19% of men in STEM. Further, almost one third of women in STEM reported lower pay than a man doing the same job.
Consistent with occupational patterns, women were overrepresented in health and related fields. Over one in five working women in the top 1% studied in health. Specifically, 27.2% of women, compared with 16.2% of men. Working women in the top 1% were also more likely to have studied social and behavioural sciences and law, representing 22.2% of women and 18.0% of men. Conversely, over one third of working men in the top 1% studied business, management and public administration, the main field of study for the top 1%, accounting for 35.8% of men and 28.5% of women.

Data table for Chart 3
| Selected fields of study | Women | Men |
|---|---|---|
| percent | ||
| Humanities | 5.3 | 2.8 |
| Social and behavioural sciences and law | 22.2 | 18.0 |
| Business, management and public administration | 28.5 | 35.8 |
| Physical and life sciences and technologies | 5.7 | 5.8 |
| Mathematics, computer and information sciences | 2.2 | 3.2 |
| Architecture, engineering, and related technologies | 4.0 | 16.1 |
| Health and related fields | 27.2 | 16.2 |
| Source: Statistics Canada, Census of Population, 2016. | ||
One in five women in the top 1% employed in health
Women have made great strides in educational attainment and labour force participation over the last half century, yet during the same period, occupational gender differences have persisted, contributing to deep-rooted attitudes towards gender roles (Fortin and Huberman 2002). Typical occupations for high-income Canadians include physicians, senior managers and financial workers (Lemieux and Riddell 2015; Statistics Canada 2013). Both women and men in the top 1% were more likely to be employed in these three occupations than workers in the bottom 90%, yet notable occupational gender gaps were apparent. Working women in the top 1% were more likely than their male counterparts to work in health and business, and less likely to work in management or natural and applied sciences, patterns that have become more entrenched over the last decade.
By broad occupational group, the widest occupational gender gaps for workers in the top 1% were observed in management and health occupations (Chart 4). Working women in the top 1% were almost twice as likely as their male counterparts to be employed in health, accounting for 20.3% of women and 11.4% of men (Table 8). Over the last decade, the number of women working as general practitioners and family physicians across the income distribution has grown notably, now representing one in two, and there are more than one in three specialist physicians who are women in 2015. Among workers in the top 1%, 10.0% of women and 5.8% of men were specialist physicians, while 6.1% of women and 3.3% of men were general practitioners and family physicians.
Management and business major top 1% occupations
Consistent with patterns for the bottom 90%, working women in the top 1% were about three times less likely than their male counterparts to work in natural and applied sciences and related occupations, representing 3.4% of women and 9.9% of men. Over the last decade, the proportion of working men in the top 1% employed in natural and applied sciences and related occupations has increased. By contrast, it was relatively unchanged for working women in the top 1% during the same period.
Among workers in the top 1%, 22.6% of women and 15.3% of men were working in business, finance and administration. Women in the top 1% were also more likely to work in occupations in education, law and social, community and government services, accounting for 13.5% women, compared with 9.2% of their male counterparts.
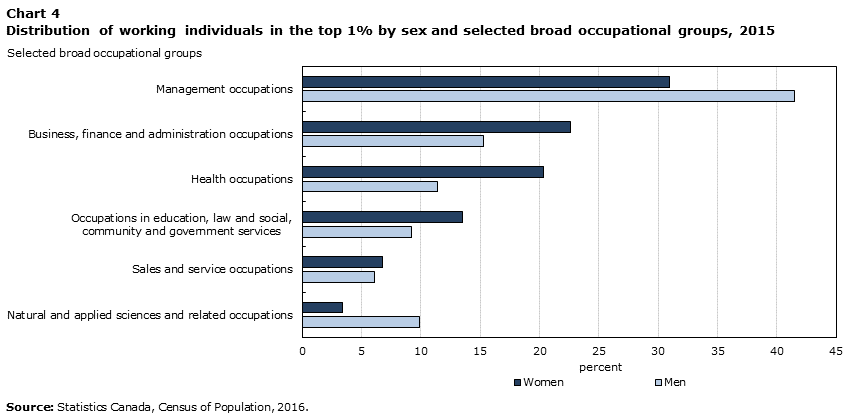
Data table for Chart 4
| Selected broad occupational groups | Women | Men |
|---|---|---|
| percent | ||
| Natural and applied sciences and related occupations | 3.4 | 9.9 |
| Sales and service occupations | 6.8 | 6.1 |
| Occupations in education, law and social, community and government services | 13.5 | 9.2 |
| Health occupations | 20.3 | 11.4 |
| Business, finance and administration occupations | 22.6 | 15.3 |
| Management occupations | 31.0 | 41.5 |
| Source: Statistics Canada, Census of Population, 2016. | ||
Women accounted for one in seven senior managers among the top 1%
While women in the top 1% were well represented in health and business, they were underrepresented in management occupations, notably senior management. Among the top 1%, 41.5% of men worked in management, compared with 31.0% of women. Representation in senior management accounted for more than half of this occupational gender gap, accounting for 13.2% of working women in the top 1%, compared with 19.1% of their male counterparts.Note 6 Taken together, management and business were key occupations for workers in the top 1%, representing over half of both women and men.
To ensure full participation in leadership and influence in decision making, the share of women in managerial positions has been identified as a target for gender equality and empowerment under the United Nation’s Sustainable Development Goals (UN Women 2018). Worldwide, women continue to be underrepresented in senior management and middle management positions, representing one in three managers (UN Women 2018, p. 98). In Canada, women accounted for one in four senior managers in 2015, as 160,700 men worked as senior managers, compared with 60,700 women. Representation in senior management declined alongside income levels, as women accounted for about one in seven senior managers in the top 1%. Across disciplines, researchers have studied the underrepresentation of women in leadership positions from different angles. Notably, major social psychology and management studies have highlighted the incongruence between gender stereotypes and expected leadership behaviours or gender differences in leadership styles (Eagly and Karau 2002; Eagly and Johannesen-Schmidt 2001; Rincón, González and Barrero 2017).
About one in two young women in the top 1% in health
Gains in educational attainment for young women from 1991 to 2011 have contributed to greater representation in occupations held by university graduates, notably general practitioners and family physicians, lawyers and financial auditors and accountants (Uppal and LaRochelle-Côté 2014). These developments have led to a shift in the demographic landscape of physicians.
Occupational gender gaps outlined above widened for young workers, those between 25 and 34 years of age. Among young workers in the top 1%, almost one in two women worked in health, compared to about one in seven of their male counterparts. Conversely, one in seven young women in the top 1% worked in management, compared to over one in every four young men in the top 1%. Recent work on generational cohorts found that women continue to be less likely than men to reach top income groups by age 30, with little improvement since the early 2000s (Fortin 2016).
Major industries in top 1% reflect occupational differences
Generally, high-income Canadians are more likely to work in finance and insurance, health or professional services (Lemieux and Riddell 2015). Indeed, workers in the top 1% were more likely than those in the bottom 90% to work in these three industries, accounting for almost half of workers in the top 1%. Relative to women in the bottom 90%, women in the top 1% were less likely to work in retail trade, accommodation and food services and educational services. Likewise, men in the top 1% were more likely to work in these three major industries and less likely to work in retail, construction and manufacturing.
Consistent with trends across the income distribution, women in the top 1% were more likely than their male counterparts to work in services, especially health care and social assistance. Similar to occupational patterns, over one in five women in the top 1% was employed in health care and social assistance, compared with one in nine of their male counterparts (see Chart 5 or Table 8). Representation in health care and social assistance was comparable for women across income levels, while men in the top 1% were more likely than men in the bottom 90% to work in health.
Finance and insurance was the second top industry for working women in the top 1%, employing 15.6% of both working women and men in this income group. Meanwhile, 14.7% of women and 17.5% of men in the top 1% worked in professional services.
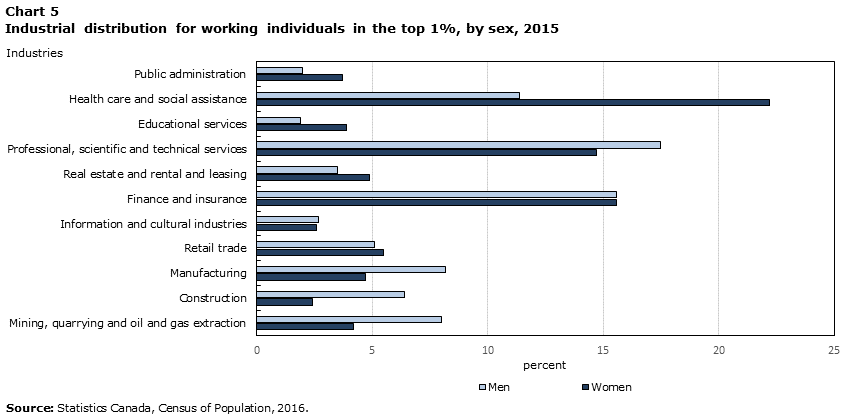
Data table for Chart 5
| Industries | Women | Men |
|---|---|---|
| percent | ||
| Mining, quarrying and oil and gas extraction | 4.2 | 8.0 |
| Construction | 2.4 | 6.4 |
| Manufacturing | 4.7 | 8.2 |
| Retail trade | 5.5 | 5.1 |
| Information and cultural industries | 2.6 | 2.7 |
| Finance and insurance | 15.6 | 15.6 |
| Real estate and rental and leasing | 4.9 | 3.5 |
| Professional, scientific and technical services | 14.7 | 17.5 |
| Educational services | 3.9 | 1.9 |
| Health care and social assistance | 22.2 | 11.4 |
| Public administration | 3.7 | 2.0 |
| Source: Statistics Canada, Census of Population, 2016. | ||
Working women in the top 1% were less likely than their male counterparts to be married or in a common-law relationship
Compared to those in the bottom 90%, workers in the top 1% are generally more likely to be married or in a common-law relationship or to have children. However, notable disparities between working women and men in the top 1% were observed. Specifically, 77.3% of women were married or in a common-law relationship, compared with 88.4% of their male counterparts (see Chart 6 or Table 5). By contrast, the share of working women and men in the bottom 90% who were married or in a common-law relationship was similar, at about 60%.
Consistent with patterns observed across the income distribution, working women in the top 1% were about three times more likely than their male counterparts to be lone parents. However, patterns were reversed for those living alone or with non-family members. While working men in the bottom 90% were more likely than their female counterparts to be living alone or with non-family members, the opposite held for the top 1%. Specifically, 13.9% of working women in the top 1% were either living alone or with non-family members, compared with 8.6% of their male counterparts. The analysis outlined above for family status was consistent for core-aged workers (those between 25 and 54 years of age), and was relatively unchanged over the last decade.

Data table for Chart 6
| Family status | Women | Men |
|---|---|---|
| percent | ||
| Married spouse or common-law partner | 77.3 | 88.4 |
| Lone parent | 8.0 | 2.6 |
| Person not in a census family | 13.9 | 8.6 |
| Source: Statistics Canada, Census of Population, 2016. | ||
Results for marital status were comparable to family status, as working women in the top 1% were less likely than their male counterparts to be married and not separated. Specifically, 68.3% of working women in the top 1% were married or common-law and not separated, compared with 80.2% of their male counterparts. Further, working women in the top 1% were one and a half times more likely than their male counterparts to be divorced.
Working women in the top 1% had fewer children than their male counterparts
Working women in the top 1% were somewhat less likely than their male counterparts to have children and when they did, they had fewer children.Note 7 By contrast, working women in the bottom 90% were more likely to have children than their male counterparts. Among workers in the top 1%, 41.6% of women did not have children, compared with 37.6% of men (Chart 7 or Table 5). Among core-aged workers, those between 25 and 54 years of age, the gap widened slightly, as 27.6% of women and 21.4% of men did not have children. These gaps varied across occupations for core-aged workers in the top 1%, slightly narrower for health professionals, yet wider gaps for management, business, finance and administration and natural and applied sciences were observed.
When working women in the top 1% did have children, they had fewer children than their male counterparts. Working women in the top 1% were slightly more likely to only have one child, accounting for 19.6%, compared with 17.3% of their male counterparts. Conversely, 45.2% of working men in the top 1% had two or more children, compared with 38.8% of their female counterparts. Further, 15.4% of men had three or more children, compared with 10.5% of women. These gaps widened for core-aged workers, as 52.3% of women had two or more children, compared to 62.9% of men. Over the last decade, these differences have been relatively stable. While the proportion of women who had children edged up from 2005, the share of men with children edged down, effectively slightly narrowing the gap between women and men.
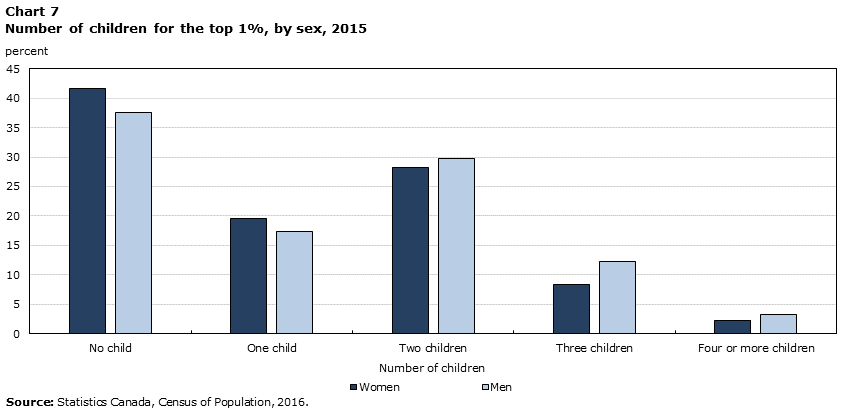
Data table for Chart 7
| Number of children | Women | Men |
|---|---|---|
| percent | ||
| No child | 41.6 | 37.6 |
| One child | 19.6 | 17.3 |
| Two children | 28.3 | 29.8 |
| Three children | 8.3 | 12.2 |
| Four or more children | 2.2 | 3.2 |
| Source: Statistics Canada, Census of Population, 2016. | ||
Almost one third of working women in the top 1% lived in Toronto
Workers in the top 1% are more likely to live in census metropolitan areas (CMAs) than those in the bottom 90%, with slight differences between women and men. Essentially, working women in the top 1% were more likely than their male counterparts to live in CMAs with major financial sectors, such as Toronto and Montréal. Conversely, working men in the top 1% were slightly more likely than their female counterparts to live in resource-based CMAs, such as Calgary and Edmonton.
Almost one in three working women in the top 1% lived in Toronto, accounting for 31.5% of women and 26.9% of their male counterparts (Chart 8 or Table 6). By contrast, about one in six workers in the bottom 90% lived in Toronto. Meanwhile, working women in the top 1% were slightly less likely than their male counterparts to live in Calgary or Edmonton, accounting for 17.0% of women living in both CMAs, compared with 19.0% of their male counterparts. Representation in Vancouver and Ottawa–Gatineau was comparable for both women and men in the top 1%.

Data table for Chart 8
| Selected census metropolitan areas | Women | Men |
|---|---|---|
| percent | ||
| Montréal | 11.6 | 10.9 |
| Ottawa–Gatineau | 3.3 | 3.3 |
| Toronto | 31.5 | 26.9 |
| Calgary | 11.7 | 12.9 |
| Edmonton | 5.3 | 6.1 |
| Vancouver | 7.9 | 7.9 |
| Source: Statistics Canada, Census of Population, 2016. | ||
One in seven women in the top 1% belonged to a visible minority group
Relative to the share of the total working population or the bottom 90%, visible minorities were underrepresented among the top 1%.Note 8 About 1 in every 7 working women in the top 1% belonged to a visible minority group, compared with 1 in 5 in the working population (Chart 9 or Table 4). Likewise, 1 in every 9 men in the top 1% belonged to a visible minority group. In total, about 4,800 women and 15,000 men who belonged to a visible minority group were included in the top 1%.
By contrast, 22.2% of working women in the top 1% were immigrants, individuals who have at one point been landed immigrants or permanent residents, comparable with representation in the bottom 90% (23.6%). Over half of working women and men who were immigrants and included in the top 1% reported that they did not belong to a visible minority group.
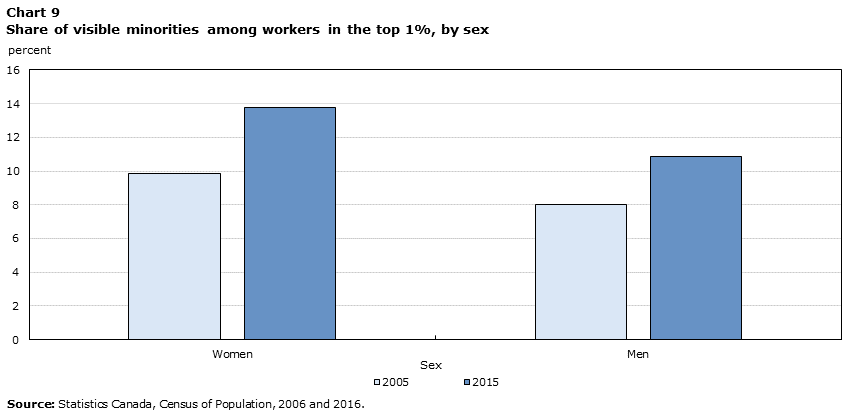
Data table for Chart 9
| Sex | 2015 | 2005 |
|---|---|---|
| percent | ||
| Women | 13.8 | 9.8 |
| Men | 10.9 | 8.0 |
| Source: Statistics Canada, Census of Population, 2006 and 2016. | ||
Similar to the working population, the most commonly reported visible minority groups for workers in the top 1% were South Asian and Chinese. By contrast, the representation of Black or Filipino visible minority groups declined alongside income. There were some differences between women and men. While working women in the top 1% were equally likely as their male counterparts to be South Asian, they were more likely to be Chinese.
Over the last decade, representation of visible minorities among the top 1% has edged up, to a slightly greater extent for women than for men. Representation of visible minority women in the top 1% increased from 9.9% in 2005 to 13.8% in 2015, and rose from 8.0% to 10.9% for men during the same period.
Previous work has shown that visible minority women in Canada are younger, more likely to have a higher level of education than the rest of the population (Hudon 2016) and those in couples were more likely to have children. These patterns extended to the top 1%. Visible minority women in the top 1% were relatively younger, as almost 40% were between 25 and 44 years old, compared with 25% of women who did not belong to a visible minority group. Patterns outlined for family status were similar for core-aged women in the top 1%, yet, differences were observed in the number of children, as visible minority women in the top 1% were slightly more likely than women who did not belong to a visible minority group to have children.
Visible minority women were more likely to be working in health, accounting for almost one in three visible minority women in the top 1%. Conversely, they were less likely to be working in management and social science occupations. Again, senior management representation among the top 1% partly explains these patterns, as 9.3% of women who belonged to a visible minority group were senior managers, compared to 13.8% of women who were not visible minorities.
About 1 in 100 women in the top 1% were Indigenous
Indigenous people were also underrepresented among workers in the top 1%, relative to their share of the working population or the bottom 90%Note 9. Representing about 4% of workers in the bottom 90%, Indigenous people accounted for slightly over 1% of the top 1%, about 400 women and slightly over 1,500 men. Since 2005, the representation of Indigenous people in the top 1% more than doubled, again, increasing to a slightly greater extent for women than for men. Given the small population, the analysis for Indigenous workers in the top 1% is limited in this study. Generally, gender differences outlined above for family status and occupation were consistent for Indigenous women.
4 Income differences
Women in the top 1% had lower incomes than their male counterparts
Notwithstanding women’s higher educational attainment among workers in the top 1%, women had lower average and median incomes. Specifically, the median income for working women in the top 1% was about $362,300, compared to $393,200 for working men in the same income bracket. Given that the right-hand tail of the income distribution extends further for men than for women, gaps in average income were wider, as average income for women reached $493,000, compared to $638,100 for men.
Over the last decade, income growth for women has slightly outpaced that for men, except for the top 0.1%. From 2005 to 2015, median and average incomes for working women in the bottom 90%, the next 9% and the next 0.9% increased at a faster pace than for their male counterparts. The opposite held for the top 0.1%.
Gender gaps in income wider for senior managers
Previous research stresses that the gender pay gap is more important in occupations with high returns to overwork, notably business and technology, as opposed to health, where the relationship between hours worked and pay is more linear and the penalties for labour market interruptions are less severe (Goldin 2014). Meanwhile, women executives were more likely to be in lower level positions, in smaller firms, and encountered larger pay differences with male executives in firms with male-dominated boards (Elkinawy and Slater 2011).Note 10
Indeed, gender gaps in median and average incomes were wider for workers in the top 1% employed in management and business, finance and administration occupations, occupations associated with high returns to overwork (Chart 10). Conversely, gender gaps were narrower for health professions, where salaries are generally capped by government policies. Women in the top 1% who were employed as senior managers had an average income of about $614,300 in 2015, compared with $843,400 for men in the same income bracket. Even in business, finance and administration occupations, where women were well represented, gender gaps were notable, as average incomes were about $526,400 for women and $689,500 for men.Note 11 Gender gaps in average income narrowed when controlling for age and hours worked, particularly for professional occupations in natural and applied sciences, while they were little changed for health, senior management and finance and insurance.
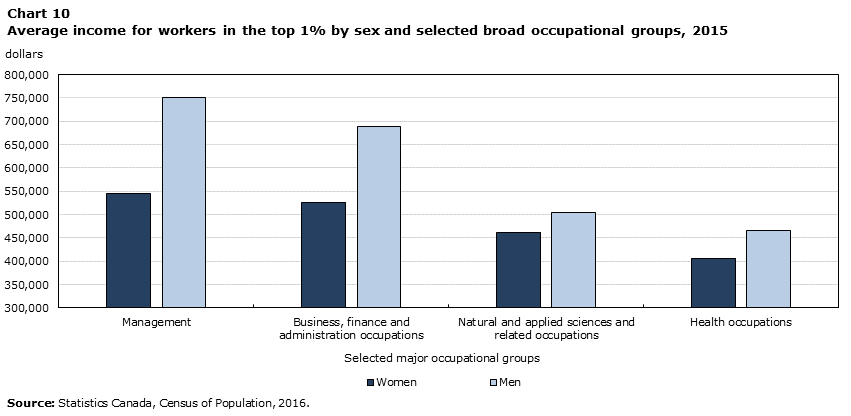
Data table for Chart 10
| Selected broad occupational groups | Women | Men |
|---|---|---|
| dollars | ||
| Management | 544,400 | 750,900 |
| Business, finance and administration occupations | 526,400 | 689,500 |
| Natural and applied sciences and related occupations | 461,000 | 504,200 |
| Health occupations | 405,700 | 465,000 |
| Source: Statistics Canada, Census of Population, 2016. | ||
Differences in income for the top 1% reflected the higher representation of men at the very top of the income distribution, such as the top 0.1%. Patterns observed for the top 1% were more pronounced for the top 0.1%. Senior management occupations had relatively wider gender gaps, as men reached an average income of $2.7 million, compared to $2.1 million for women, similar to natural and applied sciences and related occupations and business, finance and administration. By contrast, average incomes for women and men working as health professionals in the top 0.1% were similar.
5 Hours of paid and unpaid work
Differences in hours worked emerged between men and women in the top 1% who have children
Over the last few decades, there has been a major convergence in the labour force participation and educational attainment of women and men, while the last chapter concerns work flexibility (Goldin, 2014). Indeed, women in the top 1% were less likely than their male counterparts to work long hours, which is similar to patterns observed in 2005. Among workers in the top 1%, 33.8% of women spent over 50 hours on paid work in the week prior to Census day, compared with 41.6% of men (Table 9). The gap in hours worked widened slightly for core-aged workers (those between 25 and 54 years of age) in the top 1%, reaching 35.7% of women and 46.3% of men.
Differences in hours worked varied alongside family status and the presence of children. Among workers in the top 1% who were living alone or with non-family members, average hours worked were similar, reaching about 46 hours (Chart 11 and Table 10). However, among the top 1% who were married or in a common-law relationship, women worked an average of 42 hours, about 5 hours less than their male counterparts. Consistent with these patterns, average hours worked were similar for the top 1% without children, while differences emerged for those with children. Specifically, working women in the top 1% who had one or two children worked an average of 42 hours, about 5 hours less than men in the same income bracket. Even more, women in the top 1% with four or five children worked about 38 hours, about 10 hours less than their male counterparts.
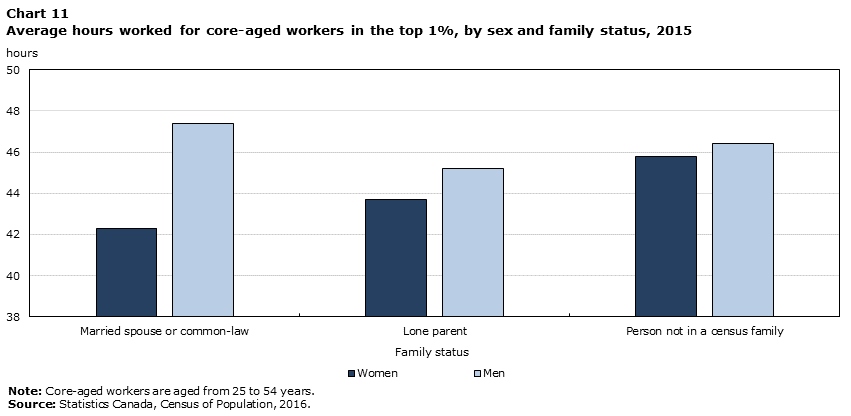
Data table for Chart 11
| Family status | Women | Men |
|---|---|---|
| hours | ||
| Married spouse or common-law | 42.3 | 47.4 |
| Lone parent | 43.7 | 45.2 |
| Person not in a census family | 45.8 | 46.4 |
|
Note: Core-aged workers are aged from 25 to 54 years. Source: Statistics Canada, Census of Population, 2016. |
||
Differences in hours worked for the top 1% who were married or in a common-law relationship or had children also suggests differences in the division of unpaid work within households. Recent analysis using the General Social Survey shows that while fathers now spend more time on child care and house-work than in the mid-1980s, mothers continue to contribute more unpaid hours (Houle, Turcotte and Wendt 2017).Note 12Note 13
Based on the latest available data from the 2006 Census of Population, women were one and a half times to two times more likely than men to spend 15 hours or more on child care in the week prior to Census day. Among workers in the top 1%, they were twice as likely, as 30.5% of women spent 15 hours or more on house-work, compared to 14.2% of men (Chart 12 or Table 11). Conversely, working men in the top 1% were more likely to spend five hours or less on housework, accounting for 45.3% of men and 26.0% of their female counterparts.
These differences were more prominent for child care among workers in the top 1% with children. Specifically, 43.7% of women spent 15 hours or more looking after children, compared with 25.4% of their male counterparts. Conversely, 47.0% of men and 32.6% of women spent five hours or less taking care of children.

Data table for Chart 12
| Type of unpaid work | Men | Women |
|---|---|---|
| percent | ||
| Housework | 14.2 | 30.5 |
| Child care (for those with children) | 25.4 | 43.7 |
| Source: Statistics Canada, Census of Population, 2006. | ||
6 Conclusion
Previous research shows that the underrepresentation of women in top income groups accounts for an increasingly larger share of the gender pay gap (Fortin, Bell and Böhm 2017; Fortin, Bonikowska and Drolet forthcoming). Over the last half century, women have made great strides in educational attainment and labour force participation, yet continue to be less represented in top income groups. In 2015, women accounted for one in five workers in Canada’s top 1% and one in eight workers in the top 0.1%. Leveraging the Census of Population, this study informed the literature by providing a gender-based analysis of key socio-economic characteristics, income levels and hours of paid and unpaid work for workers in the top 1%.
Compared to the general population, high-income Canadians have a higher level of education, are more likely to be senior managers, business owners or physicians (Lemieux and Riddell 2015; Statistics Canada 2013). These findings extended to both women and men in the top 1%, while notable gender differences were outlined. While women obtained a higher level of educational attainment than their male counterparts and were more likely to have a degree in medicine or related fields, they were less likely to be working in STEM fields. Notable disparities were observed in family status, as working women in the top 1% were less likely than their male counterparts to be married or in a common-law relationship. They were also somewhat less likely to have children and when they did, they had fewer. Occupational gender differences were observed among workers in the top 1%, as one in five women worked in health, while more than one in three men worked in management. These patterns were more prominent for young workers and have persisted over the last decade. While representation of immigrants among the top 1% was comparable across the income distribution, women and men who were visible minorities and Indigenous people were substantially underrepresented among the top 1%.
While working women in the top 1% were more educated than their male counterparts, their incomes were lower. Gender gaps in income were wider for occupations where women were less represented, such as management, while narrower in health, where women were overrepresented.
Hours worked were similar for women and men in the top 1% who were not part of a census family or did not have children, while differences emerged for those who were married or in a common-law relationship or those with children, with women working fewer hours.
This study can be leveraged by the general public and policymakers to better understand the lower representation of women at the top of the income distribution. Given the advancements women have made over the last two decades in health-related fields, for example as physicians, future work could further explore lifecycle differences for business, management and STEM or to inform on gender pay gaps for executives.
7 Tables
| 2015 | 2005 | |
|---|---|---|
| current dollars | ||
| Top 0.1% | 955,400 | 735,600 |
| Top 1% | 270,900 | 202,700 |
| Top 5% | 135,900 | 100,000 |
| Top 10% | 105,000 | 78,900 |
| Source: Statistics Canada, Census of Population, 2006 and 2016. | ||
| 2015 | 2005 | |||
|---|---|---|---|---|
| Women | Men | Women | Men | |
| number | ||||
| Top 0.1% | 2,231 | 15,004 | 1,667 | 14,356 |
| Top 1% | 34,982 | 137,321 | 25,598 | 134,626 |
| Top 5% | 208,117 | 653,391 | 164,148 | 636,914 |
| Top 10% | 469,222 | 1,253,828 | 385,861 | 1,216,296 |
| Source: Statistics Canada, Census of Population, 2006 and 2016. | ||||
| 2015 | 2005 | |||||
|---|---|---|---|---|---|---|
| Total | Women | Men | Total | Women | Men | |
| current dollars | ||||||
| Average income | ||||||
| Top 0.1% | 2,286,900 | 1,787,200 | 2,361,200 | 1,647,400 | 1,400,000 | 1,676,100 |
| Top 1% | 608,700 | 493,000 | 638,100 | 453,700 | 375,900 | 468,500 |
| Top 5% | 262,900 | 228,200 | 274,000 | 194,300 | 166,900 | 201,300 |
| Top 10% | 190,400 | 166,600 | 199,300 | 141,000 | 121,000 | 147,300 |
| Median income | ||||||
| Top 0.1% | 1,462,800 | 1,338,200 | 1,489,500 | 1,128,800 | 1,054,100 | 1,140,000 |
| Top 1% | 385,500 | 362,300 | 393,200 | 293,300 | 271,400 | 298,600 |
| Top 5% | 179,600 | 174,300 | 181,400 | 130,700 | 126,700 | 132,000 |
| Top 10% | 135,900 | 130,400 | 138,200 | 100,000 | 95,500 | 101,800 |
| Source: Statistics Canada, Census of Population, 2006 and 2016. | ||||||
| Women | Men | |||||||
|---|---|---|---|---|---|---|---|---|
| Bottom 90% | Next 5% | Next 4% | Top 1% | Bottom 90% | Next 5% | Next 4% | Top 1% | |
| percent | ||||||||
| Age | ||||||||
| 25 to 34 | 21.7 | 10.1 | 7.4 | 4.1 | 22.5 | 13.7 | 9.6 | 3.6 |
| 35 to 44 | 21.4 | 28.3 | 26.6 | 22.9 | 20.4 | 27.7 | 25.4 | 19.7 |
| 45 to 54 | 23.1 | 35.8 | 37.1 | 39.2 | 21.2 | 32.3 | 33.4 | 36.1 |
| 55 to 64 | 16.4 | 21.6 | 23.6 | 25.8 | 16.5 | 21.0 | 24.5 | 29.4 |
| 65 or older | 3.5 | 4.0 | 5.1 | 7.9 | 5.1 | 4.7 | 6.7 | 11.2 |
| Visible minority | ||||||||
| Visible minority | 21.7 | 17.1 | 15.6 | 13.8 | 22.5 | 14.4 | 13.1 | 10.9 |
| Not a visible minority | 78.3 | 82.9 | 84.4 | 86.2 | 77.5 | 85.6 | 86.9 | 89.1 |
| Immigrant status | ||||||||
| Non-immigrants | 75.1 | 77.1 | 76.9 | 76.9 | 73.6 | 78.7 | 78.7 | 78.3 |
| Immigrants | 23.6 | 22.5 | 22.6 | 22.2 | 24.7 | 20.8 | 20.6 | 20.2 |
| Non-permanent residents | 1.3 | 0.3 | 0.5 | 0.9 | 1.6 | 0.5 | 0.6 | 1.5 |
| Aboriginal identity | ||||||||
| Aboriginal identity | 4.0 | 2.9 | 2.0 | 1.3 | 3.6 | 3.0 | 2.4 | 1.1 |
| Non-aboriginal identity | 96.0 | 97.1 | 98.0 | 98.7 | 96.4 | 97.0 | 97.6 | 98.9 |
|
Note: The Employment Equity Act (S.C. 1995, c. 44, s. 3) defines visible minorities as "persons, other than Aboriginal peoples, who are non-Caucasian in race or non-white in colour." Source: Statistics Canada, Census of Population, 2016. |
||||||||
| Women | Men | |||||||
|---|---|---|---|---|---|---|---|---|
| Bottom 90% | Next 5% | Next 4% | Top 1% | Bottom 90% | Next 5% | Next 4% | Top 1% | |
| percent | ||||||||
| Marital status | ||||||||
| Never married (including common law) | 40.3 | 21.5 | 18.8 | 14.4 | 44.6 | 19.7 | 14.4 | 8.3 |
| Married | 44.5 | 60.0 | 63.1 | 68.3 | 45.1 | 69.0 | 74.4 | 80.2 |
| Separated (including living common law) | 3.6 | 3.5 | 3.3 | 3.1 | 2.7 | 2.9 | 2.7 | 2.9 |
| Divorced (including living common law) | 9.6 | 12.5 | 12.4 | 11.2 | 6.9 | 7.7 | 7.6 | 7.5 |
| Widowed (including living common law) | 2.0 | 2.5 | 2.5 | 3.1 | 0.8 | 0.7 | 0.8 | 1.1 |
| Family status | ||||||||
| Married spouse or common-law partner | 59.5 | 71.9 | 74.0 | 77.3 | 59.9 | 82.7 | 85.4 | 88.4 |
| Lone parent | 9.1 | 9.5 | 8.7 | 8.0 | 2.5 | 3.0 | 2.7 | 2.6 |
| Child | 14.1 | 1.9 | 1.5 | 0.8 | 17.1 | 1.6 | 0.9 | 0.4 |
| Person not in a census family | 17.3 | 16.7 | 15.8 | 13.9 | 20.4 | 12.7 | 11.0 | 8.6 |
| Number of children | ||||||||
| No child | 55.3 | 43.8 | 43.0 | 41.6 | 61.2 | 40.4 | 38.8 | 37.6 |
| One child | 18.5 | 19.9 | 19.8 | 19.6 | 15.2 | 19.8 | 19.1 | 17.3 |
| Two children | 19.1 | 27.4 | 27.8 | 28.3 | 16.6 | 28.8 | 30.0 | 29.8 |
| Three children | 5.6 | 7.2 | 7.6 | 8.3 | 5.2 | 8.8 | 9.6 | 12.2 |
| Four or more children | 1.5 | 1.7 | 1.8 | 2.2 | 1.8 | 2.3 | 2.4 | 3.2 |
| Source: Statistics Canada, Census of Population, 2016. | ||||||||
| Women | Men | |||||||
|---|---|---|---|---|---|---|---|---|
| Bottom 90% | Next 5% | Next 4% | Top 1% | Bottom 90% | Next 5% | Next 4% | Top 1% | |
| percent | ||||||||
| Provinces and territories | ||||||||
| Newfoundland and Labrador | 1.3 | 1.1 | 0.9 | 1.1 | 1.1 | 1.7 | 1.9 | 1.1 |
| Prince Edward Island | 0.4 | 0.2 | 0.2 | 0.2 | 0.4 | 0.2 | 0.2 | 0.1 |
| Nova Scotia | 2.6 | 1.6 | 1.5 | 0.9 | 2.5 | 1.9 | 1.7 | 1.2 |
| New Brunswick | 2.1 | 0.9 | 0.8 | 0.6 | 2.0 | 1.4 | 1.2 | 0.7 |
| Quebec | 23.4 | 16.0 | 16.4 | 16.6 | 24.1 | 16.2 | 14.0 | 15.5 |
| Ontario | 38.2 | 43.3 | 44.0 | 44.6 | 38.2 | 38.8 | 37.4 | 41.5 |
| Manitoba | 3.6 | 2.7 | 2.1 | 2.1 | 3.8 | 2.8 | 2.3 | 2.1 |
| Saskatchewan | 3.1 | 3.5 | 2.7 | 2.0 | 3.1 | 4.0 | 3.8 | 2.2 |
| Alberta | 11.4 | 17.9 | 18.8 | 20.8 | 11.0 | 18.5 | 23.8 | 24.4 |
| British Columbia | 13.5 | 11.6 | 11.5 | 10.9 | 13.4 | 13.8 | 13.0 | 10.9 |
| Territories | 0.3 | 1.3 | 1.0 | 0.3 | 0.3 | 0.6 | 0.6 | 0.2 |
| Selected CMAs | ||||||||
| Montréal | 11.9 | 10.1 | 10.7 | 11.6 | 12.1 | 9.0 | 8.7 | 10.9 |
| Ottawa–Gatineau | 3.9 | 6.7 | 5.5 | 3.3 | 3.7 | 5.1 | 4.4 | 3.3 |
| Toronto | 16.9 | 22.2 | 25.9 | 31.5 | 17.1 | 16.7 | 18.3 | 26.9 |
| Calgary | 3.9 | 7.4 | 9.5 | 11.7 | 3.9 | 5.8 | 8.2 | 12.9 |
| Edmonton | 3.8 | 5.9 | 5.0 | 5.3 | 3.7 | 6.6 | 7.3 | 6.1 |
| Vancouver | 7.4 | 7.5 | 7.9 | 7.9 | 7.4 | 7.3 | 7.7 | 7.9 |
|
Note: For confidentiality reasons, representation for the territories was grouped. Source: Statistics Canada, Census of Population, 2016. |
||||||||
| Women | Men | |||||||
|---|---|---|---|---|---|---|---|---|
| Bottom 90% | Next 5% | Next 4% | Top 1% | Bottom 90% | Next 5% | Next 4% | Top 1% | |
| percent | ||||||||
| Educational attainment | ||||||||
| No certificate, diploma or degree | 8.6 | 1.2 | 1.1 | 1.5 | 13.3 | 3.9 | 3.1 | 2.5 |
| Secondary (high) school diploma or equivalency certificate | 25.1 | 9.4 | 9.4 | 9.6 | 28.5 | 15.0 | 12.6 | 9.9 |
| Apprenticeship or other certificate or diploma | 7.0 | 1.7 | 1.5 | 1.1 | 14.5 | 14.4 | 11.7 | 4.7 |
| College, CEGEP or other non-university certificate or diploma | 26.6 | 18.4 | 14.8 | 10.7 | 19.2 | 22.2 | 18.4 | 10.7 |
| University certificate or diploma below bachelor level | 3.5 | 4.2 | 3.4 | 2.8 | 2.5 | 3.0 | 2.8 | 2.2 |
| Bachelor's degree | 20.9 | 36.1 | 33.4 | 32.9 | 15.1 | 24.7 | 27.5 | 35.3 |
| University certificate or diploma above bachelor's level | 2.0 | 4.5 | 4.6 | 4.6 | 1.4 | 2.4 | 3.0 | 4.9 |
| Degree in medicine, dentistry, veterinary medicine or optometry | 0.5 | 2.7 | 8.3 | 14.7 | 0.5 | 1.4 | 4.2 | 8.8 |
| Master's degree | 5.3 | 17.8 | 17.8 | 18.5 | 4.4 | 10.1 | 12.3 | 17.5 |
| Earned doctorate degree | 0.6 | 4.3 | 5.8 | 3.5 | 0.8 | 2.9 | 4.4 | 3.5 |
| Field of study for those with a bachelor's degree or more | ||||||||
| Education | 16.5 | 11.5 | 5.4 | 3.4 | 6.7 | 4.8 | 1.9 | 0.8 |
| Visual and performing arts, and communications technologies | 4.0 | 1.5 | 1.2 | 1.0 | 3.4 | 1.1 | 0.7 | 0.4 |
| Humanities | 9.8 | 5.9 | 5.4 | 5.3 | 8.3 | 4.5 | 3.4 | 2.8 |
| Social and behavioural sciences and law | 20.1 | 18.1 | 20.8 | 22.2 | 15.5 | 14.0 | 15.0 | 18.0 |
| Business, management and public administration | 18.8 | 22.9 | 27.2 | 28.5 | 22.4 | 23.5 | 27.8 | 35.8 |
| Physical and life sciences and technologies | 6.4 | 6.1 | 6.6 | 5.7 | 7.6 | 7.5 | 7.4 | 5.8 |
| Mathematics, computer and information sciences | 2.9 | 4.1 | 3.5 | 2.2 | 7.5 | 9.0 | 6.2 | 3.2 |
| Architecture, engineering, and related technologies | 4.1 | 6.4 | 6.0 | 4.0 | 18.3 | 24.0 | 23.2 | 16.1 |
| Agriculture, natural resources and conservation | 1.6 | 1.3 | 1.1 | 0.6 | 2.4 | 2.1 | 1.6 | 0.8 |
| Health and related fields | 15.5 | 22.1 | 22.8 | 27.2 | 7.5 | 8.9 | 12.3 | 16.2 |
|
Note: For confidentiality reasons, personal, protective and transportation services, as well as other were not included as fields of study for those with a bachelor's degree or more. Source: Statistics Canada, Census of Population, 2016. |
||||||||
| Women | Men | |||||||
|---|---|---|---|---|---|---|---|---|
| Bottom 90% | Next 5% | Next 4% | Top 1% | Bottom 90% | Next 5% | Next 4% | Top 1% | |
| percent | ||||||||
| Occupation group | ||||||||
| Management occupations | 7.7 | 27.6 | 30.6 | 31.0 | 11.1 | 24.0 | 31.8 | 41.5 |
| Senior managers - Financial, communications and other business services | 0.1 | 0.7 | 2.2 | 6.0 | 0.3 | 0.8 | 2.3 | 7.0 |
| Senior managers - Trade, broadcasting and other services | 0.1 | 0.4 | 1.0 | 2.7 | 0.3 | 0.6 | 1.5 | 4.2 |
| Senior managers - Goods production, utilities, transportation and construction | 0.1 | 0.3 | 0.9 | 2.6 | 0.3 | 0.9 | 2.3 | 6.9 |
| Business, finance and administration occupations | 23.3 | 19.5 | 20.7 | 22.6 | 9.2 | 8.2 | 9.6 | 15.3 |
| Financial auditors and accountants | 1.2 | 3.1 | 4.0 | 3.9 | 0.8 | 1.5 | 2.1 | 3.0 |
| Financial and investment analysts | 0.3 | 0.7 | 0.6 | 1.6 | 0.2 | 0.4 | 0.6 | 2.6 |
| Other financial officers | 0.6 | 1.2 | 1.7 | 3.2 | 0.6 | 0.9 | 1.6 | 3.7 |
| Natural and applied sciences and related occupations | 3.0 | 8.3 | 6.5 | 3.4 | 9.5 | 18.8 | 16.7 | 9.9 |
| Health occupations | 11.5 | 16.7 | 15.8 | 20.3 | 2.2 | 3.7 | 6.0 | 11.4 |
| Specialist physicians | 0.1 | 0.6 | 3.2 | 10.0 | 0.1 | 0.4 | 1.8 | 5.8 |
| General practioners and family physicians | 0.2 | 1.2 | 4.7 | 6.1 | 0.2 | 0.6 | 1.9 | 3.3 |
| Dentists | 0.1 | 0.5 | 1.3 | 1.5 | 0.1 | 0.3 | 0.8 | 1.5 |
| Occupations in education, law and social, community and government services | 17.0 | 18.1 | 15.9 | 13.5 | 6.7 | 12.2 | 9.4 | 9.2 |
| Lawyers and Quebec notaries | 0.3 | 2.3 | 5.4 | 6.8 | 0.3 | 1.1 | 2.7 | 5.6 |
| Occupations in art, culture, recreation and sport | 3.5 | 1.8 | 1.7 | 1.5 | 2.9 | 1.2 | 1.0 | 0.8 |
| Sales and service occupations | 28.5 | 6.1 | 6.9 | 6.8 | 21.3 | 6.4 | 6.7 | 6.1 |
| Trades, transport and equipment operators and related occupations | 1.9 | 1.0 | 0.9 | 0.4 | 27.4 | 18.8 | 11.9 | 3.2 |
| Natural resources, agriculture and related production occupations | 0.9 | 0.3 | 0.3 | 0.2 | 3.2 | 2.6 | 2.8 | 1.2 |
| Occupations in manufacturing and utilities | 2.8 | 0.6 | 0.7 | 0.2 | 6.3 | 4.1 | 4.1 | 1.3 |
| Industry | ||||||||
| Agriculture, forestry, fishing and hunting | 1.6 | 0.6 | 0.7 | 1.0 | 3.4 | 1.5 | 1.4 | 1.3 |
| Mining, quarrying and oil and gas extraction | 0.4 | 2.2 | 4.6 | 4.2 | 1.1 | 6.2 | 10.2 | 8.0 |
| Utilities | 0.3 | 2.0 | 1.7 | 0.8 | 0.7 | 3.9 | 3.7 | 1.1 |
| Construction | 1.8 | 1.9 | 2.2 | 2.4 | 12.4 | 10.4 | 8.5 | 6.4 |
| Manufacturing | 5.1 | 4.6 | 5.0 | 4.7 | 12.4 | 12.3 | 10.3 | 8.2 |
| Wholesale trade | 2.4 | 3.6 | 5.1 | 5.1 | 4.6 | 5.4 | 6.9 | 6.8 |
| Retail trade | 13.2 | 5.2 | 5.4 | 5.5 | 11.3 | 4.9 | 5.0 | 5.1 |
| Transportation and warehousing | 2.6 | 1.9 | 2.1 | 1.9 | 7.4 | 4.9 | 4.5 | 3.0 |
| Information and cultural industries | 2.0 | 3.1 | 2.8 | 2.6 | 2.5 | 3.5 | 3.0 | 2.7 |
| Finance and insurance | 5.1 | 9.8 | 11.1 | 15.6 | 2.9 | 5.8 | 7.6 | 15.6 |
| Real estate and rental and leasing | 1.7 | 2.1 | 3.2 | 4.9 | 2.0 | 1.7 | 2.3 | 3.5 |
| Professional, scientific and technical services | 6.5 | 10.5 | 13.9 | 14.7 | 6.9 | 11.5 | 15.0 | 17.5 |
| Management of companies and enterprises | 0.2 | 0.5 | 0.8 | 1.2 | 0.1 | 0.3 | 0.5 | 1.3 |
| Administrative and support, waste management and remediation services | 3.9 | 1.4 | 1.8 | 1.7 | 5.2 | 1.7 | 1.6 | 1.6 |
| Educational services | 10.8 | 13.1 | 8.4 | 3.9 | 4.5 | 5.0 | 4.1 | 1.9 |
| Health care and social assistance | 20.5 | 20.1 | 18.9 | 22.2 | 3.9 | 4.1 | 6.2 | 11.4 |
| Arts, entertainment and recreation | 2.1 | 0.7 | 0.8 | 1.0 | 2.2 | 0.6 | 0.6 | 0.7 |
| Accommodation and food services | 8.7 | 1.0 | 1.0 | 1.4 | 6.3 | 0.8 | 0.8 | 0.9 |
| Other services (except public administration) | 5.2 | 2.5 | 2.3 | 1.5 | 4.2 | 2.3 | 1.8 | 1.1 |
| Public administration | 6.0 | 13.1 | 8.1 | 3.7 | 5.9 | 13.4 | 6.0 | 2.0 |
|
Note: Broad occupational groups are presented in this table, along with specific occupational groups important to high-income Canadians to provide more detail on differences between working women and men in the top 1%. Source: Statistics Canada, Census of Population, 2016. |
||||||||
| Women | Men | |||||||
|---|---|---|---|---|---|---|---|---|
| Bottom 90% | Next 5% | Next 4% | Top 1% | Bottom 90% | Next 5% | Next 4% | Top 1% | |
| percent | ||||||||
| Distribution of hours worked | ||||||||
| Less than 20 | 18.9 | 8.1 | 8.8 | 10.1 | 11.7 | 4.9 | 5.2 | 5.4 |
| From 20 to 39 | 40.5 | 27.8 | 22.0 | 15.9 | 23.2 | 17.0 | 13.1 | 10.5 |
| From 40 to 49 | 34.7 | 48.5 | 46.4 | 40.2 | 50.8 | 54.6 | 50.8 | 42.5 |
| 50 and over | 6.0 | 15.6 | 22.8 | 33.8 | 14.4 | 23.6 | 31.0 | 41.6 |
| Distribution of hours worked for core-aged workers | ||||||||
| Less than 20 | 14.1 | 6.8 | 7.5 | 7.6 | 6.9 | 3.6 | 3.6 | 3.1 |
| From 20 to 39 | 40.2 | 25.8 | 19.9 | 14.0 | 21.1 | 15.0 | 10.5 | 6.8 |
| From 40 to 49 | 39.0 | 51.1 | 48.9 | 42.7 | 56.2 | 56.6 | 52.7 | 43.8 |
| 50 and over | 6.6 | 16.2 | 23.7 | 35.7 | 15.8 | 24.9 | 33.3 | 46.3 |
|
Note: Core-aged workers are aged from 25 to 54 years. Source: Statistics Canada, Census of Population, 2016. |
||||||||
| Women | Men | |||||||
|---|---|---|---|---|---|---|---|---|
| Bottom 90% | Next 5% | Next 4% | Top 1% | Bottom 90% | Next 5% | Next 4% | Top 1% | |
| hours | ||||||||
| Family status | ||||||||
| Married spouse or common-law | 32.9 | 38.8 | 39.8 | 42.3 | 40.6 | 43.4 | 45.1 | 47.4 |
| Lone parent | 34.1 | 40.2 | 40.8 | 43.7 | 39.7 | 42.8 | 44.6 | 45.2 |
| Child | 33.4 | 40.4 | 40.9 | 46.1 | 36.1 | 42.1 | 44.1 | 44.4 |
| Person not in a census family | 35.7 | 41.5 | 43.0 | 45.8 | 39.0 | 43.7 | 45.6 | 46.4 |
| Number of children | ||||||||
| No child | 35.2 | 41.1 | 42.5 | 45.5 | 38.8 | 43.7 | 45.3 | 46.7 |
| One child | 32.4 | 38.5 | 39.6 | 41.6 | 40.1 | 43.1 | 44.8 | 46.8 |
| Two children | 32.7 | 38.6 | 39.7 | 42.6 | 40.8 | 43.1 | 44.9 | 47.1 |
| Three or more children | 31.6 | 37.6 | 37.4 | 40.3 | 41.6 | 44.1 | 45.7 | 48.4 |
|
Note: Core-aged workers are aged from 25 to 54 years. Source: Statistics Canada, Census of Population, 2016. |
||||||||
References
Atkinson, A.B., A. Casarico, and S. Voitchovsky. 2016. Top Incomes and the Gender Divide. Melbourne Institute Working Paper Series. Melbourne Institute Working Paper No. 27. Victoria: Melbourne Institute of Applied Economic and Social Research.
Canadian Institute for Health Information. 2016. Physicians in Canada, 2016: Summary Report. Ottawa: Canadian Institute for Health Information.
Available at: https://secure.cihi.ca/free_products/Physicians_in_Canada_2016.pdf (accessed September 25, 2018).
Eagly, A., and S. Karau. 2002. “Role Congruity Theory of Prejudice Toward Female Leaders.” Psychological Review 109 (3): 573–598.
Eagly, A., and M. Johannesen-Schmidt. 2001. “The Leadership Styles of Women and Men.” Journal of Social Issues 57 (4): 781–797.
Elkinawy, S., and M. Slater. 2011. “Gender differences in executive compensation: Variation with board gender composition and time.” Journal of Economics and Business 63 (1): 23–45. Employment Equity Act. S.C. 1995, c. 44, s. 3.
Ferguson, S.J. 2016. “Women and Education: Qualifications, Skills and Technology.” Women in Canada: A Gender-based Statistical Report. Statistics Canada Catalogue no. 89-503-X. Ottawa: Statistics Canada.
Fortin, N. “Earnings Inequality and the Gender Pay Gap.” State of the Art Lecture, CEA Meetings, June 4th, 2016.
Available at: http://faculty.arts.ubc.ca/nfortin/Fortin_EarningsInequalityGenderPayGap.pdf (accessed May 10, 2018).
Fortin, N.M., and M. Huberman. 2002. Occupational Gender Segregation and Women’s Wages in Canada: An Historical Perspective. Montréal: Center for Interuniversity Research and Analysis of Organizations.
Fortin, N., B. Bell, and M. Böhm, 2017. “Top Earnings Inequality and the Gender Pay Gap: Canada, Sweden, and the United Kingdom.” Labour Economics 47: 107–123.
Fortin, N.M., A. Bonikowska, and M. Drolet. Earnings Inequality and the Gender Pay Gap in Canada: The Role of Women’s Under-representation Among Top Earners. Economic Insights. Ottawa: Statistics Canada. Forthcoming.
Frenette, M., and K. Frank. 2016. Earnings of Postsecondary Graduates by Detailed Field of Study. Economic Insights, no. 056. Statistics Canada Catalogue 11-626-X. Ottawa, Statistics Canada.
Guvenen, F., G. Kaplan, and J. Song. 2014. The Glass Ceiling and the Paper Floor: Gender Differences among Top Earners, 1981-2012. NBER Working Paper Series, no. 20560. Cambridge, Massachusetts: National Bureau of Economic Research.
Goldin, C. 2014. “A Grand Gender Converge: Its Last Chapter.” American Economic Review 104 (4): 1–30.
Hango, D. 2013. “Gender differences in science, technology, engineering, mathematics and computer science (STEM) programs at university.” Insights on Canadian Society. Statistics Canada Catalogue no. 75-006-X.
Houle, P., M. Turcotte, and M. Wendt. 2017. “Changes in parents’ participation in domestic tasks and care for children from 1986 to 2015.” Spotlight on Canadians: Results from the General Social Survey. Statistics Canada Catalogue no. 89-652-X. Ottawa: Statistics Canada.
Hudon, T. 2016. “Visible Minority Women.” Women in Canada: A Gender-based Statistical Report. Statistics Canada Catalogue no. 89-503-X. Ottawa: Statistics Canada.
Lemieux. T., and W.C. Riddell, 2015. “Who are Canada’s Top 1 Percent?” In Income Inequality: The Canadian Story, ed. D.A. Green, W.C. Riddell, and F. St-Hilaire, The Art of the State Series, Volume 5, Part 1: Inequality Trends in Canada, p. 103–155. Montréal: Institute for Research on Public Policy.
Macdonald, D. 2019. The Double-Pane Glass Ceiling: The Gender Pay Gap at the Top of Corporate Canada. Canadian Centre for Policy Alternatives. Available at: https://www.policyalternatives.ca/publications/reports/double-pane-glass-ceiling (accessed January 7, 2019).
Moyser, M., and A. Burlock. 2018. “Time use: Total work burden, unpaid work and leisure.” Women in Canada: A Gender-based Statistical Report. Statistics Canada Catalogue no. 89-503-X. Ottawa: Statistics Canada.
Moyser, M. 2017. “Women and Paid Work”. Women in Canada: A Gender-based Statistical Report. Statistics Canada Catalogue no. 89-503-X. Ottawa: Statistics Canada.
Murphy, B., P. Roberts, and M. Wolfson, 2007. A profile of high-income Canadians: 1982 to 2004. Income Research Paper Series, no. 006. Statistics Canada Catalogue no. 75F0002M. Ottawa: Statistics Canada.
Pew Research Center. 2018. Women and Men in STEM Often at Odds Over Workplace Equity.
Available at: http://www.pewsocialtrends.org/wp-content/uploads/sites/3/2018/01/PS_2018.01.09_STEM_FINAL.pdf (accessed October 17, 2018).
Rincón, V., M. González, and K. Barrero. 2017. “Women and leadership: Gender Barriers to senior management positions.” Intangible Capital 13 (2): 319–386.
Saez, E., and M.R. Veall. 2005. “The Evolution of High Incomes in Northern America: Lessons from Canadian Evidence.” The American Economic Review 95 (3): 831–849.
Statistics Canada. n.d. Table 11-10-0055-01 High income tax filers in Canada.
Available at: https://www150.statcan.gc.ca/t1/tbl1/en/tv.action?pid=1110005501 (accessed November 13, 2018).
Statistics Canada. 2013. Education and Occupation of high-income Canadians: National Household Survey (NHS), 2011. NHS in Brief. Statistics Canada Catalogue no. 99-014-X2011003. Ottawa: Statistics Canada.
UN Women. 2018. Turning Promises into Action: Gender Equality in the 2030 Agenda for Sustainable Development. New York, N.Y.: UN Women. Available at:
http://www.unwomen.org/en/digital-library/publications/2018/2/gender-equality-in-the-2030-agenda-for-sustainable-development-2018 (accessed May 10, 2018).
Uppal, S., and S. LaRochelle-Côté. 2014. “Changes in the occupational profile of young men and women in Canada.” Insights on Canadian Society. April. Statistics Canada Catalogue no. 75-006-X.
- Date modified: