
Analytical Studies Branch Research Paper Series
Assessing Job Quality in Canada: A Multidimensional Approach

Archived Content
Information identified as archived is provided for reference, research or recordkeeping purposes. It is not subject to the Government of Canada Web Standards and has not been altered or updated since it was archived. Please "contact us" to request a format other than those available.
by Wen-Hao Chen and Tahsin Mehdi
Abstract
This paper examines multidimensional aspects of job quality in Canada. Six broad dimensions of job quality were assessed: income and benefits, career prospects, work intensity, working-time quality, skills and discretion, and social environment. Results from both descriptive and latent class analysis reveal a great deal of variation in job quality across sectors and socio-demographic groups. Results show that some of the largest labour market segments, such as hospitality and personal services, are associated with many negative job features. Moreover, workers in atypical contracts or part-time employment also cumulate many disadvantages in the workplace other than being low-paid.
JEL classification: D63, I31, J53
Keywords: job quality, working conditions, well-being, employment security
Executive summary
The past decade saw substantial development with respect to the measurement of statistical indicators to better account for individual and societal well-being. It is now widely recognized that assessing a country’s economic progress involves measuring more than just quantity or the monetary value of goods and services. The quality of the economy, including social and environmental well-being, also matters. In this context, job quality has attracted increasing interest in policy discussion, and various frameworks have been developed by international organizations to measure the multiple facets of workplace quality.
This study assesses job quality in Canada using an internationally inspired multidimensional framework that covers six broad aspects: income and benefits, career prospects, work intensity, working-time quality, skills and discretion, and social environment. The analysis uses the 2016 General Social Survey, which collected a rich set of information on working conditions in Canada.
A total of 23 indicators were constructed to capture the six job quality dimensions. Overall, the descriptive analysis reveals diverse patterns of job quality across sectors and socio-demographic groups. In particular, some of the largest labour market segments, such as hospitality and personal services, exhibit lower job quality features in multiple dimensions, especially in training opportunities, social environment as well as income and benefits. On the other hand, higher job quality features are evident in the finance and professional sector in terms of prospects, flexibility and autonomy. Public administration workers report higher job quality in nearly all dimensions. Results by socio-demographic group show that the concerns relating to the youth labour market involve more than just unemployment, and extend to many of the dimensions examined. And marked differences in job quality are apparent across levels of educational attainment and, to a lesser extent, gender.
The regression analysis performed in this study uses a novel latent class analysis model to identify which workers are more likely to have jobs associated with multiple good or bad job features. About 30% of all workers were predicted to hold a high-quality job associated with many good job features in all six quality dimensions, while 26% had a poor overall quality job that lacks many good features in most dimensions.
As for which observed characteristics affect the probability of being in a particular job quality profile, the results indicate that non-standard work arrangements are strong predictors of job quality classes: about one-third to one-half of workers in atypical contracts or part-time employment fell into the poorest job quality class, all else being equal. Moreover, firm size was positively associated with job quality, a result that suggests demand-side factors also play a role.
1 Introduction
This article assesses job quality in Canada using a multidimensional framework developed on the basis of the international literature. The past decade saw important progress in developing statistical indicators for measuring individual and societal well-being. It is widely recognized that the measure of a country’s progress encompasses more than just economic quantity or the monetary value of goods and services. The quality of the economy as well as social and environmental well-being also matter. Initiatives like the United Nation’s World Happiness Index or the Organisation for Economic Co-operation and Development’s (OECD’s) Better Life Index aim to offer complementary statistics that can capture different aspects of life across populations. In this context, the focus of employment growth has also shifted from the number of jobs created to the types of jobs created.
The notion of job quality was traditionally understood as being represented by the wage level or type of employment, for which information is accessible in most labour force surveys. However, job quality could also refer to physical conditions, social environments, flexibility or skill development, which impact or foster a worker’s well-being. While there is no commonly accepted definition of job quality, considerable effort has been made by international organizations to identify various dimensions of workplace quality in ways that cover its multiple facets (OECD 2014; Cazes, Hijzen and Saint-Martin 2016).
The focus on multidimensional job quality is pertinent to the discussion of equality and economic empowerment in the face of a fast-changing world of work. The modern economy is increasingly becoming knowledge-based and tends to benefit those who are highly educated. Many new jobs have been created in personal care services as a result of an aging population. At the same time, so-called atypical employment has increased. Whether this new economy is inclusive or not can be better understood by examining multiple aspects of job quality in addition to wages or compensation. The results also have implications for gender equality, with women still more likely than men to work part-time, often by choice, and to be overrepresented or underrepresented in particular industries and occupations (Moyser 2017). Variability in the quality of jobs offered in these sectors could have ramifications for an inclusive economy.
Job quality also has implications for economic and labour market performance. Empirical evidence has shown that higher quality jobs improve the subjective well-being of employees (Horowitz 2016; Salvatori 2010) and contribute to at-work productivity (Arends, Prinz and Abma 2017). Better job quality also makes work more attractive, and thus stimulates employment growth by encouraging inactive persons to enter the labour market, and prevents early exits. On the other hand, a poor working environment is often associated with health risks, leading to quitting (Green 2010), labour market withdrawal (Turcotte and Schellenberg 2005; Park 2010) and more sickness absence (Catalina-Romero et al. 2015; Milner et al. 2015).
To date, Canadian literature on job quality has been rather scarce, in part because of a lack of comprehensive data on workplace issues as well as a lack of relevant frameworks to guide data collection. Some early studies were able to paint a partial portrait of job quality by combining a wide range of data sources or by drawing from small scale surveys (Jackson and Kumar 1998; Lowe and Schellenberg 2001; Brisbois 2003; Shields 2006; Lowe 2007), but a comprehensive assessment of multiple job quality aspects using a unified data source remained elusive.Note This study fills this gap by using the rich information on working conditions collected by the 2016 General Social Survey (GSS) to construct indicators of job quality situated within an international framework.
The remainder of the paper is organized as follows. Section 2 reviews the international framework on job quality, and discusses how the 2016 GSS can be used to construct relevant indicators. Section 3 presents a portrait of multidimensional job quality in Canada across both sectoral/occupational and socioeconomic groups. In Section 4, the study employs a latent class analysis to categorize workers with similar-quality jobs and assess the relationship between the predicted job quality profiles and the observed characteristics. Section 5 concludes.
2 Framework and data
Various multidimensional frameworks have been proposed in the literature to assess job quality. Some focus on the attributes of the job itself; some include employment relationships; while others encompass broader labour market and social contextual information, such as provisions of social protection schemes (see Cazes, Hijzen and Saint-martin [2016] for a review). Depending on the framework, suggested indicators may be objective or subjective, and measured at an individual or aggregate level, or both. This study incorporates the framework proposed by the European Foundation for the Improvement of Living and Working Conditions (Eurofound 2016).
One important feature of the Eurofound framework is that it is “data” driven: the organization used its own surveys (i.e., the European Working Conditions Survey [EWCS]) to construct the proposed job quality indicators. This ensures all indicators are measured in a consistent manner. The study follows the Eurofound framework because the 2016 Canadian GSS data also collected several core job-quality-related questions based on the EWCS modules. This allows us to construct multiple dimensions of job quality indicators for Canada according to a well-developed international framework, with potential for comparability to European studies.
Figure 1 illustrates the seven dimensions of job quality developed by the Eurofound, with minor modifications. These are (1) Income and benefits; (2) Prospects; (3) Work intensity; (4) Working-time quality; (5) Skills and discretion; (6) Social environment; and (7) Physical health risks. Each of these includes one or more sub-topics, which can be assessed through a set of questions in the surveys. The first two dimensions relate to extrinsic job features, while the remaining five dimensions together measure the quality of the working environment. The OECD (2014) refers to the latter grouping as job strain, which can be measured by the extent of job demands and job resources.

Description for Figure 1
The title of Figure 1 is “Job quality dimensions (based on the European Union).”
This diagram illustrates the 7 dimensions of job quality developed by Eurofound, with minor modifications. The diagram contains 10 frames. The top 3 frames are “Compensation quality,” “Employment security,” and “Work environment.” “Work environment” is subdivided into “Job demands” and “Job resources.” Below these 3 frames are the 7 frames containing the 7 job quality dimensions and one or more sub-topics.
Under the “Compensation quality” is one job-quality dimension: “1. Income and benefits,” which includes the following sub-topics: “Hourly wages”; and “Benefits (e.g., paid leave, pension plan, disability insurance).”
Under “Employment security” is one job-quality dimension: “2. Prospects.” It includes the following sub-topics: “Job security” and “Career prospects.”
Under “Work environment,” “Job demands,” are three job-quality dimensions: “3. Work intensity,” which includes the following sub-topics: “Quantitative demands,” and “Pace determinants”; “4. Working-time quality,” which includes the following sub-topics: “Atypical schedule,” “Time arrangement,” and “Flexibility”; and “7. Physical health risks,” which includes the following sub-topics: “Exposure to noise, extreme temperatures, smoke, etc.,” “Tiring/painful positions,” and “Carrying heavy loads.”
Under “Work environment,” “Job resources,” are two job-quality dimensions: “5. Skills and discretion,” which includes the following sub-topics: “Autonomy” and “Training opportunity”; and “6. Social environment,” which includes the following sub-topics: “Adverse social behaviour,” “Managerial support,” and “Collective representation.”
Footnote 1 at the bottom of the diagram indicates that the information for hourly wages and physical health risks is not available in the 2016 Canadian General Social Survey.
The source of Figure 1 is as follows: Eurofound, 2016, Sixth European Working Conditions Survey—Overview Report.
Indicators of job quality dimensions were constructed following three guidelines (Eurofound 2016). First, all indicators were defined at the level of the job/worker on the basis of micro-data. This allows job quality outcomes to be examined across socioeconomic groups or sectors in order to address distributional issues. Second, each indicator can be categorized into either a positive or a negative job feature. Higher job demands, such as heavy workload, would be regarded negatively while better job resources (e.g., paid training) are indicative of positive job features. Third, these indicators are somewhat objective in the sense that the described features can be observed by a third party. Purely subjective measures that involve an individual’s feelings or perceptions (job satisfaction) were not considered.
Job quality indicators: data and summary statistics
This analysis draws data primarily from the 2016 GSS. Following the described framework, 23 indicators were constructed to capture 6 out of the 7 job quality dimensions mentioned.Note The omission is the physical environment dimension, for which information was not available. Table 1 lists a brief description of the 23 job quality indicators and their mean value. The sample was restricted to workers aged 18 and older.
| Job quality dimension, sub-topic and indicator | Positive (P) or negative (N) indicator | Mean (weighted) |
|---|---|---|
| percent | ||
| 1. Prospects | ||
| Job insecurity | ||
| Might lose job in the next six months | N | 10.5 |
| Career prospects | ||
| Job offers good prospects for career advancement | P | 51.7 |
| 2. Work intensity | ||
| Quantitative demands | ||
| Workload not often manageable | N | 26.2 |
| Pace determinants | ||
| Often cannot finish assigned work during regular working hours | N | 25.2 |
| 3. Working-time quality | ||
| Atypical work schedule | ||
| Involuntary irregular schedule (rotating, split, on-call or shift job) | N | 12.1 |
| Time arrangement | ||
| Can choose start/end time of your work day | P | 41.5 |
| Flexibility | ||
| Easy to take 1 or 2 hours off for personal matters | P | 71.2 |
| 4. Skills and discretion | ||
| Autonomy | ||
| Can choose the sequence of tasks | P | 66.4 |
| Have opportunities to provide input into decisions | P | 77.0 |
| Training opportunity | ||
| Had formal training paid by employer | P | 41.5 |
| Had informal/on-the-job training | P | 56.1 |
| 5. Social environment | ||
| Adverse social behaviour | ||
| Experienced verbal, sexual or physical violence at work | N | 15.1 |
| Managerial support | ||
| Received support from managers | P | 63.8 |
| Had a formal job performance assessment | P | 58.5 |
| Collective representation | ||
| Covered by a union contract / collective agreement | P | 32.1 |
| dollars | ||
| 6. Income and benefits | ||
| Hourly wage (from LFS) | ||
| Mean hourly earnings | P | 26.8 |
| percent | ||
| Employment benefits | ||
| Workplace pension plan | P | 39.0 |
| Paid sick leave | P | 42.4 |
| Paid vacation leave | P | 56.1 |
| Disability insurance | P | 42.3 |
| Supplemental medical/dental care | P | 46.6 |
| Worker's compensation | P | 49.6 |
| Maternity, parental or layoff benefits | P | 42.4 |
|
Notes: Indicators were constructed on the basis of the 2016 General Social Survey questions (see Appendix Table 1) except for hourly wage, which was derived from monthly Labour Force Survey (LFS) data (March 2016). The sample was restricted to workers (self-employment included) aged 18 and older. The number of observations is 10,680. Source: Statistics Canada, author calculations. |
||
Two indicators were used to capture the prospects dimension of the current job: the future continuity and the possibility of career progression. Only about 11% of workers indicated that they may lose their job in the next 6 months, while more than half said their job offers good prospects for career advancement. Note that the study does not consider contract type as a prospects indicator, as commonly seen in the European literature. This is because from a Canadian stand-point, it is rather difficult to associate some atypical forms of work with negative or positive prospects. Some self-employed professionals and entrepreneurs indeed improve their job security and career prospects as they gain more experience. Similarly, fixed-term jobs are frequently renewed, while indefinite contracts can be terminated easily. This is echoed by OECD (2013), in which Canada ranked low among OECD countries in terms of the protection of permanent workers against dismissal.
Work intensity is captured by two negative indicators of job quality: workload not often manageable and often cannot finish work during regular hours. The former gives a broad sense of time pressure from work, and the latter reveals certain degree of constant pressure on a regular basis. About a quarter of the sample reported high work intensity using the two indicators.
The assessment of working-time quality includes three indicators: involuntary atypical work schedule, time arrangement, and flexibility over working time. About 12% of workers reported an irregular work schedule. This is considered a negative job feature given its involuntary nature. For control over time arrangement, nearly 42% of workers reported the ability to choose the start/end time of the work day, while 71% indicated having flexibility to take some hours off for personal matters.
The dimension of skills and discretion refers to the job aspect that allows workers to apply their skills with some degree of autonomy over their tasks and resources, as well as the training opportunity to develop skills required in the job. Four indicators were used. On autonomy, the ability to choose the sequence of tasks as well as the opportunity to provide input into decisions that affect work were measured. Overall, about two-thirds to three-quarters of workers reported a high degree of autonomy in their job. On training opportunity, about 42% (56%) of current workers received formal (informal) training in the last 12 months.
Social environment in the workplace was assessed by means of indicators covering three elements: adverse social behaviour, managerial support, and collective representation. About 15% of workers reported abusive experiences, such as verbal abuse, sexual harassment, threats, humiliation, or physical violence. The extent of managerial support was measured by two variables: received support from manager and had a formal job performance assessment. The former refers to support from an immediate supervisor while the latter refers to a management system that enables lines of communication, recognition, and identifying areas of improvement. Overall, about 60% of employees received some type of managerial support in their job. Another positive indicator of social environment was captured by collective representation. In 2016, less than one-third of workers was covered by a union contract or collective agreement.
The dimension of income and benefits includes hourly wagesNote and seven employment benefits (workplace pension plan; paid sick leave; paid vacation leave; disability insurance; supplemental medical/dental care; workers’ compensation; and maternity, parental or layoff benefits). Those benefits, such as a pension plan, may be considered as “deferred” earnings, and therefore are important to capture earnings quality of the job. Overall, about 40% of workers stated that their job included at least one of the employment benefits mentioned.
3 Portrait of job quality in Canada
This section presents a portrait of job quality in Canada using the multidimensional indicators defined earlier. The study examined the distribution of job quality by sector/occupation and by socio-demographic group. This made it possible to assess whether jobs associated with the largest or fastest-growing sectors and professions are of higher or lower quality, and also to assess whether workers from different demographic backgrounds have equal representation in higher quality jobs. Profound distributional implications can arise as a result of imbalances in access to higher quality jobs by different groups.
3.1 How do sectors/occupations compare?
Table 2 presents the 6 job quality dimensions for 9 industrial and 8 occupational groups.Note The top row shows the overall mean of each of the 23 job quality indicators, and the cells below report deviations from their respective means. Cells are coloured according to the significance level of their deviation values. A medium (light) blue colour indicates much higher than average (higher than average) job quality, while the opposite is shown by a red (pink) colour, whereas a white colour indicates average job quality.Note
Overall, job quality seems to be higher in the public administration, primary, and finance and professional service sectors, average in education, trades and transportation, and construction, and lower in health care, manufacturing, and hospitality. Public administration jobs scored relatively high in nearly all quality dimensions, particularly in working-time quality, training, social environment as well as income and benefits. For example, nearly 60% of public administration workers had paid formal training over the previous year, compared to only 42% on average. The finance and professional sector also did well in the areas of prospects, flexibility and autonomy, whereas workers in the primary sector (agriculture, fishing, and oil extraction) were slightly above the average across the board.
On the other hand, some of the larger (and fastest-growing) sectors, like health care, hospitality (accommodation and food services) and construction, did poorly in multiple job quality dimensions. The health care sector, which saw a 35% growth in employment between 2006 and 2016 and accounted for 13.4% of the workforce in 2016, exhibited low scores in working-time quality and high incidence of workplace violence. This is consistent with the literature on workplace aggression in health care professions (Shields and Wilkins 2009; Chappell and Di Martino 2006). Similarly, hospitality (16% of workforce) performed poorly in nearly all job quality dimensions, especially training opportunities, social environment, and income and benefits.
Cross-sectoral differences in job quality are more evident in the dimensions of working-time quality, training, social environment and benefits. For example, 59% of finance and professional sector workers enjoyed flexible start/end hours, compared to only 28% (31%) in education (health care). Nearly 56% of public administration employees had a retirement pension plan, while only 21% of workers in hospitality did.
There is also marked heterogeneity across job quality dimensions within sectors. In education, for instance, some job features are very favourable (skills and discretion, and social environment), while some are very disadvantageous (work intensity, and inflexibility). Similar patterns are also found in health care, and to a lesser extent, in construction.
Such diverse sectoral patterns may reflect very different job types within a broadly defined sector. Table 2 also reports how job quality is distributed across occupations. Overall, differences in job quality are more visible along the ‘blue-collar’–‘white-collar’ line. Office-based jobs scored higher in three or more of the quality dimensions, whereas jobs that require manual labour or customer interaction did poorly in nearly all areas. The only exception was work intensity.
It is of interest to relate these findings to the job polarization literature, which argues that employment growth has been polarized into both high-skill professional jobs and low-skill service--related jobs, with a hollowing out of the middle over the past few decades (Autor and Dorn 2013; Goos, Manning and Salomons 2009), although the pattern seems to have stalled after 2000 in Canada (Green and Sand 2015). The study’s findings of marked job quality gaps between professional and low-end service jobs implies that job polarization could lead to an increasingly divided labour market, where jobs are either associated with many higher quality features or associated with many lower quality features—but not somewhere in between.
| GSS weighted share | Employment growth rate, 2006 to 2016, LFSTable 2 Note 2 | 1. Prospects | 2. Work intensity | 3. Working-time quality | 4. Skills and discretion | 5. Social environment | 6. Income and benefits | ||||||||||||||||||
|---|---|---|---|---|---|---|---|---|---|---|---|---|---|---|---|---|---|---|---|---|---|---|---|---|---|
| Might lose job in next six months | Job offers good advancement prospectsTable 2 Note 1 | Workload not often manageable | Often cannot finish work in regular hoursTable 2 Note 1 | Involuntary irregular schedule | Flexible start/end hoursTable 2 Note 1 | Can take time off for personal reasonsTable 2 Note 1 | Can decide sequence of tasks | Have opportunities to provide inputTable 2 Note 1 | Paid formal trainingTable 2 Note 1 | Informal trainingTable 2 Note 1 | Verbal abuse, sexual harassment, threats, humiliation, or physical violence | Support from managersTable 2 Note 1 | Had formal job performance evaluationTable 2 Note 1 | Have formal employee representation body | Workplace pension planTable 2 Note 1 | Paid sick leaveTable 2 Note 1 | Paid vacation leaveTable 2 Note 1 | Disability insuranceTable 2 Note 1 | Supplemental medical/dental careTable 2 Note 1 | Workers' compensationTable 2 Note 1 | Maternity, parental or layoff benefitsTable 2 Note 1 | Mean hourly earningsTable 2 Note 2 | |||
| percent | percent (mean) | dollars | |||||||||||||||||||||||
| Overall | 100.0 | 11.6 | 10.5 | 51.7 | 26.2 | 25.2 | 12.1 | 41.5 | 71.2 | 66.4 | 77.0 | 41.5 | 56.1 | 15.1 | 63.8 | 58.5 | 32.1 | 39.0 | 42.4 | 56.1 | 42.3 | 46.6 | 49.6 | 42.4 | 26.8 |
| percent | percent (deviation from mean) | dollars (deviation) | |||||||||||||||||||||||
| Industry | |||||||||||||||||||||||||
| Trades/transportation | 18.7 | 8.1 | Much higher than average (at 1% level)-2.6 | Average (within the average, not significant at 10% level)0.1 | Higher than average (between the 1% and 10% levels)-2.8 | Much higher than average (at 1% level)-6.6 | Much lower than average (at 1% level)6.9 | Average (within the average, not significant at 10% level)-1.3 | Average (within the average, not significant at 10% level)-1.5 | Average (within the average, not significant at 10% level)-2.1 | Lower than average (between the 1% and 10% levels)-2.6 | Much lower than average (at 1% level)-5.9 | Much lower than average (at 1% level)-4.3 | Average (within the average, not significant at 10% level)0.2 | Average (within the average, not significant at 10% level)0.5 | Lower than average (between the 1% and 10% levels)-3.9 | Much lower than average (at 1% level)-11.9 | Lower than average (between the 1% and 10% levels)-3.6 | Lower than average (between the 1% and 10% levels)-3.2 | Average (within the average, not significant at 10% level)1.5 | Average (within the average, not significant at 10% level)-2.2 | Average (within the average, not significant at 10% level)-0.1 | Average (within the average, not significant at 10% level)1.9 | Average (within the average, not significant at 10% level)-1.9 | Much lower than average (at 1% level)-4.8 |
| Finance/professional | 17.6 | 15.8 | Average (within the average, not significant at 10% level)0.3 | Much higher than average (at 1% level)8.1 | Average (within the average, not significant at 10% level)1.8 | Much lower than average (at 1% level)6.1 | Much higher than average (at 1% level)-5.7 | Much higher than average (at 1% level)17.6 | Much higher than average (at 1% level)13.3 | Much higher than average (at 1% level)5.9 | Much higher than average (at 1% level)5.9 | Average (within the average, not significant at 10% level)-0.3 | Much higher than average (at 1% level)6.9 | Much higher than average (at 1% level)-5.1 | Average (within the average, not significant at 10% level)2.6 | Much higher than average (at 1% level)12.1 | Much lower than average (at 1% level)-22.5 | Average (within the average, not significant at 10% level)-2.5 | Higher than average (between the 1% and 10% levels)3.2 | Average (within the average, not significant at 10% level)-1.1 | Average (within the average, not significant at 10% level)1.0 | Average (within the average, not significant at 10% level)1.2 | Much lower than average (at 1% level)-9.5 | Average (within the average, not significant at 10% level)-1.1 | Much higher than average (at 1% level)5.0 |
| Hospitality | 15.9 | 18.5 | Average (within the average, not significant at 10% level)0.9 | Lower than average (between the 1% and 10% levels)-4.9 | Average (within the average, not significant at 10% level)-1.6 | Much higher than average (at 1% level)-4.5 | Lower than average (between the 1% and 10% levels)2.8 | Average (within the average, not significant at 10% level)2.2 | Much lower than average (at 1% level)-6.5 | Average (within the average, not significant at 10% level)-1.9 | Lower than average (between the 1% and 10% levels)-4.0 | Much lower than average (at 1% level)-7.7 | Much lower than average (at 1% level)-12.0 | Average (within the average, not significant at 10% level)-0.1 | Average (within the average, not significant at 10% level)0.0 | Much lower than average (at 1% level)-15.5 | Much lower than average (at 1% level)-16.1 | Much lower than average (at 1% level)-17.6 | Much lower than average (at 1% level)-12.4 | Lower than average (between the 1% and 10% levels)-4.8 | Much lower than average (at 1% level)-13.5 | Much lower than average (at 1% level)-14.9 | Lower than average (between the 1% and 10% levels)-4.6 | Much lower than average (at 1% level)-9.2 | Much lower than average (at 1% level)-8.0 |
| Health care | 13.4 | 34.5 | Much higher than average (at 1% level)-2.5 | Average (within the average, not significant at 10% level)-2.9 | Much lower than average (at 1% level)3.9 | Average (within the average, not significant at 10% level)-1.1 | Much lower than average (at 1% level)5.1 | Much lower than average (at 1% level)-10.2 | Much lower than average (at 1% level)-12.8 | Average (within the average, not significant at 10% level)-2.0 | Lower than average (between the 1% and 10% levels)-2.7 | Much higher than average (at 1% level)7.2 | Higher than average (between the 1% and 10% levels)2.9 | Much lower than average (at 1% level)9.9 | Much lower than average (at 1% level)-9.1 | Much higher than average (at 1% level)4.5 | Much higher than average (at 1% level)24.5 | Much higher than average (at 1% level)8.1 | Much higher than average (at 1% level)7.4 | Much higher than average (at 1% level)4.6 | Average (within the average, not significant at 10% level)0.9 | Average (within the average, not significant at 10% level)2.7 | Higher than average (between the 1% and 10% levels)3.2 | Much higher than average (at 1% level)6.3 | Average (within the average, not significant at 10% level)0.0 |
| Manufacturing | 8.8 | -19.0 | Lower than average (between the 1% and 10% levels)2.9 | Much lower than average (at 1% level)-7.6 | Average (within the average, not significant at 10% level)-1.1 | Higher than average (between the 1% and 10% levels)-4.0 | Higher than average (between the 1% and 10% levels)-2.6 | Much lower than average (at 1% level)-7.6 | Much higher than average (at 1% level)8.6 | Average (within the average, not significant at 10% level)-2.6 | Average (within the average, not significant at 10% level)-2.5 | Much lower than average (at 1% level)-9.6 | Much lower than average (at 1% level)-7.9 | Much higher than average (at 1% level)-3.9 | Average (within the average, not significant at 10% level)-1.6 | Much lower than average (at 1% level)-6.1 | Much lower than average (at 1% level)-10.0 | Average (within the average, not significant at 10% level)1.8 | Lower than average (between the 1% and 10% levels)-5.4 | Much higher than average (at 1% level)6.3 | Much higher than average (at 1% level)6.1 | Higher than average (between the 1% and 10% levels)5.5 | Average (within the average, not significant at 10% level)3.3 | Average (within the average, not significant at 10% level)-1.5 | Much lower than average (at 1% level)-1.2 |
| Education | 7.9 | 9.9 | Higher than average (between the 1% and 10% levels)-2.9 | Average (within the average, not significant at 10% level)-2.1 | Lower than average (between the 1% and 10% levels)4.7 | Much lower than average (at 1% level)17.8 | Much higher than average (at 1% level)-7.1 | Much lower than average (at 1% level)-13.3 | Much lower than average (at 1% level)-12.9 | Higher than average (between the 1% and 10% levels)5.5 | Average (within the average, not significant at 10% level)3.0 | Much higher than average (at 1% level)7.5 | Much higher than average (at 1% level)11.5 | Average (within the average, not significant at 10% level)1.5 | Average (within the average, not significant at 10% level)-2.0 | Much higher than average (at 1% level)10.1 | Much higher than average (at 1% level)41.0 | Much higher than average (at 1% level)12.3 | Much higher than average (at 1% level)12.3 | Much lower than average (at 1% level)-8.7 | Average (within the average, not significant at 10% level)2.9 | Average (within the average, not significant at 10% level)2.0 | Average (within the average, not significant at 10% level)-3.8 | Higher than average (between the 1% and 10% levels)4.2 | Much higher than average (at 1% level)6.7 |
| Public Administration | 6.5 | 9.3 | Higher than average (between the 1% and 10% levels)-3.1 | Average (within the average, not significant at 10% level)3.6 | Average (within the average, not significant at 10% level)2.9 | Much lower than average (at 1% level)6.4 | Higher than average (between the 1% and 10% levels)-3.3 | Much higher than average (at 1% level)9.4 | Much higher than average (at 1% level)8.7 | Average (within the average, not significant at 10% level)-1.1 | Average (within the average, not significant at 10% level)-3.0 | Much higher than average (at 1% level)18.0 | Much higher than average (at 1% level)15.3 | Lower than average (between the 1% and 10% levels)3.3 | Higher than average (between the 1% and 10% levels)5.1 | Much higher than average (at 1% level)24.0 | Much higher than average (at 1% level)38.0 | Much higher than average (at 1% level)17.3 | Much higher than average (at 1% level)13.3 | Average (within the average, not significant at 10% level)0.0 | Much higher than average (at 1% level)9.5 | Higher than average (between the 1% and 10% levels)4.9 | Average (within the average, not significant at 10% level)0.9 | Much higher than average (at 1% level)7.9 | Much higher than average (at 1% level)8.6 |
| Construction | 6.4 | 31.2 | Much lower than average (at 1% level)8.2 | Higher than average (between the 1% and 10% levels)5.7 | Higher than average (between the 1% and 10% levels)-4.3 | Higher than average (between the 1% and 10% levels)-5.4 | Much higher than average (at 1% level)-5.6 | Lower than average (between the 1% and 10% levels)-6.8 | Much higher than average (at 1% level)6.5 | Average (within the average, not significant at 10% level)-0.3 | Much higher than average (at 1% level)8.6 | Average (within the average, not significant at 10% level)-1.8 | Lower than average (between the 1% and 10% levels)-7.6 | Much higher than average (at 1% level)-5.0 | Much higher than average (at 1% level)7.5 | Much lower than average (at 1% level)-27.6 | Lower than average (between the 1% and 10% levels)-6.3 | Average (within the average, not significant at 10% level)-4.7 | Much lower than average (at 1% level)-15.0 | Average (within the average, not significant at 10% level)-3.9 | Average (within the average, not significant at 10% level)-0.5 | Average (within the average, not significant at 10% level)2.7 | Much higher than average (at 1% level)12.8 | Average (within the average, not significant at 10% level)-2.5 | Much higher than average (at 1% level)2.5 |
| Primary | 4.7 | -0.1 | Lower than average (between the 1% and 10% levels)5.4 | Average (within the average, not significant at 10% level)2.8 | Higher than average (between the 1% and 10% levels)-5.0 | Average (within the average, not significant at 10% level)-3.9 | Average (within the average, not significant at 10% level)-1.1 | Average (within the average, not significant at 10% level)0.5 | Average (within the average, not significant at 10% level)1.5 | Average (within the average, not significant at 10% level)-3.9 | Higher than average (between the 1% and 10% levels)6.3 | Much higher than average (at 1% level)9.5 | Average (within the average, not significant at 10% level)4.7 | Average (within the average, not significant at 10% level)-2.6 | Average (within the average, not significant at 10% level)5.5 | Average (within the average, not significant at 10% level)0.5 | Average (within the average, not significant at 10% level)-2.2 | Higher than average (between the 1% and 10% levels)8.2 | Higher than average (between the 1% and 10% levels)6.5 | Higher than average (between the 1% and 10% levels)7.2 | Much higher than average (at 1% level)14.2 | Much higher than average (at 1% level)10.6 | Much higher than average (at 1% level)14.5 | Much higher than average (at 1% level)9.4 | Much higher than average (at 1% level)6.5 |
| Occupation | |||||||||||||||||||||||||
| White-collar | |||||||||||||||||||||||||
| Professionals | 23.3 | 32.1 | Higher than average (between the 1% and 10% levels)-1.4 | Higher than average (between the 1% and 10% levels)2.9 | Much lower than average (at 1% level)5.1 | Much lower than average (at 1% level)12.2 | Much higher than average (at 1% level)-5.0 | Much higher than average (at 1% level)12.0 | Average (within the average, not significant at 10% level)1.2 | Much higher than average (at 1% level)6.4 | Much higher than average (at 1% level)4.4 | Much higher than average (at 1% level)5.9 | Much higher than average (at 1% level)11.2 | Average (within the average, not significant at 10% level)1.1 | Average (within the average, not significant at 10% level)-2.1 | Much higher than average (at 1% level)14.3 | Much higher than average (at 1% level)12.5 | Much higher than average (at 1% level)4.3 | Much higher than average (at 1% level)8.2 | Much lower than average (at 1% level)-4.5 | Much higher than average (at 1% level)3.6 | Higher than average (between the 1% and 10% levels)2.8 | Much lower than average (at 1% level)-5.1 | Much higher than average (at 1% level)3.9 | Much higher than average (at 1% level)8.7 |
| Clerks | 12.2 | 2.5 | Average (within the average, not significant at 10% level)0.3 | Lower than average (between the 1% and 10% levels)-3.9 | Average (within the average, not significant at 10% level)-1.7 | Average (within the average, not significant at 10% level)-1.3 | Much higher than average (at 1% level)-6.7 | Higher than average (between the 1% and 10% levels)4.5 | Much higher than average (at 1% level)12.6 | Much higher than average (at 1% level)4.4 | Average (within the average, not significant at 10% level)-2.1 | Much lower than average (at 1% level)-6.3 | Average (within the average, not significant at 10% level)-2.1 | Average (within the average, not significant at 10% level)-1.3 | Average (within the average, not significant at 10% level)2.5 | Average (within the average, not significant at 10% level)2.1 | Average (within the average, not significant at 10% level)-0.6 | Average (within the average, not significant at 10% level)1.2 | Average (within the average, not significant at 10% level)2.1 | Average (within the average, not significant at 10% level)0.2 | Average (within the average, not significant at 10% level)0.6 | Average (within the average, not significant at 10% level)0.7 | Lower than average (between the 1% and 10% levels)-3.7 | Average (within the average, not significant at 10% level)-0.5 | Much lower than average (at 1% level)-3.2 |
| Technicians | 11.0 | 21.5 | Average (within the average, not significant at 10% level)0.5 | Average (within the average, not significant at 10% level)-1.4 | Average (within the average, not significant at 10% level)-0.2 | Average (within the average, not significant at 10% level)0.5 | Much lower than average (at 1% level)3.8 | Much lower than average (at 1% level)-8.4 | Lower than average (between the 1% and 10% levels)-4.7 | Average (within the average, not significant at 10% level)-2.3 | Average (within the average, not significant at 10% level)0.4 | Much higher than average (at 1% level)7.4 | Higher than average (between the 1% and 10% levels)3.8 | Average (within the average, not significant at 10% level)-0.7 | Average (within the average, not significant at 10% level)0.5 | Much higher than average (at 1% level)5.8 | Higher than average (between the 1% and 10% levels)4.8 | Average (within the average, not significant at 10% level)3.1 | Much higher than average (at 1% level)5.5 | Average (within the average, not significant at 10% level)0.5 | Average (within the average, not significant at 10% level)0.3 | Average (within the average, not significant at 10% level)-0.7 | Average (within the average, not significant at 10% level)-1.4 | Average (within the average, not significant at 10% level)-0.7 | Much higher than average (at 1% level)2.4 |
| Managers | 10.1 | -10.1 | Average (within the average, not significant at 10% level)-1.9 | Much higher than average (at 1% level)11.1 | Much lower than average (at 1% level)6.8 | Much lower than average (at 1% level)19.4 | Much higher than average (at 1% level)-5.3 | Much higher than average (at 1% level)27.6 | Much higher than average (at 1% level)15.9 | Much higher than average (at 1% level)10.0 | Much higher than average (at 1% level)12.7 | Average (within the average, not significant at 10% level)3.7 | Average (within the average, not significant at 10% level)2.5 | Much higher than average (at 1% level)-3.0 | Average (within the average, not significant at 10% level)0.6 | Much higher than average (at 1% level)12.2 | Much lower than average (at 1% level)-25.2 | Average (within the average, not significant at 10% level)-2.7 | Higher than average (between the 1% and 10% levels)5.4 | Average (within the average, not significant at 10% level)2.2 | Higher than average (between the 1% and 10% levels)4.6 | Higher than average (between the 1% and 10% levels)5.1 | Average (within the average, not significant at 10% level)-0.9 | Average (within the average, not significant at 10% level)2.7 | Much higher than average (at 1% level)14.0 |
| Blue-collar | |||||||||||||||||||||||||
| Machine operators | 12.3 | 6.0 | Much lower than average (at 1% level)3.8 | Higher than average (between the 1% and 10% levels)3.4 | Much higher than average (at 1% level)-5.0 | Much higher than average (at 1% level)-8.1 | Higher than average (between the 1% and 10% levels)-1.8 | Much lower than average (at 1% level)-15.7 | Average (within the average, not significant at 10% level)0.0 | Much lower than average (at 1% level)-9.1 | Average (within the average, not significant at 10% level)0.1 | Average (within the average, not significant at 10% level)-0.3 | Much lower than average (at 1% level)-10.3 | Higher than average (between the 1% and 10% levels)-2.5 | Higher than average (between the 1% and 10% levels)3.5 | Much lower than average (at 1% level)-17.1 | Higher than average (between the 1% and 10% levels)4.2 | Higher than average (between the 1% and 10% levels)4.2 | Much lower than average (at 1% level)-7.1 | Much higher than average (at 1% level)6.2 | Much higher than average (at 1% level)8.4 | Much higher than average (at 1% level)7.5 | Much higher than average (at 1% level)16.5 | Average (within the average, not significant at 10% level)1.9 | Much lower than average (at 1% level)-1.6 |
| Elementary | 6.1 | -4.6 | Much lower than average (at 1% level)7.5 | Lower than average (between the 1% and 10% levels)-6.1 | Higher than average (between the 1% and 10% levels)-5.4 | Much higher than average (at 1% level)-12.5 | Lower than average (between the 1% and 10% levels)3.6 | Much lower than average (at 1% level)-21.8 | Average (within the average, not significant at 10% level)-2.4 | Much lower than average (at 1% level)-11.2 | Average (within the average, not significant at 10% level)0.6 | Lower than average (between the 1% and 10% levels)-6.3 | Much lower than average (at 1% level)-8.1 | Average (within the average, not significant at 10% level)-0.3 | Average (within the average, not significant at 10% level)1.6 | Much lower than average (at 1% level)-10.1 | Much lower than average (at 1% level)-7.3 | Average (within the average, not significant at 10% level)-0.6 | Much lower than average (at 1% level)-10.8 | Average (within the average, not significant at 10% level)4.1 | Average (within the average, not significant at 10% level)1.4 | Average (within the average, not significant at 10% level)-2.1 | Average (within the average, not significant at 10% level)3.9 | Average (within the average, not significant at 10% level)-0.5 | Much lower than average (at 1% level)-2.7 |
| Sales | 9.7 | 14.4 | Average (within the average, not significant at 10% level)-1.8 | Average (within the average, not significant at 10% level)-2.6 | Average (within the average, not significant at 10% level)-2.5 | Much higher than average (at 1% level)-8.5 | Much lower than average (at 1% level)13.0 | Average (within the average, not significant at 10% level)-0.6 | Lower than average (between the 1% and 10% levels)-4.2 | Average (within the average, not significant at 10% level)1.9 | Lower than average (between the 1% and 10% levels)-4.6 | Much lower than average (at 1% level)-7.9 | Average (within the average, not significant at 10% level)1.5 | Average (within the average, not significant at 10% level)-0.2 | Average (within the average, not significant at 10% level)-0.5 | Much lower than average (at 1% level)-6.1 | Much lower than average (at 1% level)-18.6 | Much lower than average (at 1% level)-10.5 | Much lower than average (at 1% level)-8.4 | Average (within the average, not significant at 10% level)-2.3 | Much lower than average (at 1% level)-10.1 | Much lower than average (at 1% level)-7.5 | Lower than average (between the 1% and 10% levels)-4.6 | Much lower than average (at 1% level)-6.2 | Much lower than average (at 1% level)-8.0 |
| Personal services | 15.2 | 19.4 | Higher than average (between the 1% and 10% levels)-2.2 | Lower than average (between the 1% and 10% levels)-4.2 | Higher than average (between the 1% and 10% levels)-3.1 | Much higher than average (at 1% level)-10.1 | Much lower than average (at 1% level)5.5 | Much lower than average (at 1% level)-7.9 | Much lower than average (at 1% level)-13.9 | Much lower than average (at 1% level)-7.9 | Much lower than average (at 1% level)-8.8 | Average (within the average, not significant at 10% level)-2.4 | Much lower than average (at 1% level)-7.6 | Much lower than average (at 1% level)4.2 | Average (within the average, not significant at 10% level)-2.7 | Much lower than average (at 1% level)-11.3 | Higher than average (between the 1% and 10% levels)3.5 | Much lower than average (at 1% level)-4.4 | Much lower than average (at 1% level)-5.0 | Average (within the average, not significant at 10% level)-0.5 | Much lower than average (at 1% level)-9.2 | Much lower than average (at 1% level)-7.0 | Average (within the average, not significant at 10% level)0.4 | Lower than average (between the 1% and 10% levels)-3.5 | Much lower than average (at 1% level)-8.3 |
|
Job quality indicator (significance level of difference between group mean and overall mean) Much higher than average (at 1% level) Higher than average (between the 1% and 10% levels) Average (within the average, not significant at 10% level) Lower than average (between the 1% and 10% levels) Much lower than average (at 1% level)
Sources: Statistics Canada, 2016 General Social Survey (GSS) and 2006-to-2016 Labour Force Survey (LFS). |
|||||||||||||||||||||||||
3.2 How do workers compare?
The population groups more likely to get lower quality jobs are youth and the less-educated (Table 3). While the literature has shown that these groups are often associated with low pay, their lower outcomes along many other job quality dimensions make them even more vulnerable. Workers with a high school diploma or lower, for instance, were more likely to work in jobs with less flexible work schedules, low autonomy, lack of training opportunities and employment benefits, in addition to low pay. They were also less likely to be recognized for their work efforts given the low access to performance evaluation: only 47% of less-educated workers reported having a formal job performance assessment over the last year, compared to nearly 70% of university-educated workers. Marked differences in nearly all job quality dimensions were evident across workers with higher and lower levels of educational attainment.
Table 3 also indicates that the concerns relating to the youth labour market pertain to more than just unemployment, as often emphasized. Younger workers were more likely to be in a job with irregular work schedules, without formal performance assessments, and with limited or no employment benefits. This may reflect the fact that fewer employed youth today were in full-time jobs (Morissette 2016). Nevertheless, young workers still did relatively well in terms of career prospects, workload burden, and access to informal training. Visible minorities generally faced no significant disadvantages in job quality compared to non-visible minorities.
Finally, Table 3 provides a new perspective to assess gender equality in the workplace. Female workers earned less (about $3.8 dollars, or 15%, less) than their male counterparts in hourly wages. This is consistent with the literature. Other noticeable disadvantages faced by female workers include higher incidence of workplace violence, poor career prospects, less working-time flexibility, and limited access to certain employment benefits (such as disability and supplemental medical insurance). However, the data show no significant gender gap in job features relating to employment security, work intensity, skills and discretion, managerial support, pension plan, paid leaves, and parental benefits.
| Percentage weighted | 1. Prospects | 2. Work intensity | 3. Working-time quality | 4. Skills and discretion | 5. Social environment | 6. Income and benefits | ||||||||||||||||||
|---|---|---|---|---|---|---|---|---|---|---|---|---|---|---|---|---|---|---|---|---|---|---|---|---|
| Might lose job in next six months | Job offers good advancement prospectsTable 3 Note 1 | Workload not often manageable | Often cannot finish work in regular hoursTable 3 Note 1 | Involuntary irregular schedule | Flexible start/end hoursTable 3 Note 1 | Can take time off for personal reasonsTable 3 Note 1 | Can decide sequence of tasks | Have opportunities to provide inputTable 3 Note 1 | Paid formal trainingTable 3 Note 1 | Informal trainingTable 3 Note 1 | Verbal abuse, sexual harassment, threats, humiliation, or physical violence | Support from managersTable 3 Note 1 | Had formal job performance evaluationTable 3 Note 1 | Have formal employee representation body | Workplace pension planTable 3 Note 1 | Paid sick leaveTable 3 Note 1 | Paid vacation leaveTable 3 Note 1 | Disability insuranceTable 3 Note 1 | Supplemental medical/dental careTable 3 Note 1 | Workers' compensationTable 3 Note 1 | Maternity, parental or layoff benefitsTable 3 Note 1 | Mean hourly earningsTable 3 Note 2 | ||
| percent | percent (mean) | dollars | ||||||||||||||||||||||
| Overall | 100.0 | 10.5 | 51.7 | 26.2 | 25.2 | 12.1 | 41.5 | 71.2 | 66.4 | 77.0 | 41.5 | 56.1 | 15.1 | 63.8 | 58.5 | 32.1 | 39.0 | 42.4 | 56.1 | 42.3 | 46.6 | 49.6 | 42.4 | 26.8 |
| percent | percent (deviation from mean) | dollars (deviation) | ||||||||||||||||||||||
| Sex | ||||||||||||||||||||||||
| Men | 52.9 | Average (within the average, not significant at 10% level)1.0 | Higher than average (between the 1% and 10% levels)2.5 | Average (within the average, not significant at 10% level)-1.2 | Average (within the average, not significant at 10% level)-1.0 | Average (within the average, not significant at 10% level)-0.3 | Average (within the average, not significant at 10% level)1.4 | Higher than average (between the 1% and 10% levels)2.4 | Average (within the average, not significant at 10% level)-1.0 | Higher than average (between the 1% and 10% levels)1.5 | Average (within the average, not significant at 10% level)1.5 | Average (within the average, not significant at 10% level)-0.6 | Much higher than average (at 1% level)-2.7 | Higher than average (between the 1% and 10% levels)2.1 | Average (within the average, not significant at 10% level)-0.6 | Lower than average (between the 1% and 10% levels)-2.2 | Average (within the average, not significant at 10% level)1.5 | Average (within the average, not significant at 10% level)-0.4 | Higher than average (between the 1% and 10% levels)1.8 | Much higher than average (at 1% level)3.1 | Much higher than average (at 1% level)3.5 | Much higher than average (at 1% level)3.9 | Average (within the average, not significant at 10% level)0.2 | Much higher than average (at 1% level)1.9 |
| Women | 47.1 | Higher than average (between the 1% and 10% levels)-1.2 | Much lower than average (at 1% level)-2.7 | Average (within the average, not significant at 10% level)1.3 | Average (within the average, not significant at 10% level)1.1 | Average (within the average, not significant at 10% level)0.3 | Average (within the average, not significant at 10% level)-1.5 | Much lower than average (at 1% level)-2.6 | Average (within the average, not significant at 10% level)1.2 | Lower than average (between the 1% and 10% levels)-1.7 | Average (within the average, not significant at 10% level)-1.6 | Average (within the average, not significant at 10% level)0.7 | Much lower than average (at 1% level)3.1 | Lower than average (between the 1% and 10% levels)-2.3 | Average (within the average, not significant at 10% level)0.6 | Higher than average (between the 1% and 10% levels)2.3 | Lower than average (between the 1% and 10% levels)-1.7 | Average (within the average, not significant at 10% level)0.4 | Lower than average (between the 1% and 10% levels)-1.9 | Much lower than average (at 1% level)-3.4 | Much lower than average (at 1% level)-3.8 | Much lower than average (at 1% level)-4.3 | Average (within the average, not significant at 10% level)-0.3 | Much lower than average (at 1% level)-1.9 |
| Age group | ||||||||||||||||||||||||
| 18 to 29 | 22.5 | Average (within the average, not significant at 10% level)1.4 | Much higher than average (at 1% level)5.6 | Much higher than average (at 1% level)-4.0 | Much higher than average (at 1% level)-7.7 | Much lower than average (at 1% level)6.3 | Lower than average (between the 1% and 10% levels)-3.2 | Much lower than average (at 1% level)-7.0 | Much lower than average (at 1% level)-6.2 | Average (within the average, not significant at 10% level)-1.5 | Average (within the average, not significant at 10% level)0.9 | Much higher than average (at 1% level)5.7 | Much lower than average (at 1% level)2.2 | Average (within the average, not significant at 10% level)2.0 | Much lower than average (at 1% level)-17.0 | Much lower than average (at 1% level)-8.8 | Much lower than average (at 1% level)-7.9 | Much lower than average (at 1% level)-7.2 | Average (within the average, not significant at 10% level)-2.8 | Much lower than average (at 1% level)-10.5 | Much lower than average (at 1% level)-9.2 | Lower than average (between the 1% and 10% levels)-4.0 | Much lower than average (at 1% level)-6.0 | Much lower than average (at 1% level)-6.0 |
| 30 to 44 | 33.6 | Average (within the average, not significant at 10% level)-0.5 | Much higher than average (at 1% level)3.4 | Lower than average (between the 1% and 10% levels)2.4 | Much lower than average (at 1% level)3.5 | Average (within the average, not significant at 10% level)-0.8 | Average (within the average, not significant at 10% level)1.3 | Average (within the average, not significant at 10% level)0.8 | Average (within the average, not significant at 10% level)0.8 | Higher than average (between the 1% and 10% levels)2.4 | Much higher than average (at 1% level)3.4 | Average (within the average, not significant at 10% level)1.7 | Much lower than average (at 1% level)1.5 | Average (within the average, not significant at 10% level)-0.2 | Much higher than average (at 1% level)5.6 | Average (within the average, not significant at 10% level)1.2 | Higher than average (between the 1% and 10% levels)2.9 | Much higher than average (at 1% level)3.4 | Higher than average (between the 1% and 10% levels)1.9 | Much higher than average (at 1% level)4.6 | Much higher than average (at 1% level)4.7 | Average (within the average, not significant at 10% level)1.3 | Much higher than average (at 1% level)4.7 | Much higher than average (at 1% level)1.8 |
| 45 to 59 | 33.9 | Average (within the average, not significant at 10% level)-0.6 | Much lower than average (at 1% level)-5.1 | Lower than average (between the 1% and 10% levels)2.2 | Lower than average (between the 1% and 10% levels)2.6 | Much higher than average (at 1% level)-2.3 | Average (within the average, not significant at 10% level)0.9 | Much higher than average (at 1% level)2.9 | Higher than average (between the 1% and 10% levels)2.0 | Average (within the average, not significant at 10% level)-1.5 | Average (within the average, not significant at 10% level)-1.6 | Lower than average (between the 1% and 10% levels)-3.0 | Higher than average (between the 1% and 10% levels)-1.2 | Average (within the average, not significant at 10% level)-0.7 | Much higher than average (at 1% level)6.5 | Much higher than average (at 1% level)5.1 | Much higher than average (at 1% level)3.3 | Higher than average (between the 1% and 10% levels)2.3 | Average (within the average, not significant at 10% level)0.1 | Much higher than average (at 1% level)3.9 | Higher than average (between the 1% and 10% levels)2.6 | Average (within the average, not significant at 10% level)1.4 | Average (within the average, not significant at 10% level)1.0 | Much higher than average (at 1% level)2.0 |
| 60 or older | 10.1 | Average (within the average, not significant at 10% level)0.6 | Much lower than average (at 1% level)-10.8 | Much higher than average (at 1% level)-7.0 | Higher than average (between the 1% and 10% levels)-2.8 | Much higher than average (at 1% level)-3.5 | Average (within the average, not significant at 10% level)0.5 | Much higher than average (at 1% level)5.6 | Much higher than average (at 1% level)4.3 | Average (within the average, not significant at 10% level)0.3 | Much lower than average (at 1% level)-10.8 | Much lower than average (at 1% level)-12.6 | Much higher than average (at 1% level)-6.1 | Average (within the average, not significant at 10% level)-2.3 | Average (within the average, not significant at 10% level)0.9 | Average (within the average, not significant at 10% level)0.8 | Average (within the average, not significant at 10% level)-2.4 | Average (within the average, not significant at 10% level)-2.4 | Average (within the average, not significant at 10% level)0.0 | Lower than average (between the 1% and 10% levels)-4.1 | Average (within the average, not significant at 10% level)-3.2 | Average (within the average, not significant at 10% level)0.6 | Much lower than average (at 1% level)-6.5 | Much lower than average (at 1% level)-0.7 |
| Education | ||||||||||||||||||||||||
| High school or less | 29.8 | Average (within the average, not significant at 10% level)0.3 | Average (within the average, not significant at 10% level)-1.2 | Much higher than average (at 1% level)-3.1 | Much higher than average (at 1% level)-6.7 | Much lower than average (at 1% level)2.7 | Much lower than average (at 1% level)-5.3 | Lower than average (between the 1% and 10% levels)-2.8 | Much lower than average (at 1% level)-4.1 | Much lower than average (at 1% level)-3.4 | Much lower than average (at 1% level)-7.0 | Much lower than average (at 1% level)-7.2 | Much higher than average (at 1% level)-2.3 | Higher than average (between the 1% and 10% levels)2.9 | Much lower than average (at 1% level)-11.5 | Much lower than average (at 1% level)-6.6 | Much lower than average (at 1% level)-5.6 | Much lower than average (at 1% level)-9.0 | Average (within the average, not significant at 10% level)-1.9 | Much lower than average (at 1% level)-5.7 | Much lower than average (at 1% level)-5.7 | Average (within the average, not significant at 10% level)0.9 | Much lower than average (at 1% level)-5.3 | Much lower than average (at 1% level)-5.8 |
| Some postsecondary education | 36.2 | Average (within the average, not significant at 10% level)0.2 | Average (within the average, not significant at 10% level)-1.3 | Average (within the average, not significant at 10% level)-0.1 | Much higher than average (at 1% level)-2.9 | Average (within the average, not significant at 10% level)1.0 | Much lower than average (at 1% level)-4.7 | Average (within the average, not significant at 10% level)-0.2 | Average (within the average, not significant at 10% level)-1.5 | Average (within the average, not significant at 10% level)-0.2 | Average (within the average, not significant at 10% level)0.7 | Lower than average (between the 1% and 10% levels)-2.7 | Average (within the average, not significant at 10% level)0.4 | Lower than average (between the 1% and 10% levels)-2.2 | Average (within the average, not significant at 10% level)0.5 | Higher than average (between the 1% and 10% levels)2.3 | Higher than average (between the 1% and 10% levels)2.2 | Higher than average (between the 1% and 10% levels)2.6 | Much higher than average (at 1% level)5.1 | Much higher than average (at 1% level)3.3 | Much higher than average (at 1% level)3.8 | Much higher than average (at 1% level)4.0 | Much higher than average (at 1% level)3.4 | Much lower than average (at 1% level)-1.4 |
| University degree | 33.9 | Average (within the average, not significant at 10% level)-0.6 | Higher than average (between the 1% and 10% levels)2.4 | Much lower than average (at 1% level)2.8 | Much lower than average (at 1% level)9.2 | Much higher than average (at 1% level)-3.5 | Much higher than average (at 1% level)9.8 | Higher than average (between the 1% and 10% levels)2.6 | Much higher than average (at 1% level)5.0 | Much higher than average (at 1% level)2.9 | Much higher than average (at 1% level)5.4 | Much higher than average (at 1% level)9.5 | Lower than average (between the 1% and 10% levels)1.6 | Average (within the average, not significant at 10% level)-0.5 | Much higher than average (at 1% level)9.7 | Much higher than average (at 1% level)3.6 | Higher than average (between the 1% and 10% levels)2.3 | Much higher than average (at 1% level)4.5 | Much lower than average (at 1% level)-4.2 | Average (within the average, not significant at 10% level)1.1 | Average (within the average, not significant at 10% level)0.6 | Much lower than average (at 1% level)-5.3 | Average (within the average, not significant at 10% level)0.9 | Much higher than average (at 1% level)6.7 |
| Visible minority | ||||||||||||||||||||||||
| Yes | 21.9 | Average (within the average, not significant at 10% level)-0.0 | Much higher than average (at 1% level)7.3 | Average (within the average, not significant at 10% level)0.0 | Higher than average (between the 1% and 10% levels)-3.4 | Lower than average (between the 1% and 10% levels)2.0 | Much higher than average (at 1% level)5.2 | Average (within the average, not significant at 10% level)-2.0 | Average (within the average, not significant at 10% level)-0.3 | Average (within the average, not significant at 10% level)-0.5 | Average (within the average, not significant at 10% level)-2.8 | Lower than average (between the 1% and 10% levels)-3.6 | Average (within the average, not significant at 10% level)-1.4 | Average (within the average, not significant at 10% level)-1.3 | Average (within the average, not significant at 10% level)-1.5 | Much lower than average (at 1% level)-4.3 | Average (within the average, not significant at 10% level)-1.3 | Average (within the average, not significant at 10% level)0.9 | Average (within the average, not significant at 10% level)-0.7 | Lower than average (between the 1% and 10% levels)-4.3 | Average (within the average, not significant at 10% level)-1.2 | Much lower than average (at 1% level)-6.1 | Average (within the average, not significant at 10% level)-2.6 | Note ...: not applicable |
| No | 78.1 | Average (within the average, not significant at 10% level)-0.1 | Much lower than average (at 1% level)-2.2 | Average (within the average, not significant at 10% level)-0.1 | Average (within the average, not significant at 10% level)0.9 | Average (within the average, not significant at 10% level)-0.6 | Lower than average (between the 1% and 10% levels)-1.5 | Average (within the average, not significant at 10% level)0.5 | Average (within the average, not significant at 10% level)0.2 | Average (within the average, not significant at 10% level)0.1 | Average (within the average, not significant at 10% level)0.9 | Average (within the average, not significant at 10% level)1.1 | Average (within the average, not significant at 10% level)0.4 | Average (within the average, not significant at 10% level)0.5 | Average (within the average, not significant at 10% level)0.4 | Higher than average (between the 1% and 10% levels)1.3 | Average (within the average, not significant at 10% level)0.7 | Average (within the average, not significant at 10% level)-0.1 | Average (within the average, not significant at 10% level)0.5 | Higher than average (between the 1% and 10% levels)1.4 | Average (within the average, not significant at 10% level)0.6 | Much higher than average (at 1% level)2.0 | Average (within the average, not significant at 10% level)0.9 | Note ...: not applicable |
|
Job quality indicator (significance level of difference between group mean and overall mean) Much higher than average (at 1% level) Higher than average (between the 1% and 10% levels) Average (within the average, not significant at 10% level) Lower than average (between the 1% and 10% levels) Much lower than average (at 1% level)
Sources: Statistics Canada, 2016 General Social Survey and 2006-to-2016 Labour Force Survey. |
||||||||||||||||||||||||
4 Identifying groups of workers with similar-quality jobs: A latent class analysis
This section turns to regression analysis to identify which workers are more likely to have jobs associated with multiple good or bad job features. Specifically, the study applied a technique known as latent class analysis (LCA) to cluster workers into a limited number of similar classes according to their responses to job quality indicators. The extent to which observed characteristics affect the probability of membership in each job class were also examined.
LCA, or finite mixture modelling, is a statistical procedure for identifying unmeasured class membership probabilities among subjects, using their responses to a set of observed variables (Vermunt and Magidson 2002).Note In the context of this study, observed variables are the six job quality dimensions where each dimension contains a number of the indicators mentioned above. For simplicity, a categorical variable with three responses was created for each of the job quality dimensions where the item response was coded as “1” if workers experienced none or very few good job quality features with respect to the dimension in question, coded as “2” if they experienced partial good-job features, and coded as “3” if they experienced all or most good-job features.Note
Table 4 shows the distribution of six job quality dimensions. The sample was restricted to individuals who provided valid responses to all job quality questions in the GSS. This excluded all self-employed workers. About 8,000 workers were included in the analysis. Overall, 80% to 90% of workers reported having at least partial good-job features (categories 2 or 3) in five of the six job quality dimensions. The only exception is benefits, where 43% of the sample indicated that their jobs provided none or only one of the seven employment benefits included (category 1). The other stand-out dimension is work intensity, where more than 88% of workers reported being in the best category (i.e., their jobs were not associated with the two negative indicators listed).
| Distribution of job quality features (three item response categories) for each dimension | ||||||
|---|---|---|---|---|---|---|
| 1. Prospects | 2. Work intensity | 3. Working-time quality | 4. Skills and discretion | 5. Social environment | 6. Income and benefits | |
| number | ||||||
| Number of indicators used within the dimension | 2 | 2 | 3 | 4 | 4 | 7 |
| percent | ||||||
| Item response category (description) | ||||||
| 1 (No or very few good-job quality features) | 5.9 | 3.1 | 8.4 | 19.8 | 14.3 | 43.4 |
| 2 (Some good-job quality features) | 47.6 | 8.7 | 60.3 | 32.0 | 37.7 | 22.2 |
| 3 (All or most good-job quality features) | 46.6 | 88.3 | 31.3 | 48.3 | 48.1 | 34.4 |
| Total | 100.0 | 100.0 | 100.0 | 100.0 | 100.0 | 100.0 |
|
Notes: Sample was restricted to workers aged 18 and older with valid answers to all job quality questions in the General Social Survey. For dimensions 1 and 2, categories 1, 2 and 3 refer to having zero, one, and two good features, respectively. For dimension 3, categories 1, 2 and 3 refer to having zero, one or two, and three good features, respectively. For dimensions 4 and 5, categories 1, 2 and 3 refer to having zero or one, two, and three or four good features, respectively. For dimension 6, categories 1, 2 and 3 refer to having zero or one, two to five, and six or seven good features, respectively. Percentages may not add up to 100.0% because of rounding. The number of observations is 8,004. Source: Statistics Canada, 2016 General Social Survey. |
||||||
Using these categorical variables, which indicate whether workers experienced none, partial or all good job quality features in each of the six job quality dimensions, a latent class model with unobserved job quality profiles can be estimated with or without the inclusion of covariates. The model is fitted using a STATA plugin developed by Lanza et al. (2015). When no covariates are included, two sets of parameters are estimated: (1) probabilities of latent class membership, and (2) item-response probabilities that express the correspondence between the observed six job quality dimensions and the latent classes. When covariates are included, the probabilities of latent class membership are predicted as functions of regression coefficients for covariates and the values of the covariates (Lanza et al. 2015).
The optimal number of latent classes, , can be determined by selecting the model that results in the lowest Bayesian Information Criterion (BIC) statistic. Appendix Table 1 fits a baseline model with each additional class up to the six-class model. An inspection of the BIC values indicates that the four-class model is optimal, as the addition of classes beyond four results in no improvement. Upon selecting the number of latent classes, the study fits a four-class model with a set of covariates, including sex, age, education, visible minority status, full-time/part-time employment status, contract type, firm size, industry, occupation, and region. Table 5 reports the estimated class membership probabilities (top panel) as well as the item response probabilities of the six job quality dimensions (bottom panel) for each class. Coefficient estimates for covariates are shown in Appendix Table 2.
Four very distinct job quality profiles were identified from the LCA. About 30% of workers were predicted to be in the best job quality group (class 1), judging by the probabilities of having many or all good job features in all six quality dimensions. Conversely, 26% of workers were expected to be in the worst job quality group (class 4), with very low probabilities of experiencing many good job features in most dimensions. The remaining two classes were considered having fair- to good-quality jobs but still differed substantially from each other in some aspects. Workers in class 2 (27%) in general enjoyed many good job features, but tended to have poor or moderate working-time quality. The probability of having a positive response to all three indicators in working-time dimension is zero, indicating a lack of work–life balance for this class. Finally, the remaining 17% (class 3) did well in two dimensions (prospects and work intensity) but not as well in the other four dimensions, particularly social environment and benefits. No workers in this class had jobs that offer six or all seven employment benefits listed.
| Job quality profiles | ||||
|---|---|---|---|---|
| High overall quality jobs | Good quality jobs, poor working-time quality | Fair quality jobs, poor job resources and benefits |
Poor overall quality jobs | |
| Latent class 1 | Latent class 2 | Latent class 3 | Latent class 4 | |
| Class membership | ||||
| Mean class membership probabilities | 0.304 | 0.267 | 0.165 | 0.264 |
| Standard error | 0.003 | 0.003 | 0.003 | 0.003 |
| Item response probabilities | ||||
| Item 1: Probabilities of having no/few good-job quality features | ||||
| Prospects | 0.035 | 0.007 | 0.021 | 0.165 |
| Work intensity | 0.033 | 0.030 | 0.000 | 0.045 |
| Working-time quality | 0.000 | 0.156 | 0.031 | 0.140 |
| Skills and discretion | 0.054 | 0.145 | 0.072 | 0.494 |
| Social environment | 0.049 | 0.024 | 0.122 | 0.383 |
| Income and benefits | 0.416 | 0.301 | 0.317 | 0.660 |
| Item 2: Probabilities of having partial good-job quality features | ||||
| Prospects | 0.361 | 0.427 | 0.396 | 0.699 |
| Work intensity | 0.093 | 0.110 | 0.011 | 0.109 |
| Working-time quality | 0.244 | 0.844 | 0.638 | 0.723 |
| Skills and discretion | 0.252 | 0.299 | 0.475 | 0.322 |
| Social environment | 0.277 | 0.248 | 0.594 | 0.473 |
| Income and benefits | 0.071 | 0.087 | 0.683 | 0.227 |
| Item 3: Probabilities of having many/all good-job quality features | ||||
| Prospects | 0.604 | 0.565 | 0.583 | 0.136 |
| Work intensity | 0.875 | 0.861 | 0.989 | 0.846 |
| Working-time quality | 0.756 | 0.000 | 0.332 | 0.137 |
| Skills and discretion | 0.694 | 0.555 | 0.453 | 0.185 |
| Social environment | 0.673 | 0.728 | 0.284 | 0.144 |
| Income and benefits | 0.513 | 0.612 | 0.000 | 0.112 |
|
Notes: Sample was restricted to workers aged 18 and older with valid answers to all job quality questions in the General Social Survey. Sample includes 7,749 respondents. Section 4 enumerates the covariates included in the model. Source: Statistics Canada, 2016 General Social Survey. |
||||
4.1 Predictions of latent classes by characteristic
The impact of covariates on latent class membership can be assessed through the estimated coefficients (Appendix Table 2). For example, the coefficient on part-time variable in class 1 is -0.660 (or 0.517 in odds ratio). It reflects the decrease in the probability of belonging to class 1 (relative to reference class 3) by about 50% when status changes from full-time to part-time, holding all other covariates constant. Table 6 presents the predicted probabilities of being in each latent class across levels or values of each covariate, holding all other variables in the model at their means.
Youth, the less-educated and those in blue-collar occupations were underrepresented in the best job quality group. This is consistent with the broad patterns in Section 3. For instance, only about 25% of workers with a high school diploma were predicted to be in class 1, while this was the case for 35% of university graduates, all else being equal. However, young or low-educated workers were not more likely than their counterparts to be in the worst job class. Nevertheless, they were overrepresented in jobs that offered fewer benefits and average social environment (class 3). There exists a great deal of variation in job quality profiles across sectors. About 40% of workers in the public administration and financial service sectors were clustered into higher quality jobs, while one-third or more of workers in hospitality, manufacturing and trade were associated with the worst job quality class, all else being equal. Interestingly, polarization in job quality is evident in some sectors, particularly in hospitality, where one-third of jobs belonged to the best class and a similar proportion fell into the worst job class.
Table 6 also reveals that contract type, part-time/full-time status and firm size are strong predictors of job quality classes. Concerning the effects of employment contract on job quality, there has been much debate about whether the growing volume of non-standard contract jobs are associated with “precarious” work (Galarneau 2010; OECD 2015a, 2015b). Table 6 clearly indicates that workers in atypical forms of employment—which include seasonal, fixed-term and causal workers—were associated with many disadvantageous job features in addition to lower pay and lower job security. The probability of falling into the worst job quality class was as high as 45% for atypical contract workers, compared to 27% for regular contract holders, all else being equal. At the same time, the vulnerability of atypical workers is further reinforced by their limited representation in the best class (23%) versus regular contract workers (31%).
The other noteworthy contrast in job quality is along the line of hours of work. Part-time workers were much more (less) likely than their full-time counterparts to be in poor (good) job categories. The findings add to the part-time penalty literature, which has focused primarily on hourly wages (O’Dorchai, Plasman and Rycx 2007; Bardasi and Gornick 2008; OECD 2015a, 2015b), by suggesting that part-time penalty can also be reflected in a wider range of job quality indicators, including prospects, working-time quality, skills and social environment. This remains evident even after controlling for other observable characteristics.
Marked differences are also seen for firm size—the number of employees at a workplace is positively associated with job quality. Among workers in large firms (with 100 or more employees), about 70% were predicted to be in the best- or good-quality classes and only 23% predicted to be in the worst-job class. The comparable figures for workers in small firms with fewer than 20 employees were 40% in the best- or good-quality class and 33% in the worst-job class, net of other influences. Not surprisingly, small-firm workers were overrepresented in jobs that offer fewer employment benefits and a less desirable social environment, such as jobs with no collective representation (class 3). This suggests that the demand size factor also plays a role in shaping the distributions of job quality profiles.
| Covariates | Job quality profiles | |||
|---|---|---|---|---|
| High overall quality jobs | Good quality jobs, poor working-time quality | Fair quality jobs, poor job resources and benefits | Poor overall quality jobs | |
| Class 1 | Class 2 | Class 3 | Class 4 | |
| probability | ||||
| Reference person (at means) | 0.302 | 0.272 | 0.141 | 0.285 |
| Men | 0.316 | 0.268 | 0.144 | 0.272 |
| Women | 0.287 | 0.276 | 0.138 | 0.299 |
| Ages 18 to 29 | 0.254 | 0.263 | 0.198 | 0.285 |
| Ages 30 to 44 | 0.303 | 0.284 | 0.149 | 0.264 |
| Ages 45 to 59 | 0.325 | 0.270 | 0.105 | 0.299 |
| Ages 60 and older | 0.340 | 0.236 | 0.121 | 0.304 |
| High school | 0.254 | 0.302 | 0.175 | 0.269 |
| Some postsecondary education | 0.296 | 0.287 | 0.138 | 0.278 |
| University degree | 0.351 | 0.230 | 0.118 | 0.302 |
| Canadian-born | 0.301 | 0.276 | 0.134 | 0.289 |
| Immigrant | 0.306 | 0.256 | 0.168 | 0.270 |
| Full-time | 0.320 | 0.285 | 0.130 | 0.265 |
| Part-time (less than 30 hours/week) | 0.234 | 0.219 | 0.185 | 0.362 |
| Regular contract | 0.311 | 0.284 | 0.141 | 0.265 |
| Atypical contract | 0.228 | 0.188 | 0.132 | 0.452 |
| Firm size of fewer than 20 employees | 0.231 | 0.175 | 0.261 | 0.333 |
| Firm size of 20 to 99 employees | 0.269 | 0.276 | 0.171 | 0.284 |
| Firm size of 100 to 500 employees | 0.357 | 0.329 | 0.075 | 0.239 |
| Firm size of 500 employees or more | 0.368 | 0.335 | 0.068 | 0.228 |
| Public | 0.427 | 0.358 | 0.047 | 0.168 |
| Primary | 0.343 | 0.265 | 0.118 | 0.273 |
| Finance/professional | 0.403 | 0.211 | 0.130 | 0.255 |
| Education | 0.165 | 0.585 | 0.102 | 0.147 |
| Trades/transportation | 0.266 | 0.259 | 0.141 | 0.334 |
| Construction | 0.280 | 0.170 | 0.264 | 0.286 |
| Health care | 0.206 | 0.418 | 0.134 | 0.242 |
| Manufacturing | 0.291 | 0.176 | 0.186 | 0.347 |
| Hospitality | 0.308 | 0.159 | 0.167 | 0.366 |
| Professionals | 0.455 | 0.217 | 0.112 | 0.215 |
| Clerks | 0.345 | 0.216 | 0.148 | 0.291 |
| Technicians | 0.250 | 0.343 | 0.132 | 0.275 |
| Managers | 0.477 | 0.131 | 0.157 | 0.235 |
| Operators | 0.163 | 0.380 | 0.160 | 0.297 |
| Elementary | 0.146 | 0.412 | 0.102 | 0.340 |
| Sales | 0.323 | 0.234 | 0.134 | 0.309 |
| Personal services | 0.221 | 0.311 | 0.152 | 0.316 |
| Atlantic | 0.246 | 0.344 | 0.148 | 0.262 |
| Quebec | 0.311 | 0.228 | 0.166 | 0.295 |
| Ontario | 0.284 | 0.276 | 0.127 | 0.314 |
| Prairies | 0.341 | 0.284 | 0.141 | 0.234 |
| British Columbia | 0.310 | 0.283 | 0.138 | 0.269 |
|
Note: Predicted class probabilities for a given level of a covariate were calculated based on estimated coefficients in Appendix Table 2, holding all other covariates at means. Source: Statistics Canada, 2016 General Social Survey. |
||||
4.2 Job quality profiles for groups at risk of non-standard employment
Table 6 has identified non-standard work (NSW) arrangements (i.e., part-time and atypical contract) as strong predictors of job quality classes. For some groups (women, youth, seniors and the less-educated in particular), the chances of working part-time or having atypical jobs were higher than for the other groups. This was either by choice or as a result of a lack of access to standard employment. This subsection examines the predicted job quality profiles for these groups. This is assessed by incorporating the interaction effects in the LCA.
Job quality profiles among frequent part-timers
In 2016, about one-third of young Canadian workers were in part-time jobs, while this was the case for one-tenth of prime-age workers. High rates of part-time work were also observed among seniors (31%), women (26%) and the less-educated (25%).Note Chart 1 presents the predicted job quality profiles for these groups. Overall, their risks of falling into the poorer job quality classes were notably high: about 38% for women and for 18-to-29-year-olds, and 34% for seniors and the less-educated. These are 10 to 15 percentage points higher than the rates for their respective counterparts in full-time jobs, all else being equal. Meanwhile, their chances of being in the best or good job classes were somewhat limited. Women (youth) in part-time employment, for example, were less likely than their full-time male (prime age) counterparts to be in the best job class, by 12 (14) percentage points, net of all other influences.
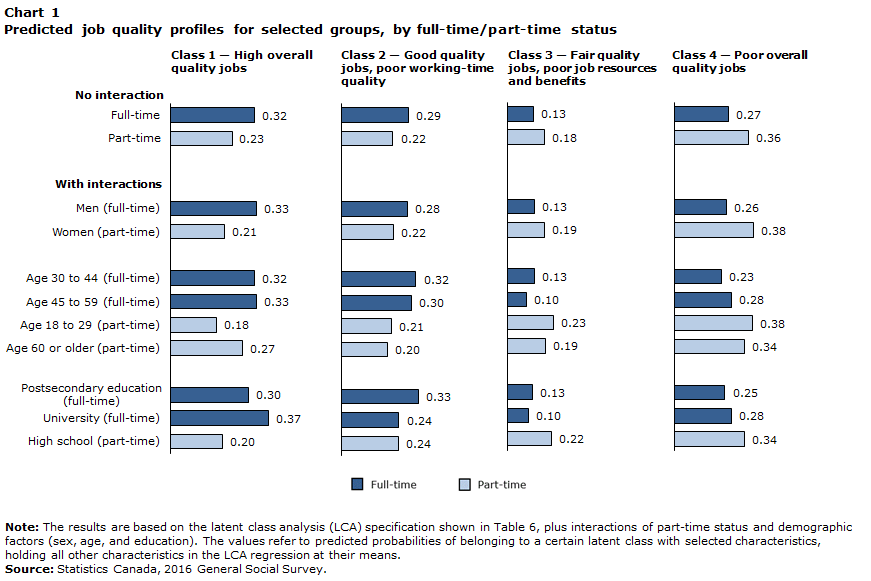
Data table for Chart 1
| High overall quality jobs | Good quality jobs, poor working-time quality | Fair quality jobs, poor job resources and benefits | Poor overall quality jobs | |
|---|---|---|---|---|
| Class 1 | Class 2 | Class 3 | Class 4 | |
| probability | ||||
| No interaction | ||||
| Full-time | 0.32 | 0.29 | 0.13 | 0.27 |
| Part-time | 0.23 | 0.22 | 0.18 | 0.36 |
| With interactions | ||||
| Men (full-time) | 0.33 | 0.28 | 0.13 | 0.26 |
| Women (part-time) | 0.21 | 0.22 | 0.19 | 0.38 |
| Age 30 to 44 (full-time) | 0.32 | 0.32 | 0.13 | 0.23 |
| Age 45 to 59 (full-time) | 0.33 | 0.30 | 0.10 | 0.28 |
| Age 18 to 29 (part-time) | 0.18 | 0.21 | 0.23 | 0.38 |
| Age 60 or older (part-time) | 0.27 | 0.20 | 0.19 | 0.34 |
| Postsecondary education (full-time) | 0.30 | 0.33 | 0.13 | 0.25 |
| University (full-time) | 0.37 | 0.24 | 0.10 | 0.28 |
| High school (part-time) | 0.20 | 0.24 | 0.22 | 0.34 |
|
Note: The results are based on the latent class analysis (LCA) specification shown in Table 6, plus interactions of part-time status and demographic factors (sex, age, and education). The values refer to predicted probabilities of belonging to a certain latent class with selected characteristics, holding all other characteristics in the LCA regression at their means. Source: Statistics Canada, 2016 General Social Survey. |
||||
Job quality profiles among frequent atypical contract workers
Literature has also shown that some groups (youth and the less-educated in particular) as well as workers in small firms were more likely to be in jobs with NSW arrangements (Kapsalis and Tourigny 2004; Galarneau 2010; OECD 2015a, 2015b). As with part-time employment, LCA in Chart 2 shows that young (less-educated) workers in atypical forms of employment faced a significantly higher probability of falling into the worst job quality class than their prime-age (better-educated) counterparts in regular contract jobs—by about 20 (14) percentage points, all else being equal.
Chart 2 also reveals a strong interaction effect between part-time and atypical contracts. Striking differences in job quality profiles are evident between full-time regular and part-time atypical contract job holders. With all other factors being held constant, the study found that about half of part-time workers in atypical contracts have a poor-quality job and only 17% were predicted to be in the best-job class, while 24% of full-time workers in regular contracts had a poor-quality job and 33% of members of this group were found to be in the best-job class. This raises concerns for job quality among part-timers since they are more likely than their full-time counterparts to be in atypical contracts (OECD 2015a, 2015b).
Moreover, the incidence of non-standard employment also tends to be higher in small firms. This is because atypical contracts are often less costly and more flexible for small firms to cope with fluctuations in demand (Bentolila and Saint-Paul 1994), or are used as a screening process (Portugal and Varejao 2009). In Canada, about one in three non-standard workers worked in companies with fewer than 20 employees, whereas one in five standard workers did so (Kapsalis and Tourigny 2004).
Chart 2 shows a stark contrast in job quality profiles between atypical contract workers in small firms (less than 20 employees) and regular contract workers in larger firms. All non-standard workers in small firms faced a very high risk (around 56 percent) of poor job quality outcome and a very low probability (around 16 percent) of belonging to the best job class, when other observable characteristics were held at their means. This may not be too surprising since small enterprises often lack many of the job features (e.g., unionization, benefit provision, training or prospects) analyzed. Consequently, the growth of non-standard employment and its concentration in small firms would have profound implications for shaping the distribution of job quality in future workplaces.
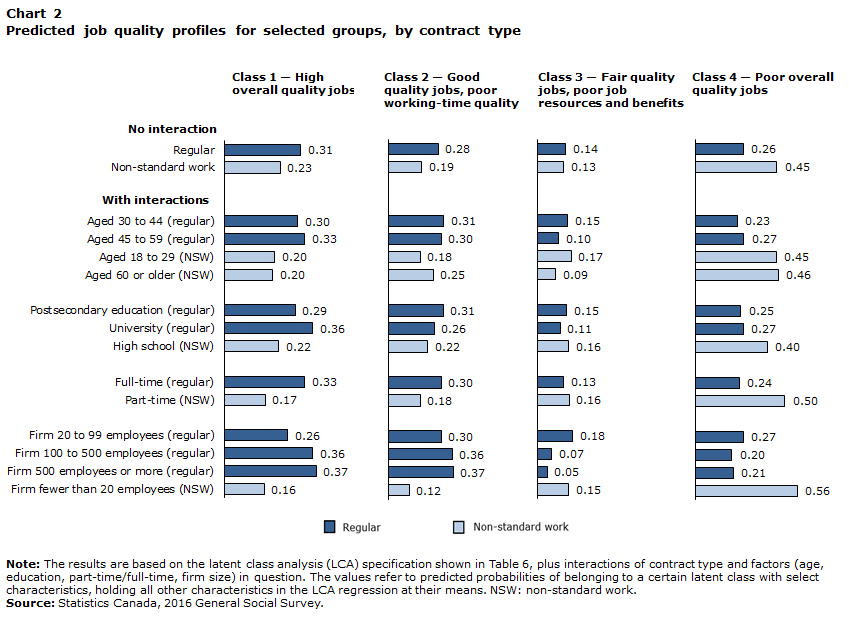
Data table for Chart 2
| High overall quality jobs | Good quality jobs, poor working-time quality | Fair quality jobs, poor job resources and benefits | Poor overall quality jobs | |
|---|---|---|---|---|
| Class 1 | Class 2 | Class 3 | Class 4 | |
| probability | ||||
| No interaction | ||||
| Regular | 0.31 | 0.28 | 0.14 | 0.26 |
| Non-standard work | 0.23 | 0.19 | 0.13 | 0.45 |
| With interactions | ||||
| Aged 30 to 44 (regular) | 0.30 | 0.31 | 0.15 | 0.23 |
| Aged 45 to 59 (regular) | 0.33 | 0.30 | 0.10 | 0.27 |
| Aged 18 to 29 (NSW) | 0.20 | 0.18 | 0.17 | 0.45 |
| Aged 60 or older (NSW) | 0.20 | 0.25 | 0.09 | 0.46 |
| Postsecondary education (regular) | 0.29 | 0.31 | 0.15 | 0.25 |
| University (regular) | 0.36 | 0.26 | 0.11 | 0.27 |
| High school (NSW) | 0.22 | 0.22 | 0.16 | 0.40 |
| Full-time (regular) | 0.33 | 0.30 | 0.13 | 0.24 |
| Part-time (NSW) | 0.17 | 0.18 | 0.16 | 0.50 |
| Firm 20 to 99 employees (regular) | 0.26 | 0.30 | 0.18 | 0.27 |
| Firm 100 to 500 employees (regular) | 0.36 | 0.36 | 0.07 | 0.20 |
| Firm 500 employees or more (regular) | 0.37 | 0.37 | 0.05 | 0.21 |
| Firm fewer than 20 employees (NSW) | 0.16 | 0.12 | 0.15 | 0.56 |
|
Note: The results are based on the latent class analysis (LCA) specification shown in Table 6, plus interactions of contract type and factors (age, education, part-time/full-time, firm size) in question. The values refer to predicted probabilities of belonging to a certain latent class with select characteristics, holding all other characteristics in the LCA regression at their means. NSW: non-standard work. Source: Statistics Canada, 2016 General Social Survey. |
||||
4.3 Sensitivity analysis: the role of occupational and sectoral imbalances
While Subsection 4.2 highlights stark contrasts in predicted job quality profiles between frequent regular workers and frequent atypical job holders, this was done by holding all other covariates at their means, including types of industry and occupation. The results, however, understate the effects caused by occupational or sectoral imbalances. Women, for instance, may self-select into service-related jobs where they could work part-time (or casual) and also tend to family responsibilities. They are also less likely than men to be in managerial positions (Adams and Kirchmaier 2016). Meanwhile, highly educated workers may self-select into professional occupations where full-time positions (or regular contracts) are more common.
To allow for differences in job quality analysis that reflect such imbalances, Chart 3 offers alternative estimates based on a LCA specification without including industry and occupation as covariates. A few interesting patterns emerged. First, differences in job quality profiles between frequent regular workers and frequent atypical job holders widened when the model excluded industrial and occupational dummies from the analysis. This can be seen by marked increases in the predicted probabilities of belonging to the best job class for frequent regular workers (about 10 to 20 percentage points, compared with the estimates under full controls). At the same time, the predicted outlooks become less optimistic for frequent atypical job holders where their likelihoods of belonging to the worst job class increased by 5 to 10 points.
Second, while Chart 3 suggests that full-time and regular contracts were often used by industries or professions that entail many good job features, there was no compelling evidence that NSW arrangements were overrepresented in poor job quality sectors or occupations. The predicted probabilities of job quality profiles for part-time or atypical contract holders look roughly similar between the model with full covariates and the one with partial controls.
Third, selection into certain industries or occupations is evident for some groups. Among women in part-time employment, for example, their predicted probability of being in the high overall job quality group increased by 5 percentage points (to 26%) when the model allows for differences in job quality across sectors and occupations. This may reflect the fact that women are overrepresented in sectors (e.g., public administration) or occupations (e.g., office-based jobs) that are often associated with good job features. For young workers in non-standard employment arrangements, the results show that they were concentrated in sectors or occupations that offered poor or limited job quality features: more than 76% of young part-time workers were predicted to be either in the worst job class or in jobs with poor social environment and limited employment benefits under the specification of partial controls, compared with 62% when both industry and occupation were held constant.
The sensitively analysis suggests that sectoral and occupational patterns of workplace features do play a significant role in reshaping the predicted probability levels of job quality profiles for different groups, but ‘who’s better/worse off’ has largely remained intact.

Data table for Chart 3
| High overall quality jobs | Good quality jobs, poor working-time quality | Fair quality jobs, poor job resources and benefits | Poor overall quality jobs | |
|---|---|---|---|---|
| Class 1 | Class 2 | Class 3 | Class 4 | |
| probability | ||||
| By full-time/part-time status | ||||
| Full-time | 0.44 | 0.21 | 0.13 | 0.22 |
| Part-time | 0.27 | 0.15 | 0.18 | 0.39 |
| Men (full-time) | 0.44 | 0.20 | 0.14 | 0.22 |
| Women (part-time) | 0.26 | 0.16 | 0.18 | 0.40 |
| Age 30 to 44 (full-time) | 0.46 | 0.22 | 0.16 | 0.16 |
| Age 45 to 59 (full-time) | 0.44 | 0.25 | 0.10 | 0.21 |
| Age 18 to 29 (part-time) | 0.17 | 0.07 | 0.30 | 0.45 |
| Age 60 or older (part-time) | 0.27 | 0.15 | 0.20 | 0.38 |
| Postsecondary education (full-time) | 0.41 | 0.25 | 0.16 | 0.18 |
| University (full-time) | 0.59 | 0.13 | 0.09 | 0.19 |
| High school (part-time) | 0.18 | 0.13 | 0.28 | 0.42 |
| By contract type | ||||
| Regular | 0.43 | 0.21 | 0.14 | 0.22 |
| NSW | 0.26 | 0.14 | 0.13 | 0.47 |
| Age 30 to 44 (regular) | 0.44 | 0.22 | 0.18 | 0.17 |
| Age 45 to 59 (regular) | 0.45 | 0.25 | 0.11 | 0.19 |
| Age 18 to 29 (NSW) | 0.19 | 0.05 | 0.25 | 0.51 |
| Age 60 or older (NSW) | 0.31 | 0.12 | 0.08 | 0.48 |
| Postsecondary education (regular) | 0.39 | 0.24 | 0.18 | 0.20 |
| University (regular) | 0.58 | 0.14 | 0.10 | 0.17 |
| High school (NSW) | 0.20 | 0.10 | 0.20 | 0.50 |
| Full-time (regular) | 0.47 | 0.22 | 0.13 | 0.18 |
| Part-time (NSW) | 0.20 | 0.11 | 0.14 | 0.55 |
|
Note: The values refer to predicted probabilities of belonging to a certain job class for a selected group, excluding industry and occupation in the latent class analysis (LCA), holding all other controls in the LCA regression at their means. NSW: non-standard work. Source: Statistics Canada, 2016 General Social Survey. |
||||
5 Conclusion
This study assessed job quality in Canada using an internationally inspired multidimensional framework that covers six broad aspects: income and benefits, career prospects, work intensity, working-time quality, skills and discretion, and social environment. The descriptive results show diverse patterns of job quality across sectors and socio-demographic groups. In particular, some of the largest labour market segments, such as hospitality and personal services, exhibited lower job quality features in multiple dimensions. The study also showed that the concerns relating to the youth labour market involve more than just a high level of unemployment and low participation. Marked differences in job quality were more apparent along the education line and, to a lesser extent, the gender line.
Latent class analysis identified four very distinct job quality profiles. About 30% of all workers were predicted to hold a high-quality job associated with many good job features in all six quality dimensions, while 26% had a poor overall quality job, which lacks many good features in most dimensions. On average, 27% of workers held a job with some good features other than working-time quality, and the remaining 17% were considered as having a fair quality job with decent features in terms of prospects and work intensity but less so in terms of the other dimensions, particularly the social environment and benefits.
The results indicate that non-standard employment arrangements are strong predictors of job quality classes: about one-third to one-half of workers in atypical contracts or part-time employment fell into the worst job quality class, all else being equal. Moreover, firm size was positively associated with job quality, a result that suggests demand-side factors also play a role.
Finally, findings on job quality profiles for groups at risk of non-standard work suggest that workplace exclusion, either through lower pay or poorer access to other job quality features, can pose challenges to inclusive growth. As many women, youth, and less-educated today are engaging in part-time and/or non-standard contracts, either voluntarily or involuntarily, a growing dispersion of job quality along these lines could stand in the way of inclusive growth and a robust economy. The work done as part of this study provides partial guidance for future studies that could shed more light on gender, youth, occupational or sectoral patterns of job quality.
6 Appendix
| Number of classes | Likelihood ratio test | Degrees of freedom | AIC | BIC |
|---|---|---|---|---|
| 2 | 1667.2 | 703.0 | 1717.2 | 1891.9 |
| 3 | 1293.1 | 690.0 | 1369.1 | 1634.6 |
| 4 | 1135.0 | 677.0 | 1237.0 | 1593.4 |
| 5 | 1043.2 | 664.0 | 1171.2 | 1618.4 |
| 6 | 965.1 | 651.0 | 1119.1 | 1657.1 |
|
Notes: Sample was restricted to workers aged 18 and older with valid answers to all job quality questions in the General Social Survey. Total number of observations: 8,004. AIC: Akaike’s Information Criterion; BIC: Bayesian Information Criterion. Source: Statistics Canada, 2016 General Social Survey. |
||||
| Latent class profileAppendix Table Note 1 | ||||||
|---|---|---|---|---|---|---|
| High overall quality jobs | Good quality jobs, poor working-time quality | Poor overall quality jobs | ||||
| Class 1 | Class 2 | Class 4 | ||||
| β | standard error | β | standard error | β | standard error | |
| Intercept | 0.676 | 0.131 | 0.715 | 0.135 | 0.794 | 0.134 |
| Women (reference: men) | -0.053 | 0.065 | 0.072 | 0.069 | 0.136 | 0.072 |
| Age group (reference: ages 30 to 44) | ||||||
| 18 to 29 | -0.464 | 0.081 | -0.364 | 0.090 | -0.212 | 0.084 |
| 45 to 59 | 0.415 | 0.069 | 0.295 | 0.072 | 0.468 | 0.073 |
| 60 and older | 0.323 | 0.086 | 0.021 | 0.096 | 0.348 | 0.091 |
| Education (reference: some postsecondary education) | ||||||
| High school | -0.391 | 0.073 | -0.188 | 0.077 | -0.269 | 0.075 |
| University degree | 0.326 | 0.080 | -0.065 | 0.086 | 0.238 | 0.083 |
| Immigrant (reference: Canadian-born) | -0.209 | 0.073 | -0.305 | 0.080 | -0.297 | 0.078 |
| Part-time (reference: full-time) | -0.660 | 0.082 | -0.613 | 0.085 | -0.039 | 0.088 |
| Atypical contract (reference: regular contract) | -0.244 | 0.099 | -0.350 | 0.112 | 0.599 | 0.107 |
| Firm size (reference: 20 to 99 employees) | ||||||
| Fewer than 20 employees | -0.575 | 0.075 | -0.878 | 0.079 | -0.262 | 0.081 |
| 100 to 500 employees | 1.102 | 0.083 | 0.991 | 0.086 | 0.645 | 0.090 |
| 500 employees or more | 1.229 | 0.105 | 1.109 | 0.112 | 0.699 | 0.119 |
| Industry (reference: trades/transportation) | ||||||
| Public | 1.576 | 0.115 | 1.426 | 0.120 | 0.416 | 0.120 |
| Primary | 0.428 | 0.160 | 0.199 | 0.162 | -0.026 | 0.163 |
| Finance/professional | 0.489 | 0.102 | -0.128 | 0.113 | -0.195 | 0.107 |
| Education | -0.157 | 0.157 | 1.134 | 0.158 | -0.503 | 0.166 |
| Construction | -0.581 | 0.137 | -1.052 | 0.147 | -0.787 | 0.146 |
| Health care | -0.211 | 0.118 | 0.527 | 0.119 | -0.276 | 0.118 |
| Manufacturing | -0.192 | 0.130 | -0.669 | 0.135 | -0.241 | 0.135 |
| Hospitality | -0.029 | 0.110 | -0.662 | 0.115 | -0.084 | 0.108 |
| Occupation (reference: sales) | ||||||
| Professionals | 0.523 | 0.127 | 0.103 | 0.138 | -0.181 | 0.134 |
| Clerks | -0.032 | 0.119 | -0.176 | 0.134 | -0.157 | 0.128 |
| Technicians | -0.238 | 0.128 | 0.397 | 0.134 | -0.098 | 0.134 |
| Managers | 0.234 | 0.138 | -0.734 | 0.154 | -0.430 | 0.156 |
| Operators | -0.860 | 0.138 | 0.308 | 0.137 | -0.214 | 0.140 |
| Elementary | -0.513 | 0.172 | 0.846 | 0.175 | 0.377 | 0.182 |
| Personal services | -0.503 | 0.132 | 0.158 | 0.133 | -0.101 | 0.133 |
| Region (reference: Ontario) | ||||||
| Atlantic | -0.295 | 0.087 | 0.067 | 0.090 | -0.335 | 0.093 |
| Quebec | -0.184 | 0.085 | -0.466 | 0.091 | -0.336 | 0.091 |
| Prairies | 0.078 | 0.084 | -0.077 | 0.088 | -0.401 | 0.088 |
| British Columbia | 0.004 | 0.090 | -0.062 | 0.099 | -0.239 | 0.096 |
Source: Statistics Canada, 2016 General Social Survey. |
||||||
References
Adams, R.B., and T. Kirchmaier. 2016. “Women on Boards in Finance and STEM industries.” American Economic Review 106 (5): 277–281.
Arends, I., C. Prinz, and F. Abma. 2017. Job Quality, Health and At-work Productivity. OECD Social, Employment and Migration Working Papers, no. 195. Paris: OECD Publishing.
Autor, D.H., and D. Dorn. 2013. “The growth of low skill service jobs and the polarization of the US labor market.” The American Economic Review 103 (5): 1553–1597.
Bardasi, E., and J. Gornick. 2008. “Working for Less? Women’s Part-Time Wage Penalties across Countries.” Feminist Economics 14 (1): 37–72.
Bentolila, S., and G. Saint-Paul. 1994. “A Model of Labor Demand with Linear Adjustment Costs.” Labour Economics 1 (3–4): 303–326.
Brisbois, R. 2003. How Canada Stacks Up: The Quality of Work – An International Perspective. Research Paper W|23, Work Network. Ottawa: Canadian Policy Research Networks.
Catalina-Romero, C., J.C. Sainz, J.I. Pastrana-Jimenez, N. Garcia-Dieguez, I. Irizar-Munoz, J.L. Aleixandre-Chiva, A. Gonzales-Quintela, and E. Calvo-Bonacho. 2015. “The Impact of Poor Psychosocial Work Environment on non-Work-related Sickness Absence.” Social Science and Medicine 138: 210–216.
Cazes, S., A. Hijzen and A. Saint-Martin. 2016. Measuring and Assessing Job Quality: the OECD Job Quality Framework. OECD Social, Employment and Migration Working Papers, no. 174, Paris: OECD Publishing.
Chappell, D., and V. Di Martino. 2006. Violence at Work. Third edition. Geneva: International Labour Office.
Eurofound. 2016. Sixth European Working Conditions Survey—Overview report. Luxembourg: Publications Office of the European Union.
Galarneau, D. 2010. “Temporary Employment in the Downturn.” Perspectives on Labour and Income 11 (11): 5–17. Statistics Canada Catalogue no. 75-001-X.
Goos, M., A. Manning, and A. Salomons. 2009. “Job polarization in Europe.” The American Economic Review 99 (2): 58–63.
Green, D., and B. Sand. 2015. “Has the Canadian Labour Market Polarized?” Canadian Journal of Economics 48 (2): 612–646.
Green, F. 2010. “Wellbeing, Job Satisfaction and Labour Mobility.” Labour Economics 17 (6): 897–903.
Horowitz, J. 2016. “Dimensions of Job Quality, Mechanisms, and Subjective Well-being in the United States.” Sociological Forum 31 (2): 419–440.
Jackson, A., and P. Kumar. Measuring and Monitoring the Quality of Jobs and the Work Environment in Canada. Paper presented at the Centre for the Study of Living Standards Conference on the State of Living Standards and the Quality of Life in Canada, Ottawa, October 30 and 31, 1998.
Kapsalis, C., and P. Tourigny. 2004. “Duration of Non-Standard Employment.” Perspectives on Labour and Income 5 (12): 5–13. Statistics Canada Catalogue no. 75-001-X.
Lanza, S.T., J.J. Dziak, L. Huang, A.T. Wagner, and L.M. Collins. 2015. LCA Stata plugin users' guide (Version 1.2). University Park, Pennsylvania: The Methodology Center, Pennsylvania State University. Available from methodology.psu.edu.
Leschke, J., A. Watt, and M. Finn. 2008. Putting a number on job quality? Constructing a European job quality index. Brussels: European Trade Union Institute for Research, Education and Health and Safety.
Lowe, G. 2007. 21st Century Job Quality: Achieving What Canadians Want. CPRN Research Repot W|37. Ottawa: Canadian Policy Research Networks.
Lowe, G., and G. Schellenberg. 2001. What’s a Good Job? The Importance of Employment Relationships. CPRN Study W|05. Ottawa: Canadian Policy Research Networks.
Milner, A., P. Butterworth, R. Bentley, A.M. Kavanagh, and A.D. LaMontagne. 2015. “Sickness Absence and Psychosocial Job Quality: an Analysis from a Longitudinal Survey of Working Australians, 2005-2012.” American Journal of Epidemiology 181 (10): 781–788.
Morissette, R. 2016. Perspectives on the Youth Labour Market in Canada. A presentation series from Statistics Canada about the economy, environment and society, no. 002. Statistics Canada Catalogue no. 11-631-X. Ottawa: Statistics Canada.
Moyser, M. 2017. Women and Paid Work. Women in Canada: A Gender-based Statistical Report, no. 001. Statistics Canada Catalogue no. 89-503-X. Ottawa: Statistics Canada.
O’Dorchai, S., R. Plasman, and F. Rycx. 2007. The Part-Time Wage Penalty in European Countries: How Large is it for Men? IZA Discussion Paper, no. 2591. Bonn: Institute for the Study of Labor.
OECD (Organisation for Economic Co-operation and Development). 2013. How is Life? Measuring Well-Being. Paris: OECD Publishing.
OECD (Organisation for Economic Co-operation and Development). 2014. “How good is your job? Measuring and Assessing Job Quality.” In OECD Employment Outlook 2014. Paris: OECD Publishing.
OECD (Organisation for Economic Co-operation and Development). 2015a. “The Quality of Working Lives: Earnings Mobility, Labour Market Risk and Long-Term Inequality.” In OECD Employment Outlook 2015. Paris: OECD Publishing.
OECD (Organisation for Economic Co-operation and Development). 2015b. Job Quality Framework. OECD Social, Employment and Migration Working Papers, no. 174. Paris: OECD Publishing.
Park, J. 2010. “Health Factors and Early Retirement among Older Workers.” Perspectives on Labour and Income 11 (6): 5–13. Statistics Canada Catalogue no. 75-001-X.
Portugal, P., and J. Varejao. 2009. “Why Do Firms Use Fixed-Term Contracts?” IZA Discussion Paper, no. 4380. Bonn: Institute for the Study of Labor.
Salvatori, A. 2010. “Labour Contract Regulations and Workers Wellbeing: International Longitudinal Evidence.” Labour Economics 17 (4): 667–678.
Shields, M. 2006. “Unhappy on the Job.” Health Reports 17 (4): 33–37. Statistics Canada Catalogue no. 82-003-X.
Shields, M., and K. Wilkins. 2009. “Factors related to on-the-job abuse of nurses by patients.” Health Reports 20 (2): 7–19. Statistics Canada Catalogue no. 82-003-X.
Statistics Canada. n.d.a. Table 14-10-0018-01 Labour force characteristics by sex and age group, annual (x 1,000). (Formerly CANSIM table 282-0002). Available at: https://www150.statcan.gc.ca/t1/tbl1/en/tv.action?pid=1410001801 (accessed August 23, 2018).
Statistics Canada. n.d.b. Table 14-10-0020-01 Unemployment rate, participation rate and employment rate by educational attainment, annual. (Formerly CANSIM table 282-0004). Available at: https://www150.statcan.gc.ca/t1/tbl1/en/tv.action?pid=1410002001 (accessed August 23, 2018).
Turcotte, M., and G. Schellenberg. 2005. “Job Strain and Retirement.” Perspectives on Labour’ and Income 6 (7): 13–17. Statistics Canada Catalogue no. 75-001-X.
Vermunt, J.K and J. Magidson. 2002. Latent class cluster analysis. In: J.A. Hagenaars and A.L. McCutcheon (eds.), Applied Latent Class Analysis, 89-106. Cambridge: Cambridge University Press.
- Date modified: