
Analytical Studies Branch Research Paper Series
Are Canadian Jobs More or Less Skilled than American Jobs?

Archived Content
Information identified as archived is provided for reference, research or recordkeeping purposes. It is not subject to the Government of Canada Web Standards and has not been altered or updated since it was archived. Please "contact us" to request a format other than those available.
by Marc Frenette and Kristyn Frank, Social Analysis and Modelling Division, Statistics Canada
Skip to text
Text begins
Abstract
Canadian workers are generally more skilled than American workers in literacy, numeracy and problem solving in a technology‑rich environment (Statistics Canada 2013). However, workers who possess certain skills are not guaranteed to employ those skills in their job. Furthermore, workers may employ many other skills in the workplace (Frenette and Frank 2017). This study compares the skill requirements of actual jobs held by workers in Canada and in the United States. In total, 35 job skills are examined. The study finds that the skill level required in Canadian jobs is significantly higher than for American jobs in 30 of the 35 areas examined. The Canadian advantage is particularly large in science, technology, engineering and mathematics (STEM) and other technology‑related skill areas. In these areas, the relatively larger proportion of non‑university graduates in engineering, manufacturing and construction, and the higher numeracy proficiency in Canada account for almost all of the gap in skill level. The one group facing lower skill requirements in Canada is university graduates. In general, the jobs that they hold require lower reading comprehension, writing, social and management skills compared to their counterparts in the United States. Some implications for future research are discussed.
Executive summary
Increased globalization places competitive pressures on firms heavily involved in international trade. To be successful, firms must be innovative and productive—two attributes that rely greatly on a skilled workforce. Key in the toolbox of productive workers are science, technology, engineering and mathematics (STEM) skills. However, STEM skills are often not enough to generate significant productivity on their own. Indeed, the complementarity between STEM and non‑STEM skills (such as communication and management skills) has been noted as a key driver of innovation and productivity.
Overall, labour productivity growth in the United States has outpaced that in Canada over the past several decades. This is despite the fact that Canadians are more skilled than Americans in literacy, numeracy and problem solving in a technology‑rich environment (Statistics Canada 2013). However, workers’ skills are not always used in the workplace. Many factors may come into play, including
- the level of capital investment, which may influence the capital–labour ratio
- international trade agreements, which affect international product demand
- the distance between major urban centres and other issues that may affect the quality of job match.
Moreover, workers tend to employ many other skills in the workplace (Frenette and Frank 2017).
The study combines two data sources to compare the skill level required in Canadian and American jobs.
The first is the Programme for the International Assessment of Adult Competencies (PIAAC), which was developed by the Organisation for Economic Co‑operation and Development (OECD). The PIAAC survey data were collected from November 2011 to June 2012 and contain results from assessments in literacy, numeracy and problem‑solving in a technology‑rich environment (PS‑TRE). They also contain key demographic information on respondents such as sex, immigrant status, age, highest level of educational attainment, field of study and current occupation. For international comparability, the occupation was coded according to the International Standard Classification of Occupations, 2008 (ISCO‑08).
Skill level requirements were attached to each PIAAC respondent’s ISCO‑08 occupation code according to data from the Occupational Information Network (O*NET). The O*NET database was developed by the U.S. Department of Labor and contains job skill level requirements for each 2010 Standard Occupational Classification (SOC) code. The skill level requirements were determined using the results of a survey of job incumbents. Job incumbents in each occupation were asked to rate skill levels for their job on a scale of 1 to 7 with the assistance of examples for specific values. These results were micro‑edited by job analysts with specialized knowledge of occupations. If over 75% of respondents rated a skill as "not important," the job analysts rated the skill as "not relevant" for the occupation. In this study, such skills were assigned a level of 0. In total, this study examines 35 job skills in both STEM areas and non‑STEM areas.
The skill level ratings from the O*NET database were attached to the PIAAC data at the occupational level after the 2010 SOC codes were converted into ISCO‑08 codes with a concordance file created by the U.S. Bureau of Labor Statistics.
The analytical sample consists of current paid employees aged 25 to 65. Individuals under age 25 were dropped from the sample to minimize possible selection issues associated with the decision to work or go to school. These sample restrictions resulted in a sample of 16,589 Canadian workers and 2,958 U.S. workers.
The study finds that the skill level of Canadian jobs is significantly higher than that of American jobs in 30 of the 35 areas examined. The Canadian advantage is particularly large in STEM and other technology‑related skill areas. In these areas, the relatively larger proportion of non‑university graduates in engineering, manufacturing and construction, and the higher numeracy proficiency in Canada account for almost all of the gap in skill level. The one group facing lower skill requirements in Canada is university graduates. In general, the jobs that they hold require lower reading comprehension, writing, social and management skills compared to their counterparts in the United States.
1 Introduction
Labour productivity (output per hour worked) is generally regarded by economists as the most important determinant of a nation’s standard of living in the long run. Theoretically, this follows from the positive relationship between workers’ productivity and their compensation in a competitive market. Empirically, labour productivity and mean total compensation are indeed positively associated (e.g., Anderson 2007).Note Note
Given the intimate relationship between labour productivity and living standards, the fact that studies have shown that Canada’s labour productivity level and growth rate lag behind those of the United StatesNote —Canada’s largest trading partner—has garnered considerable interest in the topic of productivity in recent years.
Studies have identified many factors behind the gap in labour productivity. These factors include differences in machinery and equipment investment, the capital–labour ratio, trade openness, and capacity utilization (Rao, Tang and Wang 2008), as well as differences in firm size (Baldwin, Leung and Rispoli 2014). However, no studies have looked directly at the role of skills.Note That Canadians outperform Americans in literacy, numeracy and problem‑solving in a technology‑rich environment (PS‑TRE) is well established (Statistics Canada 2013). Furthermore, a recent report by an expert panel concluded that science, technology, engineering and mathematics (STEM) skills are vital to productivity (Council of Canadian Academies 2015). The same report highlighted the importance of complementary skills, such as communication, teamwork and leadership, in fostering innovation and productivity. Thus, understanding Canada–United States differences in a wide range of work‑related, productivity‑enhancing skills is important within the context of the existing productivity gap.
Job skills should also be examined from the worker perspective. Countless studies have focused on the labour market outcomes of postsecondary graduates, but these studies are usually limited to earnings and employment outcomes. Frenette and Frank (2017) were the first to document the occupational skills of Canadian postsecondary graduates. The skills that workers use in their job can also be considered a labour market outcome. Postsecondary students may be interested in knowing more about what they will be expected to do in the jobs that they land or which specific skills may be needed to land those jobs. For example, Frenette and Frank (2017) found that not only did engineering graduates rank very high in mathematics, science and technical job skills, but they were also required to demonstrate high‑level reading and writing skills in the jobs that they typically landed. This may or may not conform to a priori expectations of students considering a career in engineering.
This study provides a first look at the skill level requirements of jobs held by Canadian and American workers. In total, the study examines 35 different skills including STEM skills and skills in several complementary areas. Focusing on the skill level requirements of jobs (as opposed to those for workers) is important given that workers’ skills are not guaranteed to be used in their job. The reasons for this include capital investments, technological changes (which may complement or substitute the skills of workers), shifting product demand and the quality of the match between employer demands and workers’ skills.
The next section describes the data and methods used in the study. The results are presented in Section 3. The study is summarized and thoughts on future research are discussed in the Conclusion.
2 Data and methods
The study combines two data sources.Note
The first is the Programme for the International Assessment of Adult Competencies (PIAAC) developed by the Organisation for Economic Co‑operation and Development (OECD).Note The survey design was designed to draw representative samples of the adult population in participating countries. The survey data were collected from November 2011 to June 2012 and contain results from assessments in literacy, numeracy and PS‑TRE. They also contain key demographic information on respondents such as sex, immigrant status, age, highest level of educational attainment, field of study and current occupation. For international comparability, the occupation was coded according to the International Standard Classification of Occupations, 2008 (ISCO‑08).
Skill level requirements were attached to each PIAAC respondent’s ISCO‑08 occupation code according to data from version 17.0 of the Occupational Information Network (O*NET). The O*NET database was developed by the U.S. Department of LaborNote and contains job skill level requirements for each 2010 Standard Occupational Classification (SOC) code. The skill level requirements were determined using the results of a survey of job incumbents. Job incumbents in each occupation were asked to rate skill levels for their job on a scale of 1 to 7 with the assistance of examples for specific values. These results were micro‑edited by job analysts with specialized knowledge of occupations. If over 75% of respondents rated a skill as "not important," the job analysts rated the skill as "not relevant" for the occupation. In this study, such skills were assigned a level of 0.Note
Before skill ratings could be attached to the PIAAC dataset, the six‑digit 2010 SOC codes in O*NET needed to be converted into the four‑digit ISCO‑08 codes used by PIAAC. The conversion was done using a concordance file created by the U.S. Bureau of Labor Statistics. In cases where one 2010 SOC code mapped to one or more ISCO‑08 codes, the O*NET skill information was assigned without issue. However, when more than one 2010 SOC code mapped to one ISCO‑08 code, skill information had to be obtained from a higher 2010 SOC level (i.e., from the five‑digit level) until a unique 2010 SOC code mapped to one ISCO‑08 code.
Since no Canadian data are coded using the 2010 SOC, the 2010 American Community Survey (ACS) was used to assign weights to each contributing 2010 SOC code for both countries. These weights were based on the relative population frequency of 2010 SOC codes in the ACS. In some instances, a six‑digit 2010 SOC code had ‘breakout’ (i.e., new or emerging) sub‑occupations. Since there were no estimates of population size for these sub‑occupations, it was assumed that they were of equal size within a six‑digit 2010 SOC code. After the breakout occupations were aggregated and 2010 SOC codes with no skill data were dropped, 419 of the original 438 ISCO‑08 codes were assigned skill level data. Of these 419 unique ISCO‑08 codes, 290 were uniquely matched to one six‑digit 2010 SOC code. The remaining 129 ICSO‑08 codes were matched to a unique five‑digit 2010 SOC code with weights provided by the ACS. The resulting dataset, consisting of 419 ISCO‑08 codes with skill level data, were then merged to the PIAAC data.
The primary objective of the study is to compare skill level requirements of Canadian and American jobs. The analytical sample consists of current paid employees who are between the ages of 25 and 65. Younger individuals are dropped from the sample to minimize possible selection issues associated with the decision to work or go to school.Note These sample restrictions resulted in a total of 16,589 Canadian workers and 2,958 U.S. workers.
Many variables from the O*NET and PIAAC data are used in the analysis. The key outcome variables are the 35 job skill levels from O*NET (National Center for O*NET Development n.d., p. 8, 9) that are specific to the worker’s ISCO‑08 occupation. These skills are listed below. They are grouped into nine categories simply for presentation purposes. All 35 skills are examined separately in this study.Note
Reading comprehension: Understanding written sentences and paragraphs in work related documents.
Writing: Communicating effectively in writing as appropriate for the needs of the audience.
Mathematics: Using mathematics to solve problems.
Science: Using scientific rules and methods to solve problems.
Process, complex problem solving and systems
- Active learning: Understanding the implications of new information for both current and future problem‑solving and decision‑making.
- Complex problem solving: Identifying complex problems and reviewing related information to develop and evaluate options and implement solutions.
- Critical thinking: Using logic and reasoning to identify the strengths and weaknesses of alternative solutions, conclusions or approaches to problems.
- Judgment and decision making: Considering the relative costs and benefits of potential actions to choose the most appropriate one.
- Learning strategies: Selecting and using training/instructional methods and procedures appropriate for the situation when learning or teaching new things.
- Monitoring: Monitoring/assessing performance of yourself, other individuals or organizations to make improvements or take corrective action.
- Systems analysis: Determining how a system should work and how changes in conditions, operations and the environment will affect outcomes.
- Systems evaluation: Identifying measures or indicators of system performance and the actions needed to improve or correct performance, relative to the goals of the system.
Social
- Active listening: Giving full attention to what other people are saying, taking time to understand the points being made, asking questions as appropriate, and not interrupting at inappropriate times.
- Coordination: Adjusting actions in relation to others’ actions.
- Instructing: Teaching others how to do something.
- Negotiation: Bringing others together and trying to reconcile differences.
- Persuasion: Persuading others to change their minds or behaviour.
- Service orientation: Actively looking for ways to help people.
- Social perceptiveness: Being aware of others’ reactions and understanding why they react as they do.
- Speaking: Talking to others to convey information effectively.
Technical operation and maintenance
- Equipment maintenance: Performing routine maintenance on equipment and determining when and what kind of maintenance is needed.
- Equipment selection: Determining the kind of tools and equipment needed to do a job.
- Installation: Installing equipment, machines, wiring or programs to meet specifications.
- Operation and control: Controlling operations of equipment or systems.
- Operation monitoring: Watching gauges, dials or other indicators to make sure a machine is working properly.
- Quality control analysis: Conducting tests and inspections of products, services or processes to evaluate quality or performance.
- Repairing: Repairing machines or systems using the needed tools.
- Troubleshooting: Determining causes of operating errors and deciding what to do about it.
Technical design and analysis
- Operations analysis: Analyzing needs and product requirements to create a design.
- Programming: Writing computer programs for various purposes.
- Technology design: Generating or adapting equipment and technology to serve user needs.
Resource management
- Management of financial resources: Determining how money will be spent to get the work done, and accounting for these expenditures.
- Management of material resources: Obtaining and seeing to the appropriate use of equipment, facilities and materials needed to do certain work.
- Management of personnel resources: Motivating, developing and directing people as they work, identifying the best people for the job.
- Time management: Managing one’s own time and the time of others.
There is no known classification of skills into STEM or non‑STEM. Arguably, STEM workers may be more likely to demonstrate higher levels of mathematics, science, and technical design and analysis skills. Thus, for the purposes of this study, those skills are classified as STEM skills.
The main outcome is the percentage differences in skill level requirements for Canadian and U.S. jobs. In all cases, the job refers to the main one held by the respondent at the time of the PIAAC survey.
To illuminate the differences in skill level requirements, PIAAC includes several other variables. These include straightforward variables such as sex, age and immigrant status, as well as some variables that require more elaboration. These variables include the highest level of completed education and the associated field of study (for those with a postsecondary credential), as well as assessed skills.
The highest level of completed education is coded according to the 1997 International Standard Classification of Education (ISCED) in PIAAC. For the purposes of this study, three categories were created: no postsecondary (ISCED = 3 or below), non‑university postsecondary (ISCED = 4 or 5B) and university (ISCED = 5A or 6).Note
Individuals with a postsecondary qualification (as well as those in upper secondary, or ISCED = 3) were asked to indicate which of the following nine categories best described the field of study associated with their highest level of completed education:
- general programs
- teacher training and education science
- humanities, languages and arts
- social sciences, business and law
- science, mathematics and computing
- engineering, manufacturing and construction
- agriculture and veterinary
- health and welfare
- services
Note that for the purposes of this study, the field of study is examined only for postsecondary graduates, since secondary school students in Canada and the United States generally do not have a field of study.
Skill assessments of the workers are available for literacy, numeracy and PS‑TRE. The literacy and numeracy assessments were conducted on paper, and the problem‑solving assessment was completed on computers. A slightly larger portion of the analytical sample chose not to participate in the computer‑assisted assessment in Canada (16.3%) than in the United States (14.4%). Moreover, a simple regression analysis indicated that the probability of opting out of the computer assessment was associated with several key predictors of job skills. In both countries, those who opted out were more likely to be male, immigrant and older; to have no postsecondary education; and to have lower numeracy skills. For these reasons, this study considers only workers’ literacy and numeracy skills.
The main analytical approach is a standard Oaxaca decomposition of the gap in the percentage difference in the mean levels of job skills between the two countries. These gaps are decomposed into a portion that can be explained by differences in the key determinants of job skills (i.e., sex, immigrant status, age, educational level, field of study and assessed skills) and a portion that cannot be explained. Pooled coefficients are used following statistical tests that validated this approach.
While most of the study examines the skill level requirements of the main jobs of workers, the number of hours worked in those jobs should also be taken into account. Therefore, the study looks at the skill level of hours worked by Canadian and American workers. In both countries, 0.2% of the sample was dropped for this analysis because in some cases employees did not report a positive number of hours worked.
Finally, two features of the PIAAC data require special measures for estimation purposes. First, the PIAAC sample was obtained through a multi‑stage, stratified sampling approach that varied by country. To account for the complex designs, 80 jackknife replicate weights are used for variance estimation. For point estimates, the population weights are used. Second, to reduce response burden, PIAAC participants completed only a portion of the assessments, and different participants responded to different items of the assessments. The actual test scores were imputed based on the similarity of respondent characteristics and the associated scores of donors in the missing items of the assessments. In total, 10 plausible values for each test score were created in the PIAAC dataset, which were used in the Stata piaacdes.ado and piaacreg.ado programs.Note These programs take into account the inherent measurement error created by the imputation approach.Note
3 Results
The analysis begins with a description of the characteristics of workers in both countries. Many of the demographic characteristics of Canadian and American workers are very similar (Table 1). Workers in the United States are slightly more likely to be women than their Canadian counterparts. Age is captured in five‑year increments in the PIAAC data. By this lens, the age differences between Canadian and American workers are minor.
The real distinctions between Canadian and U.S. workers lie in the proportion who are immigrants, as well as in the highest level of educational attainment, and acquired literacy and numeracy skills. About one‑quarter (26.5%) of Canadian workers are immigrants, compared with roughly one‑sixth (16.2%) of American workers. Canadian workers are considerably more likely to possess a postsecondary credential (72.1%) than their American counterparts (53.9%). This difference is fully explained by the higher rate of non‑university postsecondary credentials in Canada (39.8%) than in the United States (19.7%). University credentials are about as common among Canadian workers (32.3%) as American workers (34.2%).
Canadian workers are more skilled than American workers according to the PIAAC literacy and numeracy test results. The mean literacy test score was 1.4% higher in Canada, where workers scored 278.3 (out of a possible 500) on average, compared with 274.4 in the United States. The gap in numeracy was even wider—4.3% (271.1 in Canada, compared with 260.6 in the United States). Further analysis suggests that the difference in mean numeracy skills is largely driven by the lower half of the distributions in the two countries. For example, Canadian workers at the 10th percentile of the numeracy distribution outscored their American counterparts by 9.3%, compared with only 2.2% at the 90th percentile.
| Canada | United States | |
|---|---|---|
| proportion | ||
| Female | 0.470 | 0.484 |
| Ages | ||
| 25 to 29 | 0.120 | 0.140 |
| 30 to 34 | 0.135 | 0.122 |
| 35 to 39 | 0.123 | 0.131 |
| 40 to 44 | 0.134 | 0.128 |
| 45 to 49 | 0.139 | 0.141 |
| 50 to 54 | 0.153 | 0.140 |
| 55 to 59 | 0.117 | 0.107 |
| 60 to 65 | 0.079 | 0.090 |
| Immigrant | 0.265 | 0.162 |
| Holds no postsecondary credential | 0.279 | 0.461 |
| Holds a non-university postsecondary credential | 0.398 | 0.197 |
| Holds a university credential | 0.323 | 0.342 |
| mean | ||
| Literacy | 278.3 | 274.4 |
| Numeracy | 271.7 | 260.6 |
| number | ||
| Sample size | 16,589 | 2,958 |
|
Note: The sample consists of paid workers aged 25 to 65, sampled from November 2011 to June 2012. Source: Programme for the International Assessment of Adult Competencies (PIAAC). |
||
The field of study choices are also different, particularly among non‑university postsecondary credential holders (Table 2). Almost one‑quarter (24.5%) of Canadian workers with these credentials studied engineering, manufacturing and construction, compared with 14.3% of their American counterparts. Canadians are more than twice as likely to have a non‑university postsecondary qualification. Thus, among all workers in the sample, Canadians are almost four times more likely to have obtained a non‑university postsecondary qualification in engineering, manufacturing and construction than their American counterparts (9.8% versus 2.8%).
The only other notable difference among non‑university postsecondary graduates relates to the health and welfare field. U.S. workers were almost twice as likely as their Canadian counterparts to have studied in this discipline (25.4% versus 14.7%).
At the university level, the field of study choices were similar. One important exception is engineering, manufacturing and construction: 12.5% of Canadian university graduates in the sample graduated from such programs, compared with 8.0% of their Americans counterparts.
| Non-university post-secondary graduates | University graduates | |||
|---|---|---|---|---|
| Canada | United States | Canada | United States | |
| proportion | ||||
| General programs | 0.084 | 0.095 | 0.011 | 0.025 |
| Teacher training and education science | 0.034 | 0.045 | 0.148 | 0.125 |
| Humanities, languages and arts | 0.063 | 0.040 | 0.126 | 0.141 |
| Social sciences, business and law | 0.169 | 0.145 | 0.301 | 0.320 |
| Science, mathematics and computing | 0.104 | 0.126 | 0.161 | 0.142 |
| Engineering, manufacturing and construction | 0.245 | 0.143 | 0.125 | 0.080 |
| Agriculture and veterinary | 0.021 | 0.017 | 0.014 | 0.012 |
| Health and welfare | 0.147 | 0.254 | 0.106 | 0.121 |
| Services | 0.134 | 0.134 | 0.008 | 0.034 |
| number | ||||
| Sample size | 6,655 | 568 | 5,055 | 1,134 |
|
Note: The sample consists of paid workers aged 25 to 65 who have a postsecondary credential and were sampled from November 2011 to June 2012. Source: Programme for the International Assessment of Adult Competencies (PIAAC). |
||||
What types of occupations are Canadian and American workers employed in? As indicated in Chart 1, Canadian workers are generally more likely to be employed as professionals (24.9% versus 21.8%) or as technicians and associate professionals (20.2% versus 17.5%). American workers are more likely to be employed as services and sales workers (18.9% versus 12.9%). All other differences are quite small.Note
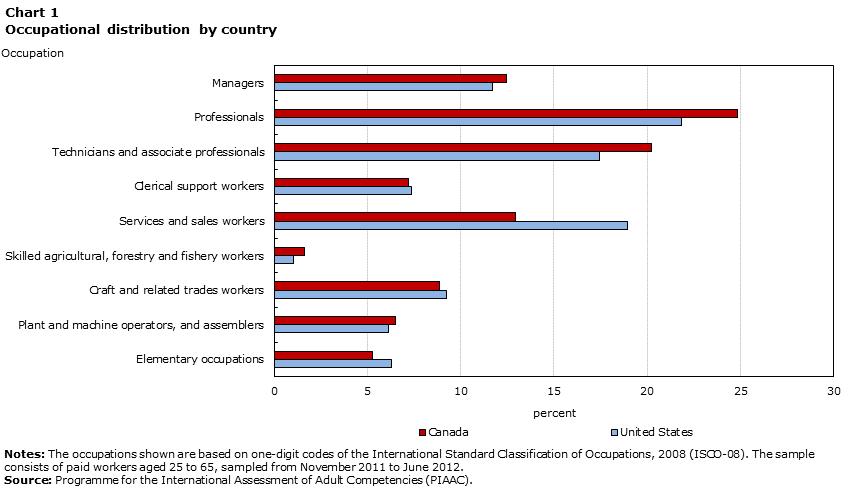
Data table for Chart 1
| Occupation | United States | Canada |
|---|---|---|
| percent | ||
| Managers | 11.69 | 12.48 |
| Professionals | 21.82 | 24.85 |
| Technicians and associate professionals | 17.45 | 20.24 |
| Clerical support workers | 7.36 | 7.23 |
| Services and sales workers | 18.94 | 12.94 |
| Skilled agricultural, forestry and fishery workers | 1.06 | 1.64 |
| Craft and related trades workers | 9.26 | 8.85 |
| Plant and machine operators, and assemblers | 6.12 | 6.53 |
| Elementary occupations | 6.29 | 5.25 |
|
Notes: The occupations shown are based on one-digit codes of the International Standard Classification of Occupations, 2008 (ISCO-08). The sample consists of paid workers aged 25 to 65, sampled from November 2011 to June 2012. Source: Programme for the International Assessment of Adult Competencies (PIAAC). |
||
Conceptually, these occupational differences may result in a different set of skills being required to perform the duties of the job. This is indeed the case, as shown in Chart 2. In 30 out of 35 areas, the average Canadian job requires a higher skill level than the average American job. These include all five STEM skills: operations analysis (7.0%), science (6.1%), programming (6.0%), mathematics (4.0%) and technology design (2.6%). These also include several technical skills such as installation (10.2%), equipment maintenance (9.1%), repairing (8.5%), equipment selection (7.3%), troubleshooting (3.3%) and quality control analysis (2.2%).Note Canadian workers were also employed in occupations that were more skilled in areas complementary to STEM such as reading comprehension, writing, social and management skills, complex problem solving, judgment and decision making, and systems analysis. However, the gaps are generally larger among STEM and other technical skills.
Given that Canada produces considerably more non‑university postsecondary graduates than the United States, assessing which types of skills these individuals use in the workforce is useful. Charts 3, 4 and 5 show the percentage differences in skill level between Canadian and American jobs for workers with a non‑university postsecondary credential, a university credential, and no postsecondary credential, respectively. Note that the sample sizes are necessarily much smaller for each group, and, thus, statistical significance is more challenging to achieve.

Data table for Chart 2
| Skill | Percent |
|---|---|
| Installation | 10.154007Note * |
| Equipment maintenance | 9.057444Note ** |
| Repairing | 8.499819Note ** |
| Equipment selection | 7.349872Note ** |
| Operations analysis | 6.953274Note *** |
| Science | 6.114625Note ** |
| Programming | 5.963069Note ** |
| Mathematics | 4.017023Note *** |
| Systems analysis | 3.469058Note *** |
| Systems evaluation | 3.392123Note *** |
| Troubleshooting | 3.281604† |
| Technology design | 2.622342† |
| Management of financial resources | 2.428053† |
| Quality control analysis | 2.171076Note * |
| Learning strategies | 2.019409Note *** |
| Management of material resources | 2.001959† |
| Management of personnel resources | 1.954447Note *** |
| Judgement and decision making | 1.775632Note *** |
| Complex problem solving | 1.710427Note *** |
| Time management | 1.457523Note *** |
| Negotiation | 1.362678Note ** |
| Instructing | 1.334444Note ** |
| Writing | 1.245721Note ** |
| Active learning | 1.224880Note ** |
| Operation monitoring | 1.211183 |
| Persuasion | 1.039432Note * |
| Coordination | 1.024746Note ** |
| Monitoring | 1.023071Note ** |
| Active listening | 0.933015Note ** |
| Reading comprehension | 0.699746† |
| Speaking | 0.642847† |
| Critical thinking | 0.376016 |
| Service orientation | 0.250588 |
| Operation and control | 0.213811 |
| Social perceptiveness | -0.013098 |
Note: The sample consists of paid workers aged 25 to 65, sampled from November 2011 to June 2012. Sources: Programme for the International Assessment of Adult Competencies (PIAAC) and Occupational Information Network (O*NET). |
|
Nevertheless, a clear pattern emerges: the largest occupational skill advantages for Canadian workers are observed among non‑university postsecondary graduates—the very group that Canada produces far more of (in relative terms) than the United States (Chart 3). In particular, several STEM skill areas (e.g., operations analysis, programming, technology design and mathematics) and several other technical skill areas (e.g., installation, repairing, equipment maintenance, equipment selection, troubleshooting, quality control analysis, and operation and control) are performed at a considerably higher level among Canadian non‑university postsecondary graduates.
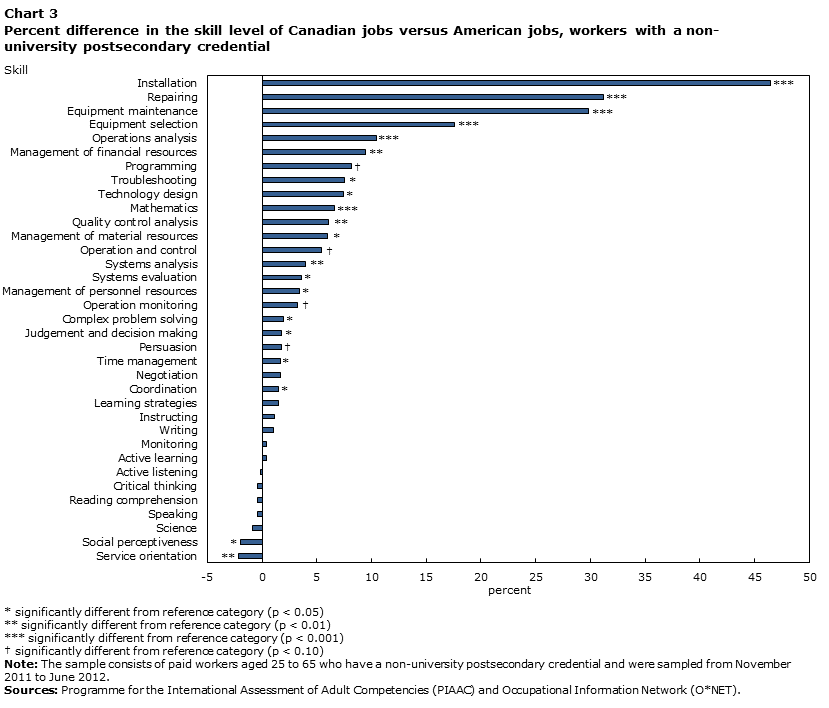
Data table for Chart 3
| Skill | Percent |
|---|---|
| Installation | 46.424365Note *** |
| Repairing | 31.233943Note *** |
| Equipment maintenance | 29.821145Note *** |
| Equipment selection | 17.578060Note *** |
| Operations analysis | 10.424797Note *** |
| Management of financial resources | 9.488456Note ** |
| Programming | 8.170818† |
| Troubleshooting | 7.581619Note * |
| Technology design | 7.478467Note * |
| Mathematics | 6.579280Note *** |
| Quality control analysis | 6.100682Note ** |
| Management of material resources | 5.972408Note * |
| Operation and control | 5.423497† |
| Systems analysis | 3.975386Note ** |
| Systems evaluation | 3.594130Note * |
| Management of personnel resources | 3.437204Note * |
| Operation monitoring | 3.283806† |
| Complex problem solving | 1.946589Note * |
| Judgement and decision making | 1.807397Note * |
| Persuasion | 1.806611† |
| Time management | 1.651367Note * |
| Negotiation | 1.648590 |
| Coordination | 1.506440Note * |
| Learning strategies | 1.484790 |
| Instructing | 1.122927 |
| Writing | 1.025574 |
| Monitoring | 0.449091 |
| Active learning | 0.427663 |
| Active listening | -0.107711 |
| Critical thinking | -0.388006 |
| Reading comprehension | -0.404327 |
| Speaking | -0.414982 |
| Science | -0.897714 |
| Social perceptiveness | -1.990739Note * |
| Service orientation | -2.181503Note ** |
Note: The sample consists of paid workers aged 25 to 65 who have a non-university postsecondary credential and were sampled from November 2011 to June 2012. Sources: Programme for the International Assessment of Adult Competencies (PIAAC) and Occupational Information Network (O*NET). |
|
At the university level (Chart 4), Canadians hold higher‑skilled jobs than Americans in one STEM skill area (i.e., mathematics), as well as several other technical skill areas (i.e., installation, equipment maintenance, equipment selection, repairing and troubleshooting). However, non‑STEM technical skill level requirements are generally quite low in the jobs held by university graduates. Moreover, the jobs that Canadian university graduates hold are less skilled than those of their American counterparts in many non‑STEM or technology‑related areas such as active listening, writing, speaking, critical thinking, active learning, reading comprehension and persuasion.
Among workers with no postsecondary credentials, there are very few significant differences in the skill level of jobs held in Canada and the United States (Chart 5).
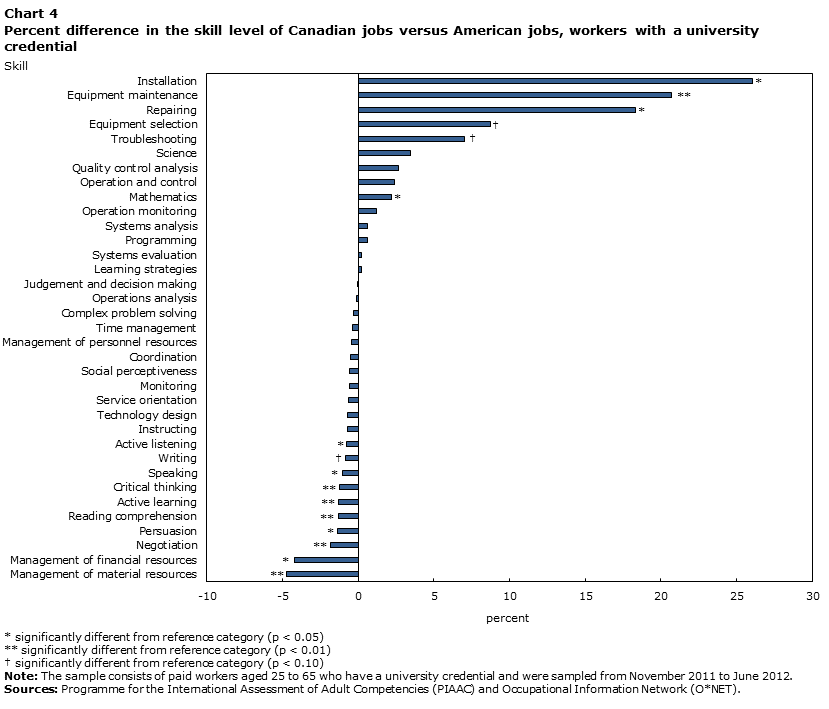
Data table for Chart 4
| Skill | Percent |
|---|---|
| Installation | 26.067613Note * |
| Equipment maintenance | 20.723656Note ** |
| Repairing | 18.340950Note * |
| Equipment selection | 8.712542† |
| Troubleshooting | 7.045885† |
| Science | 3.464763 |
| Quality control analysis | 2.639647 |
| Operation and control | 2.404540 |
| Mathematics | 2.176776Note * |
| Operation monitoring | 1.173844 |
| Systems analysis | 0.631165 |
| Programming | 0.620187 |
| Systems evaluation | 0.235994 |
| Learning strategies | 0.187128 |
| Judgement and decision making | -0.036154 |
| Operations analysis | -0.113794 |
| Complex problem solving | -0.342065 |
| Time management | -0.361826 |
| Management of personnel resources | -0.442622 |
| Coordination | -0.509776 |
| Social perceptiveness | -0.561975 |
| Monitoring | -0.576530 |
| Service orientation | -0.619750 |
| Technology design | -0.696794 |
| Instructing | -0.703776 |
| Active listening | -0.764287Note * |
| Writing | -0.867822† |
| Speaking | -1.046882Note * |
| Critical thinking | -1.238316Note ** |
| Active learning | -1.323002Note ** |
| Reading comprehension | -1.331689Note ** |
| Persuasion | -1.378000Note * |
| Negotiation | -1.817010Note ** |
| Management of financial resources | -4.211862Note * |
| Management of material resources | -4.753190Note ** |
Note: The sample consists of paid workers aged 25 to 65 who have a university credential and were sampled from November 2011 to June 2012. Sources: Programme for the International Assessment of Adult Competencies (PIAAC) and Occupational Information Network (O*NET). |
|

Data table for Chart 5
| Skill | Percent |
|---|---|
| Operations analysis | 6.243612Note ** |
| Management of material resources | 3.006902 |
| Equipment maintenance | 1.981966 |
| Systems evaluation | 1.758914 |
| Negotiation | 1.650676† |
| Equipment selection | 1.548398 |
| Systems analysis | 1.401331 |
| Management of personnel resources | 0.996349 |
| Complex problem solving | 0.891856 |
| Time management | 0.821996 |
| Repairing | 0.743269 |
| Mathematics | 0.678868 |
| Active learning | 0.669032 |
| Judgement and decision making | 0.599922 |
| Instructing | 0.532925 |
| Coordination | 0.471109 |
| Active listening | 0.464400 |
| Persuasion | 0.381089 |
| Reading comprehension | 0.365216 |
| Monitoring | 0.266628 |
| Learning strategies | 0.156700 |
| Speaking | 0.007696 |
| Service orientation | -0.028646 |
| Writing | -0.067333 |
| Management of financial resources | -0.076638 |
| Critical thinking | -0.130912 |
| Operation monitoring | -0.540639 |
| Social perceptiveness | -1.365944Note * |
| Operation and control | -1.587031 |
| Quality control analysis | -2.269802 |
| Troubleshooting | -2.339359 |
| Programming | -3.763387 |
| Technology design | -3.980490† |
| Science | -4.973520 |
| Installation | -16.593399Note ** |
Note: The sample consists of paid workers aged 25 to 65 who have no postsecondary credential and were sampled from November 2011 to June 2012. Sources: Programme for the International Assessment of Adult Competencies (PIAAC) and Occupational Information Network (O*NET). |
|
As shown in Tables 1 and 2, the main differences between Canadian and American workers lie in educational attainment and measured skills. To what extent do these differences account for the higher occupational skills levels in Canada? To answer this question, 30 Oaxaca decompositions of the Canada–United States gap in occupational skills were estimated—one for each statistically significant gap (see Chart 2). The results are shown in Table 3.
Several key findings emerge from this analysis.
First, a large portion of the gap in job skills can be explained by differences in worker characteristics. In 26 out of 30 cases, over 50% of the gap in job skills could be explained by these differences. In 22 cases, over two‑thirds of the gap could be explained by these differences.
Second, the combined role of sex, immigrant status and age is small—often close to zero or negative—and comparatively much smaller than the role of educational attainment, literacy and numeracy. This is not surprising, since the differences in sex, immigrant status and age are relatively small, while the differences in educational attainment, literacy and numeracy are relatively larger.
Third, the important role of educational attainment can be explained in large part by the higher relative frequency of non‑university postsecondary graduates in the engineering, manufacturing and construction fields in Canada. This is especially relevant for skills such as installation, equipment maintenance, repairing, equipment selection, science, troubleshooting, technology design and quality control analysis. This is also the case for other job skills, albeit on a smaller scale.Note
Fourth, literacy and (especially) numeracy account for a significant portion of the job skill gap, even after the differences in educational attainment have been accounted for. In fact, numeracy often plays a larger role than educational attainment. Thus, Canadian jobs are more skilled not only because Canadian workers have more credentials than American workers. Canadian workers are also more skilled (particularly in numeracy), and this has led to Canadian workers being matched to more skilled occupations than their U.S. counterparts.
Fifth, differences in numeracy often play a similar role as, or a larger role than, differences in literacy in explaining the gap in non‑STEM and other technical skills between Canada and the United States. For example, numeracy accounts for 37.7% of the gap in management of personnel resources, compared with only 7% for literacy skills. This does not necessarily mean that numeracy is directly required for the management of personnel resources. However, graduates in technical fields such as engineering (who generally have relatively high numeracy skills) tend to land jobs with considerably higher managerial skill requirements than other graduates (Frenette and Frank 2017).
| Skills | Total gap | Explained | Explained by | Unexplained | |||
|---|---|---|---|---|---|---|---|
| Sex, age, and immigrant status | Educational attainment | Literacy | Numeracy | ||||
| percent | |||||||
| Installation | 10.2 | 69.2 | 9.4 | 29.5 | -14.8 | 45.2 | 30.8 |
| Equipment maintenance | 9.1 | 19.8 | 3.4 | 12.7 | -18.2 | 22.0 | 80.2 |
| Repairing | 8.5 | 27.3 | 4.9 | 15.2 | -18.4 | 25.5 | 72.7 |
| Equipment selection | 7.3 | 46.8 | 2.7 | 27.7 | -17.5 | 33.9 | 53.2 |
| Operations analysis | 7.0 | 57.3 | 5.2 | 21.9 | 9.1 | 21.1 | 42.7 |
| Science | 6.1 | 86.1 | 4.0 | 57.7 | 18.4 | 5.9 | 13.9 |
| Programming | 6.0 | 111.1 | 7.6 | 54.4 | 18.3 | 30.8 | -11.1 |
| Mathematics | 4.0 | 40.4 | -1.1 | 20.5 | 8.3 | 12.7 | 59.6 |
| Systems analysis | 3.5 | 62.5 | -0.4 | 31.7 | 10.3 | 20.8 | 37.5 |
| Systems evaluation | 3.4 | 67.6 | -1.3 | 40.5 | 10.2 | 18.1 | 32.4 |
| Troubleshooting | 3.3 | 88.9 | 20.4 | 60.0 | -20.1 | 28.6 | 11.1 |
| Technology design | 2.6 | 177.2 | 2.9 | 95.1 | 2.0 | 77.2 | -77.2 |
| Management of financial resources | 2.4 | 130.3 | 8.2 | 30.5 | 6.7 | 84.9 | -30.3 |
| Quality control analysis | 2.2 | 77.4 | 2.1 | 48.9 | -20.0 | 46.4 | 22.6 |
| Learning strategies | 2.0 | 60.6 | -10.9 | 43.1 | 15.6 | 12.8 | 39.4 |
| Management of material resources | 2.0 | 152.9 | 16.1 | 48.1 | -0.5 | 89.2 | -52.9 |
| Management of personnel resources | 2.0 | 69.9 | -3.2 | 28.5 | 7.0 | 37.7 | 30.1 |
| Judgement and decision making | 1.8 | 67.5 | 0.8 | 29.5 | 14.9 | 22.3 | 32.5 |
| Complex problem solving | 1.7 | 77.2 | 1.9 | 38.1 | 15.6 | 21.6 | 22.8 |
| Time management | 1.5 | 83.1 | -3.5 | 41.5 | 10.5 | 34.6 | 16.9 |
| Negotiation | 1.4 | 74.9 | -11.4 | 35.9 | 17.3 | 33.2 | 25.1 |
| Instructing | 1.3 | 79.9 | -8.3 | 50.4 | 21.0 | 16.8 | 20.1 |
| Writing | 1.2 | 105.2 | -8.8 | 57.3 | 30.8 | 26.0 | -5.2 |
| Active learning | 1.2 | 115.3 | -4.0 | 61.7 | 26.9 | 30.6 | -15.3 |
| Persuasion | 1.0 | 79.1 | -20.4 | 31.3 | 22.9 | 45.3 | 20.9 |
| Coordination | 1.0 | 55.8 | -10.3 | 36.2 | 7.7 | 22.3 | 44.2 |
| Monitoring | 1.0 | 90.7 | -12.5 | 58.4 | 18.8 | 26.0 | 9.3 |
| Active listening | 0.9 | 91.8 | -13.5 | 55.8 | 32.4 | 17.1 | 8.2 |
| Reading comprehension | 0.7 | 166.6 | -16.7 | 85.9 | 40.1 | 57.3 | -66.6 |
| Speaking | 0.6 | 156.7 | -13.1 | 96.3 | 46.1 | 27.5 | -56.7 |
|
Note: The sample consists of paid workers aged 25 to 65, sampled from November 2011 to June 2012. Sources: Programme for the International Assessment of Adult Competencies (PIAAC) and Occupational Information Network (O*NET). |
|||||||
So far, the analysis has focused on the main job held by Canadian and American workers. On that front, Canadian jobs are generally more skilled than American jobs. However, this may matter little from an economic perspective if Canadians employed in very low‑skilled jobs tend to work considerably more hours than workers in higher‑skilled jobs, compared with their U.S. counterparts. To account for this possibility, the percentage difference in mean job skills are re‑estimated after re‑weighting the data in each country by the hours worked.Note The results appear in Chart 6. The exercise had very little impact on the figures compared with Chart 2. By and large, differences in the distribution of work hours across Canadian and American jobs do not explain why Canadian jobs are more skilled than American jobs.
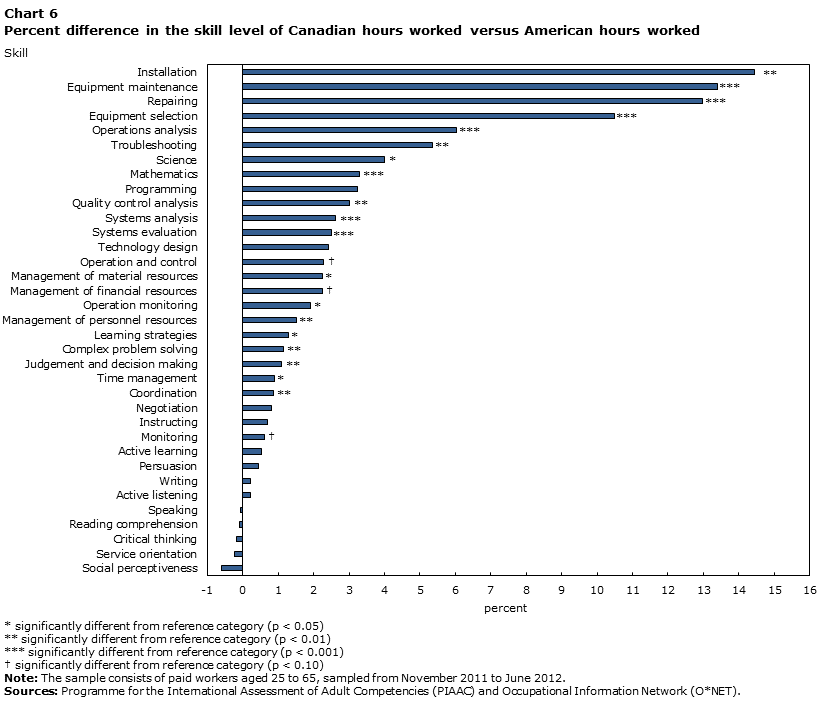
Data table for Chart 6
| Skill | Percent |
|---|---|
| Installation | 14.455396Note ** |
| Equipment maintenance | 13.387275Note *** |
| Repairing | 12.974201Note *** |
| Equipment selection | 10.487661Note *** |
| Operations analysis | 6.035413Note *** |
| Troubleshooting | 5.356193Note ** |
| Science | 4.009854Note * |
| Mathematics | 3.302603Note *** |
| Programming | 3.231700 |
| Quality control analysis | 3.001220Note ** |
| Systems analysis | 2.628361Note *** |
| Systems evaluation | 2.493346Note *** |
| Technology design | 2.427061 |
| Operation and control | 2.293762† |
| Management of material resources | 2.251917Note * |
| Management of financial resources | 2.246370† |
| Operation monitoring | 1.905567Note * |
| Management of personnel resources | 1.511352Note ** |
| Learning strategies | 1.286636Note * |
| Complex problem solving | 1.147887Note ** |
| Judgement and decision making | 1.087520Note ** |
| Time management | 0.899232Note * |
| Coordination | 0.862147Note ** |
| Negotiation | 0.811776 |
| Instructing | 0.691826 |
| Monitoring | 0.611291† |
| Active learning | 0.530872 |
| Persuasion | 0.459634 |
| Writing | 0.231759 |
| Active listening | 0.224556 |
| Speaking | -0.049924 |
| Reading comprehension | -0.087049 |
| Critical thinking | -0.187814 |
| Service orientation | -0.238830 |
| Social perceptiveness | -0.588732 |
Note: The sample consists of paid workers aged 25 to 65, sampled from November 2011 to June 2012. Sources: Programme for the International Assessment of Adult Competencies (PIAAC) and Occupational Information Network (O*NET). |
|
4 Conclusion
This study compared the level of job skills in Canada and the United States by combining occupational data on job skill levels from the Occupational Information Network with worker‑level data from the Programme for the International Assessment of Adult Competencies.
The study found that the skills required for Canadian jobs are significantly higher than for American jobs in 30 of the 35 areas examined. The Canadian advantage is particularly large in science, technology, engineering and mathematics (STEM) and other technology‑related skill areas. In these areas, the relatively larger proportion of non‑university graduates in engineering, manufacturing and construction, and the higher numeracy proficiency in Canada account for almost all of the gap in skill level. The one group facing lower skill requirements in Canada is university graduates. In general, the jobs that they hold require lower reading comprehension, writing, social and management skills compared to those of their counterparts in the United States.
The findings have important implications for future research in many different areas. For example, Canada lags behind the United States in labour productivity. This is despite previous research indicating that Canada has a more skilled workforce (in literacy, numeracy and problem solving in a technology‑rich environment). This is also despite new findings in this study indicating that Canadian workers generally make use of higher‑level skills than their American counterparts, particularly among non‑university postsecondary credential holders. These facts raise an interesting question that could be the subject of future research: how much larger would the productivity gap be if Canada did not possess a more skilled workforce than the United States? More broadly, understanding the relationship between worker skills and productivity may inform planners on the types of skills that need to be developed in school and in job training programs to help close the Canada–United States productivity gap in the future.
The study results also highlight the importance of non‑university postsecondary education credentials in the Canadian economy. Compared with university credentials, very little research has been conducted on non‑university postsecondary credentials in Canada. Community college graduates typically earn considerably less than university graduates in Canada (Frenette 2014). However, a university education may not always be the appropriate comparator for college graduates. Indeed, Frenette (2014) showed that community college graduates earned considerably more than high school graduates over a 20‑year study period. Community college graduates in Canada also fare well relative to their U.S. counterparts. As discussed by Frenette et al. (2017), the community college systems in Canada are more vocationally oriented than those in the United States. American community college students are relatively more likely to enroll in programs geared towards university transfer. Using comparable administrative data from both countries, the authors showed that Canadian community college students are more likely to complete their programs and earn more several years later than their counterparts in the United States. These findings line up well with the findings of the current study. In combination, they paint a success story for Canadian community college students. Not only are they more likely to complete their programs than community college students in the United States, but they also earn more on average in the labour market. They also likely contribute more to productivity by finding employment in occupations characterized by higher skill requirements.
There is even less research on trades programs and registered apprenticeships. In a pair of studies using the 2007 National Apprenticeship Survey, Laporte and Mueller (2011; 2012) examined the certification and completion patterns of registered apprentices and their role in determining wages. Two new data sets, the 2015 National Apprenticeship Survey and the linked Registered Apprentice Information System (RAIS)‑T1 Family File, will facilitate new research on registered apprentices
References
Anderson, R.G. 2007. "How well do wages follow productivity growth?" Economic Synopses 2007 (7). Federal Reserve Bank of St. Louis.
Baldwin, J.R., W. Gu, R. Macdonald, and B. Yan. 2014. Productivity: What Is It? How Is It Measured? What Has Canada's Performance Been Over the Period 1961 to 2012? The Canadian Productivity Review, no. 38. Statistics Canada Catalogue no. 15‑206‑X. Ottawa: Statistics Canada.
Baldwin, J.R., D. Leung, and L. Rispoli. 2014. Canada‑United States Labour Productivity Gap Across Firm Size Classes. The Canadian Productivity Review, no. 33. Statistics Canada Catalogue no. 15‑206‑X. Ottawa: Statistics Canada.
Council of Canadian Academies. 2015. Some Assembly Required: STEM Skills and Canada’s Economic Productivity. Ottawa: Council of Canadian Academies.
Frenette, M. 2014. An Investment of a Lifetime? The Long‑term Labour Market Premiums Associated with a Postsecondary Education. Analytical Studies Branch Research Paper Series, no. 359. Statistics Canada Catalogue no. 11F0019M. Ottawa: Statistics Canada.
Frenette, M., and K. Frank. 2017. Do Postsecondary Graduates Land High‑skilled Jobs? Analytical Studies Branch Research Paper Series, no. 388. Statistics Canada Catalogue no. 11F0019M. Ottawa: Statistics Canada.
Frenette, M., C. Michaud, V. Minaya, P. Oreopoulos, J. Scott‑Clayton, and C. Tsao. Community College Differences that Matter: A Canada‑U.S. Comparison. Paper presented at the Public Policies in Canada and the United States Conference, Gatineau, Quebec, October 27 and 28, 2016.
Laporte, C., and R. Mueller. 2011. The Completion Behaviour of Registered Apprentices:Who Continues, Who Quits, and Who Completes Programs? Analytical Studies Branch Research Paper Series, no. 333. Statistics Canada Catalogue no. 11F0017M. Ottawa: Statistics Canada.
Laporte, C., and R. Mueller. 2012. Certification, Completion, and the Wages of Canadian Registered Apprentices. Analytical Studies Branch Research Paper Series, no. 345. Statistics Canada Catalogue no. 11F0019M. Ottawa: Statistics Canada.
National Center for O*NET Development. n.d. The O*NET Content Model: Detailed Outline with Descriptions. 33 pages. Available at: https://www.onetcenter.org/dl_files/ContentModel_DetailedDesc.pdf (accessed March 12, 2018).
OECD (Organisation for Economic Co‑operation and Development). 2013. Technical Report of the Survey of Adult Skills (PIAAC). Paris: OECD Publishing.
Pokropek, A., and M. Jakubowsky. 2013. "PIAACTOOLS: Stata module to provide PIAAC tools," IDEAS. Statistical software Components S457728. Boston college Department of Economics, revised 31 December 2013. Available at: http://ideas.repec.org/c/boc/bocode/s457728.html (accessed March 8, 2018).
Rao, S., J. Tang, and W. Wang. 2008. "What explains the Canada‑US labour productivity gap?" Canadian Public Policy 34 (2): 163–192.
Statistics Canada. 2013. Skills in Canada: First Results from the Programme for the International Assessment of Adult Competencies (PIAAC). Statistics Canada Catalogue no. 89‑555‑X. Ottawa: Statistics Canada.
Uguccioni, J., A. Sharpe, and A. Murray. 2016. Labour Productivity and the Distribution of Real Earnings in Canada, 1976–2014. CSLS Research Report 2016‑15. Ottawa: Centre for the Study of Living Standards.
UNESCO (United Nations Educational, Scientific and Cultural Organization). 1997. International Standard Classification of Education: ISCED, 1997. Available at: http://www.unesco.org/education/information/nfsunesco/doc/isced_1997.htm (accessed March 12, 2018).
- Date modified: