
Analytical Studies: Methods and References
Innovation Ecosystem Performance Indicators: Review of the Literature
Skip to text
Text begins
Acknowledgements
The authors would like to thank Danny Leung, Amélie Lafrance-Cooke, Ryan Kelly, Meade Conor and Catherine Beaudry for their valuable comments and suggestions.
Abstract
The concept of innovation ecosystems has recently gained increasing interest among researchers, practitioners and policy makers. This article uses a systematic literature review approach by drawing on studies that bring together the most recent knowledge on innovation ecosystem performance indicators. Based on the indicators identified in these studies, the paper builds an integrated framework for analyzing the performance of innovation ecosystems based on their inputs and outputs. The results of this study allow researchers to observe the actors, activities and products that support the development of the ecosystem, including human capital, research and development, institutions, infrastructure, the business environment, financial support, products and innovation linkages, employment, and production.
1 Introduction
As nations have made significant progress in improving their macroeconomic and institutional frameworks, attention has shifted to other engines of productivity, with the emergence of technology and innovation as core elements of the overall development process. One of the drivers of increased prosperity and economic efficiency is the extent to which an economy can adopt existing technologies or develop new technologies to improve the productivity of its industries (see, e.g., Acs and Armington, 2004).
The concept of an innovation ecosystem has been widely discussed in the fields of strategy, innovation, and entrepreneurship, as well as among researchers, with a rapidly growing literature (see, e.g., Gomes et al., 2018). Researchers have developed a series of definitions related to innovation ecosystems, but a common definition would be to consider them as a dynamic set of actors (firms, universities, inventors, etc.), activities and resources, evolving through institutions and relationships, that are important for the innovation performance of a region or country (see, e.g., Granstrand and Holgersson, 2020).
This study explores some of the conceptual indicators used to measure the performance of innovation ecosystems. The aim of this review is to list the indicators most used in the literature on innovation ecosystems. Thus, the common framework does not suggest the construction of new indicators or the selection of ones; it describes the most widely used indicators. These indicators are based on high-quality statistics and sound, measurable analytical principles. However, this literature review considers that the choice of indicators, according to their use in the literature, may be influenced by the period of publication of the articles, or the scope (macroeconomic or microeconomic) of the articles.
This literature review on innovation ecosystems was commissioned by Statistics Canada to address the findings of the science, technology and innovation (STI) Data Gaps Initiative and to respond to the data needs of stakeholders by developing a broader, integrated measurement framework for profiling and mapping innovation ecosystems in Canada (Statistics Canada, 2021). Governments have progressively sought to adopt the concept of innovation ecosystems as a tool for promoting national and regional competitiveness, innovation, and growth.Note 1 For example, the National Research Council (NRC) has also launched a few initiatives since the early 2000s to support the growth of innovative firms clustered around NRC research institutes in different regions of Canada. In 2017, the Canadian government considered actions related to its Global Innovation Clusters in the budget, which include accelerating innovation through the provision of $950 million over five years to support several business-led innovations in superclusters.
These initiatives address the problem of Canada’s poor performance in turning its excellent research and technology into commercialized innovations (Beaudry and Solar-Pelletier, 2020). The shift to a digital economy in Canada since the COVID-19 pandemic has contributed to a surge in technology adoption through more dynamic, IT-intensive and entrepreneurial services.Note 2 It is therefore important to measure the performance of an innovation ecosystem to assess the effectiveness of the implementation of these initiatives. The performance analysis must be conducted over a given period, so the evolution of the performance over time can be observed and investment expenditures to develop innovation ecosystems can be adjusted. It is also important to be able to compare innovation ecosystems to have a precise development strategy.
The paper makes several contributions to the literature on innovation ecosystems. First, it shows how the literature measures the performance of innovation ecosystem indicators by identifying some relevant articles, which may be useful for researchers interested in identifying such measures. Second, the paper proposes a standardized and integrated framework that can be replicated in different contexts, especially in Canada. The common framework includes 8 indicator categories and 38 variables. The framework broadly follows in the footsteps of the Oslo Manual, but it differs by considering the full complexity of an innovation ecosystem and by not limiting innovation solely to the business perspective (OECD and Eurostat, 2018). Third, the paper identifies several research opportunities based on the common innovation ecosystem performance measurement framework.
The remainder of the paper is organized as follows. Section 2 refers to a detailed literature review of innovation ecosystem indicators. Section 3 presents the common innovation ecosystem performance measurement framework. Section 4 presents a discussion of the common framework (with a synthetic example), shares opportunities for further research and concludes the study.
2 Review of innovation ecosystem indicators
The concept of an innovation ecosystem is inspired by theories that study how individuals and organizations interact and collaborate formally and informally. The theoretical underpinnings of the concept cover industry clusters, as well as geographic, social and cognitive proximities, all of which have been shown to have a positive impact on a business’s propensity to innovate. A well-functioning ecosystem is necessary to increase the effectiveness of entrepreneurial and innovative activities, create jobs, and set the conditions for economic prosperity (Teece, 2007). Therefore, it is important to maintain and expand the impact of the ecosystem, which requires mapping and creating metrics to quantify and identify performance gaps, and possibly correct potential blockages (Adner, 2006).
2.1 Innovation input and output
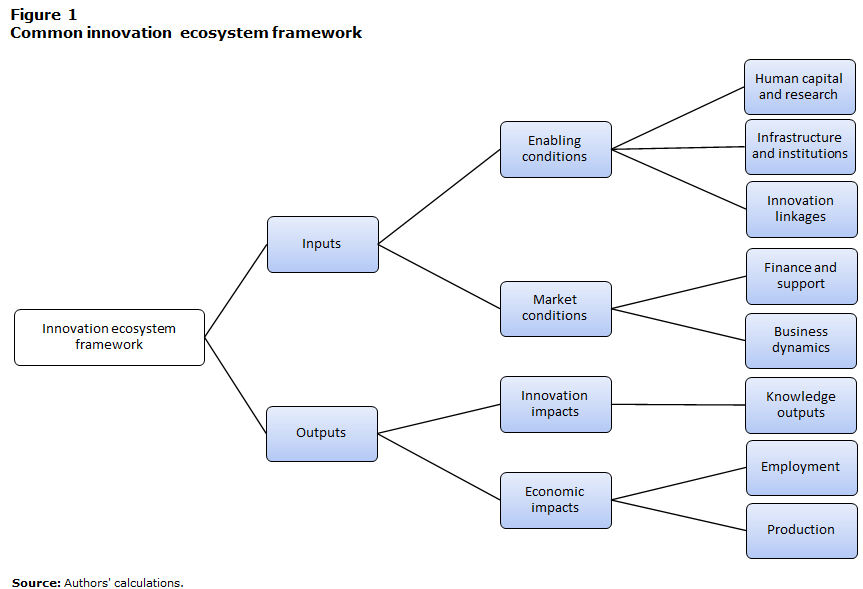
This review proposes a common framework, illustrated in Figure 1, which the reader can use to compare and analyze the different papers studied in the following sections. These papers have analyzed innovation ecosystems in clusters, superclusters, small and large regions, and countries. The figure allows readers to examine the evolution of the frameworks proposed in the literature on innovation indicators, as well as their common features and specificities. These frameworks are built with indicators using reliable statistics and rigorous analysis methods, so that they are measurable and comparable at different geographical scales and over time. Most of these indicators help stimulate policy debates and highlight new dynamics, and this is why they are mostly developed by researchers from government agencies.
The literature on the performance of innovation ecosystems proposes indicators that can be adapted to an input–output structure. The input–output structure is based on the idea that the performance of an innovation ecosystem depends on its importance in terms of employment and production and is moderated by favourable conditions and significant investments. The inputs are the conditions that favour the creation of innovation, and outputs are the direct outcomes and indirect economic improvements that result from innovation.
Description for Figure 1
The title of figure 1 is “Common Innovation Ecosystem Framework”. It gives the components of an innovation ecosystem framework.
Figure 1 consists of two main branches (top and bottom). The main branch at the top (inputs) is made up of the two conditions favoring the emergence of innovations. On the one hand (top), these are enabling conditions, i.e. human capital and research, infrastructure and institutions, and innovation links; and on the other hand (bottom), market conditions, i.e. financial support and business dynamics.
The main branch at the bottom (outputs) is made up of the two conditions accounting for the effect of innovation production. These are, on the one hand (top), innovation impacts, which are knowledge outputs; and on the other hand (bottom), economic impacts, which are employment and local production.
Source: Authors’ calculations.
Innovation inputs are divided into two groups. The first group includes enabling conditions, such as human capital, research and development (R&D), infrastructure, institutions, and innovation linkages. Human capital shapes the degree to which a country’s workforce can participate in innovative activities. Higher levels of human capital are associated with higher levels of innovation and faster technology diffusion (Heunks, 1998; Hadjimanolis, 2000; Barker and Mueller, 2002; Romijn and Albaladejo, 2002; Crescenzi, 2005; Arvanitis and Stucki, 2012). Sen (1999) describes education as a resource for more effective participation in the economic and political life of the nation. This can include improvements in education and training, which create a pool of skilled workers who can assimilate and improve imported technologies or adapt them to local conditions.
The global economy has become more sophisticated, and it is now evident that to be competitive, it is essential to enhance the human capital endowments and research capabilities of the workforce, whose members must have access to new knowledge and be continuously trained in new processes and the use of the latest technologies. The issue of the integration of a country and its private sector into the global economy has also become increasingly important over the past decade, in particular in the discussion of interactions between R&D actors.
In an increasingly interdependent regional and global economy, a more open focus on close linkages between foreign academics, entrepreneurs and innovators improves growth prospects through increased efficiency and productivity (Niosi and Bas, 2001; Santoro and Gopalakrishnan, 2001; Feller et al., 2002; Busom and Fernández-Ribas, 2008; Eom and Lee, 2010; Soetanto and Jack, 2011; Arvanitis and Stucki, 2012). Greater integration into the economy also serves as an important channel for absorbing technological advances, including those from abroad, such as improvements in management practices, and positive effects on human capital development.
Porter (1990, 1998) provides useful information in his analysis of the role of education in bringing an economy’s productive system to full scale. He highlights the importance of close collaboration between educational institutions and potential employers, as universities and other institutions of higher learning are called upon to adapt to the changing needs of industry. An effective R&D system is therefore essential to transfer knowledge and develop innovations (see Jaffe, 1989; Audretsch and Feldman, 1996; Cohen et al., 2002; Keller, 2002; Bottazzi and Peri, 2002; Bode, 2004; Döring and Schnellenbach, 2006; Woodward et al., 2006; Drucker and Goldstein, 2007; Kirchhoff et al., 2007).
The stability of the institutional environment and the quality of infrastructure are seen as critical to private sector development. Good regulation of institutions generally means good public management and, inevitably, fewer wasted resources, the surplus of which could contribute more directly to improved productivity and growth. High-quality infrastructure, especially in machinery and equipment that integrates new technologies such as information and communications technology (ICT) assets, is essential to stimulate innovation and improve the skills of employees, thus contributing to the productivity and competitiveness of businesses (Porter, 1990, 1998; Arthurs et al., 2009).
The second group of innovation inputs is market conditions, which include business dynamics, and finance and support. Firms develop and implement new processes that increase productivity and competitiveness by turning ideas and inventions into new goods and services that feed markets (Porter, 1990). This creates more high-value jobs and contributes to increased national wealth that can support public investments in education, health, infrastructure, and social programs. Innovation plays a key role in the competitiveness of businesses in the modern global economy. With the right knowledge and skills, entrepreneurs can better assimilate cutting-edge technologies and changing business practices, making them more likely to choose innovation-based business strategies that boost their competitiveness.
Firms benefit from a variety of research talent and financial support to design and create new knowledge, products, processes, and other innovation activities and to effectively use ICT to improve productivity. While the decision to pursue an innovation-based business strategy rests with firms, governments, and research organizations play an important role in supporting business innovation by providing financial resources, directly and indirectly. This support provides firms with an environment of reliable access to talent, knowledge, and capital to support idea development and commercialization activities (see Cheshire and Magrini, 2000; Salter and Martin, 2001; Warda, 2001; Bilbao-Osorio and Rodriguez-Pose, 2004; Wolfe and Gertler, 2004; Rodríguez-Pose and Crescenzi, 2008).
Innovation outputs are also divided into two groups. The first group is innovation impacts, which include knowledge outputs. Knowledge outputs are the observed effects of innovations. Some outputs, such as product innovations, can have a direct influence on markets, while other innovations, such as process innovations, improve the quality or marketing of services, thereby enhancing the visibility or reputation of these services (OECD and Eurostat, 2018).
The second group of innovation outputs is economic impacts, which include employment and production. Firms’ investments in innovation are rewarded when they result in increased productivity, greater production capacity, wages, and employment, as well as increased export market share in R&D-intensive industries. Thus, firms that invest in innovation will be more profitable and contribute to the growth of the local economy. Innovation is widely regarded as a driver of productivity, which in turn is essential to higher wages, profitability for investors and improved economic welfare in the long run (Bednarzik, 2000; Kolko, 2000; Acs and Armington, 2004; Hecker, 2005; Cukier et al., 2016).
In the next sections, the review presents studies on innovation ecosystem indicators that analyze their performance from the finest level (cluster) to the broadest level (country). See Appendix Table A.1 for an outline of these studies.
2.2 Cluster innovation ecosystem
Firms gain a competitive advantage not only from their own capabilities, but also from resources and capabilities located in the business environment geographically close to the firm. Some empirical research has shown that clustering can have significant positive effects on firm productivity, innovation, profitability, growth, and resilience (Beaudry and Breschi, 2003; Duranton and Puga, 2004; Boschma, 2005; Gordon and McCann, 2005; Martin et al., 2011; Combes and Gobillon, 2015; Delgado and Porter, 2017). An industrial cluster refers to a group of businesses and organizations in a sector that are geographically located together, are interconnected, share common elements and are complementary to each other (Porter, 1990). This definition of clusters sets the stage for the innovation ecosystem framework used in this analysis (Granstrand and Holgersson, 2020).
The first framework analyzed is that of Arthurs et al. (2009), who propose a simple cluster framework consisting of 34 variables. They analyze the implications of this framework for the current state of eight NRC cluster initiatives by exploring some of the conceptual issues and methodological challenges encountered in the analysis of the NRC-supported clusters.Note 3 The NRC has launched several initiatives to support the growth of innovative firms clustered around their research institutes in different regions of Canada.
Much of the analytical and policy work on clusters has been based on a diverse set of quantitative measures operating at very different conceptual and spatial scales. The authors explain that STI statistics and derived indexes are inadequate in capturing the core structures and relationships that are critical to understanding the state and performance of a cluster. Indeed, these statistics do not reflect emerging technology areas, tacit knowledge, and market linkages. They are sometimes unavailable at the level of geographic disaggregation required for small clusters because of privacy restrictions. Consequently, their methodology for cluster analysis relies mainly on interviews and surveys of firms and innovators because they provide rich information on how individual clusters perform.
Their framework is built on earlier work (Porter, 1990, 1998) and incorporates the findings of the Innovation Systems Research Network regarding clusters in the Canadian context (Wolfe and Gertler, 2004). Innovation inputs consider enabling conditions and investments by firms to develop their innovation capabilities. The authors consider the conditions of the cluster environment that influence its performance, such as access to skilled human capital; current infrastructure, including the quality of transportation; and regulations that shape the business climate. Firms’ investments include support from organizations (such as NRC and government policies), customers and competitors in the development of the innovation ecosystem (here the cluster). The authors also emphasize the importance of interactions within the cluster in terms of innovation activity and add an international dimension to this interaction.
Regarding the output measures that characterize cluster performance, the authors measure cluster employment in terms of the number, size and structure of firms by adding spin-off firms. They consider the exports of firms and their growth in terms of production. They complete their framework with a measure of cluster dynamism in terms of direct innovation outputs and R&D spending.Note 4
One feature of this framework, compared with others, is that it views innovation ecosystems as a dynamically evolving system with life cycles that can be latent, developing, established or transformational. The needs and interactions of cluster actors differ according to the stage of development of the cluster, and cluster policies must evolve accordingly, according to the authors. Furthermore, compared with the present paper’s common framework, they do not consider the investments in R&D that are important to guarantee an efficient innovation capacity for the ecosystem. They also do not consider ICT assets as a useful infrastructure for innovation that can help companies and ecosystem actors generate ideas, be productive and create innovation. Although their set of indicators is relatively simple to understand, the indicators are based on opinions and generally do not generate quantitative results and are resource intensive. In addition, the authors do not explain precisely how to construct many of their variables, making replication difficult.
The next framework analyzed is that of Beaudry and Solar-Pelletier (2020), which focuses on superclusters. Superclusters are much closer to the concept of innovation ecosystems because they are generally more technology oriented.
Beyond the geographical proximity of interconnected businesses within a sector, the supercluster considers the density of a knowledge network of actors around a core technology and the ability to collaborate with customers, suppliers, and universities. The authors’ framework, from Innovation, Science and Economic Development Canada, focuses on disruptive technologies such as big data analytics, artificial intelligence, advanced materials, additive manufacturing and blockchain. This interest is also driven by the Canadian government’s Global Innovation Clusters program to resolve Canada’s innovation paradox, which highlights the difficulty of translating scientific and technological performance into effective solutions and commercial success. Supercluster partners will be able to help strengthen regional innovation ecosystems, improve the growth and competitiveness of participating businesses, and maximize economic benefits (including well-paying jobs and prosperity for Canada) through the adoption of new and potentially disruptive technologies within innovation ecosystems (ISED, 2024).
Thus, according to the authors, Canada’s innovation policy framework must be rethought to adapt to new ways of organizing and governing innovation. Their proposed framework consists of 15 variables. This framework includes only two innovation inputs, namely the firm’s R&D expenditures, to measure the firm’s commitment to innovation. However, it includes several measures of innovation output because the aim of the study was to focus on direct measures of innovation to compare different superclusters. The authors measure the innovation inputs by the number of collaborative projects or professional actors working together on the same project, between private, academic, and public organizations. They also measure business investment in R&D. The authors propose measuring innovation outputs by the capacity of firms to produce effective innovation linkages and by their ability to build the best teams and mobilize the right set of resources to foster innovation. Second, they consider a measure of knowledge output as the number of new products or processes.
Furthermore, the authors include the measures of employment and production of their innovation ecosystem in their framework. On the one hand, they look at how the ecosystem grows in terms of jobs and firms created, and high-growth firms that contribute to more than 50% of new jobs and sales in given sectors. On the other hand, they measure the output of the ecosystem by its ability to create wealth and increase economic growth and competitiveness through a rise in exports, productivity, and gross domestic product (GDP).
As mentioned above, the conditions for innovation are not developed in this framework compared with the present study’s common framework. The authors are limited to the sole investment of firms in R&D, which is not sufficient to understand the environment necessary for the creation of innovation in ecosystems. The authors recognize that this framework does not consider the human capital devoted to R&D or to tasks related to commercialization, and the mobility of the labour force in the innovation process. They also recognize the difficulties of their indicators in measuring the successful adoption of technologies that is likely to occur through informal relationships and the sharing of tacit knowledge.
2.3 Regional innovation ecosystems
The indicators in the previous frameworks are measured either at the firm level, to assess the performance of firms within clusters relative to more isolated firms, or at the cluster level, to examine the overall performance of the organizations that form a cluster. However, it is beneficial for both levels to be examined together to assess the extent to which their agreement is beneficial to the business and its environment. This is what the regional ecosystem framework allows, by promoting coherent and effective coordination of innovation that can take place at the subnational level (e.g., provincial, regional or city level). Thus, it enables an alternative structure of linkages and relationships beyond geographically bounded clusters.
Cukier et al. (2016) are mapping the innovation ecosystem in eastern Ontario to better understand the breadth of innovation services that can help build a competitive advantage to attract businesses and investors and help stimulate the business environment. Their framework, called the Innovation Ecosystem Scorecard, is built on an exhaustive document review, a comprehensive data analysis and discussions with key stakeholders to develop a better overall understanding of the ecosystem’s drivers, with a particular focus on the dynamics of innovation in small communities.Note 5 Since the authors are interested in innovation ecosystems in small regions, they do not look at the innovation linkages and the support and funding provided in these regions, which are generally lower, on average. They focus more on providing a wider range of indicators that can describe more important aspects of human capital, economic dynamics, productivity, and employment, and economic well-being than previous frameworks.
They build their framework on an analysis inspired by the U.S. Economic Development Administration’s framework based on business and economic development data, including job supply and demand (U.S. Economic Development Administration, 2010). This approach has allowed them to develop an inventory of key players and intermediaries in the ecosystem, including investors, large employers, incubators, business service providers and government agencies. They also use an assessment of innovation models and methods such as the Global Entrepreneurship Monitor to understand the conditions that support entrepreneurship and innovation performance, such as the availability of financing, government policies and programs, education, R&D transfer, business and physical infrastructure, and cultural and social norms. Finally, the authors supplement their study with consultations with key stakeholders to understand the components of the ecosystem and their assessment of current programs and needs.
They developed a framework consisting of 22 variables. This framework proposes a diverse set of variables whose purpose is to measure the inputs and outputs of innovation. Among the most extensive categories are (1) human capital, which examines the characteristics of the regional population and workforce (high educational attainment, young adults, and innovation-related occupations and jobs); (2) economic dynamics, which addresses local business conditions (size of existing establishments and churn of establishments); and (3) employment and output, which assesses economic growth, regional attractiveness and economic well-being (high-tech employment, population and wealth growth, worker and owner earnings, etc.).
However, compared with the present study’s common framework, this framework does not develop (or develops very few) indicators measuring research assets within human capital or ICT assets within the infrastructure supporting innovation activities. Neither does it develop direct measures of innovation, or the resources and funds available to entrepreneurs and firms to innovate.
The framework used by Cukier and co-authors, from the U.S. Economic Development Administration, has been updated with a more extensive version. This version is presented by Slaper et al. (2016), from the Indiana Business Research Center, who propose a set of almost 70 variables that can help regional leaders reach a strong consensus on regional strategic direction in the United States. The choice of variables was based on a broad coverage of the empirical and theoretical literature. Since it is a more regional definition of the term “innovation ecosystem,” it encompasses a larger dimension of the network concept, with innovation sites, incubators, university–business research partnerships, investment capital networks and relevant workforce development programs.
The proposed indicators are more comprehensive in each of the subcategories. The framework the authors propose also uses categories based on innovation inputs and outputs to measure innovation capacity and production potential. The inputs include human capital and knowledge creation, which indicates the extent to which a region’s population can engage in innovative activities. They also include business dynamics, which are composed of a measure of firm dynamics that assesses the competitiveness of a region by tracking the entry and exit of individual firms, and a measure of firm profile that assesses local business conditions and the resources available to entrepreneurs and firms.
Outputs are divided into two categories: the employment and productivity index that describes economic growth, regional attractiveness or direct outcomes of innovative activity, and the economic well-being index that explores living standards and other economic outcomes. Compared with Cukier et al. (2016), the authors add a measure of local business conditions and resources available to entrepreneurs and firms. In addition, they add a state context and social capital index. The former identifies the financial support and useful business dynamics that help understand the innovative environment. The l identifies the regional advantages of collaborative networks that underpin a community’s ability to address its challenges. These two additions remain optional, because the theory behind them is still under development and the data are not available at fine spatial scales, especially the social capital data. Therefore, in the paper, only the first set of state context variables has been included.
The variables measuring the current level of human capital, investment in innovation, and the performance of innovation activity in terms of employment and output are more varied and consider more aspects than the previous framework. However, compared with the present study’s common framework, the authors do not consider innovation linkages; however, they briefly discuss them in the social capital index.
2.4 Country innovation ecosystem performance
This section analyzes proposed frameworks on the performance of innovation ecosystems at the country level. It places greater emphasis on the role played by governments, the infrastructure and institutional framework, and international cooperation to improve local innovation production. These studies therefore support investments to create globally competitive scale and capacity in key areas of strength and opportunity, as well as a seamless integration of organizations, activities, and funding mechanisms across the innovation ecosystem.
Cannon et al. (2015) propose an analytical framework from the Science, Technology and Innovation Council that examines 28 indicators measuring the performance of innovation ecosystems in Canada. They present an innovation ecosystem framework in which the government plays a central role. The framework proposes greater government investment with innovation support programs designed to encourage collaboration across the innovation ecosystem. Governments play an important role in supporting and encouraging business innovation. They should therefore routinely provide more direct support to high-risk, high-reward business R&D, especially in industries of economic importance to Canada. Higher education institutions should also leverage government programs to increase their research and innovation capacity.
Thus, the authors emphasize human capital, research and business resources, and innovation support and finance as important inputs for innovation. They place a strong emphasis on R&D expenditures by business enterprises that are most closely linked to product and process innovation. Increased investment in R&D must be accompanied by increased investment in other knowledge assets, including talent in the business, engineering, science, and health sectors.
The authors measure the performance of innovation ecosystems on innovation output in large businesses and in high-growth small and medium-sized enterprises (SMEs) with the potential to become major players. They recommend increasing the number of large innovative firms to improve future competitiveness and employment growth, because large firms are often more productive and tend to invest and export more than small firms.
However, their framework has little regard for ICT assets in infrastructure and institutions and accounts very little for ICT assets and the business dynamics needed to develop coherent and effective innovation capital. Moreover, with the focus on the inputs of innovation, the outputs of innovation are not well developed, especially with respect to the linkages between innovations and the effect on employment.
In their framework, similar to the present study’s common framework, Hollanders and Es-Sadki (2021) focus on the conditions that capture the key drivers of innovation performance in 27 European countries and distinguish between human resources, attractive research systems and infrastructure through digitization. They also focus on investments, which capture investments in the public and business sectors, distinguishing between funding and support, business investments, and the use of IT.
This paper follows in the footsteps of the Oslo Manual, which mainly considers innovation from the firm’s point of view (OECD and Eurostat, 2018). Although firms play an important role in innovation, universities, non-governmental organizations, not-for-profit organizations, autonomous researchers, and others are also known to contribute to the performance of an innovation ecosystem. The common framework reflects this complex picture.
Innovation outcomes are measured by innovation activities that capture different aspects of innovation in the business sector and distinguish between innovators. They also include impacts that capture the effects of firms’ innovation activities and distinguish between impacts on employment and impacts on output, such as sales and environmental sustainability. Using this set of variables, the authors classify the innovation performance of European countries as innovation leaders, strong innovators, moderate innovators, and emerging innovators.
In addition to these variables, a contextual analysis of the impact of structural differences between countries was assessed. To better understand the differences in performance between the innovation indicators used in the main measurement framework, a set of contextual indicators was added. These contextual indicators measure differences in the performance and structure of the economy, business activities and entrepreneurship, the introduction of innovation, the institutional and legal environment, climate change performance, and demographics. These variables were added to the authors’ framework, including those that allow for international comparison, bringing the number of variables to 51. This provides the authors with a framework whose variables are distributed in a balanced way between the different categories of innovation inputs and outputs, allowing them to consider a varied set of key concepts related to innovation ecosystems.
The Organisation for Economic Co-operation and Development (OECD) (2017) has also proposed a framework similar to the present study’s common framework, with the aim of helping governments of OECD and other countries (60 countries in total) to design more effective science, innovation and industry policies in a rapidly changing digital age. The selected indicators were developed to rely on high-quality statistics and robust analytical principles and be measurable internationally, over time, and with room for improvement. This framework focuses on the impact of knowledge and digital transformation in developed country economies in the context of today’s rapidly changing digital technology landscape. It proposes a set of over 80 indicators to measure the performance of innovation ecosystems. This set of indicators is derived from previous work by academics, the OECD, Eurostat and the World Bank.
Within innovation inputs, this study focuses on human capital through knowledge, talent and skills and examines the knowledge assets that many businesses and governments see as current and future sources of long-term sustainable growth. The authors also develop indicators measuring research excellence and collaboration to help inform the policy debate through a series of metrics on the variety and nature of knowledge dissemination mechanisms in the digital age. In addition, they consider business innovation by exploring the dynamism of the business sector and the framework conditions essential for innovation.
Unlike other frameworks, this one adds leadership and competitiveness by including indicators measuring how countries seek to develop their competitive strengths and the extent to which economies can integrate and specialize along global value chains. This framework, however, is not sufficiently balanced in terms of variables in the categories of innovation inputs and outputs, compared with the previous one. The study places a strong emphasis on innovation-enabling investments, especially in ICT assets, and completely omits tangible infrastructure and innovation-enabling institutions, especially for a national study.
López-Claros and Mata (2010) developed a set of 61 variables that allowed them to construct the Innovation Capacity Index to assess how successful countries have been in developing an innovation-friendly climate capacity. The authors combine indicators used by various international organizations, including the European Commission’s Joint Research Centre, the International Monetary Fund, the OECD, the United Nations and the World Bank. This informs policy makers and entrepreneurs around the world (131 countries) about the wide range of country-specific factors that underpin innovation.
Like the previous frameworks, the authors’ framework presents indicators that can be categorized into inputs and outputs of innovation. The authors present the factors that are essential to creating an environment conducive to innovation and the types of initiatives that will contribute in some way to boosting productivity and, hence, economic growth.
In terms of innovation inputs, the authors emphasize the institutional environment that favours innovation, notably through good governance, a good country policy assessment, and a regulatory and legal framework that favours entrepreneurship. In addition, they note the importance of a good level of human capital, training, and social inclusion. Well-developed human capital resources increase the potential for innovation, which in turn increases a country’s ability to innovate and achieve sustained productivity growth. Finally, the authors stress the importance of adopting and using ICT and investing in R&D. Regarding the outputs of innovation, the emphasis is only on direct measures of innovation and knowledge products, such as patents and trademarks.
This framework is very well informed in terms of infrastructure variables and institutions. However, compared with the present study’s common framework, it lacks measures of the entrepreneurial conditions that guarantee a good innovation capability. In addition, the authors omit measures of employment and innovation linkages from their framework. Also, some underlying factors (e.g., budget deficit, education spending and R&D intensity) are difficult to measure, requiring surveys to capture perceptions of firms or civil society.
The World Intellectual Property Organization (WIPO) (2021) provides a framework, similar to the present study’s common framework, based on new data and analysis on the state of global innovation. This framework allows readers and policy makers to compare the performance of the innovation ecosystems of over 132 economies.
As such, the framework is designed to provide the most comprehensive picture of innovation possible, with the index comprising approximately 80 indicators, including measures of each economy’s policy environment, education, infrastructure, and knowledge creation. It has the advantage of being supported by empirical studies examining the choice of indicators as inputs and outputs of innovation. This is notably the case of Araujo Reis et al. (2021), who examine the relationship between innovation input and output with the Global Innovation Index. They show that innovation input has a significant and positive effect on innovation outputs in countries.
The WIPO framework’s translation of an economy’s investments in innovation—in the form of R&D, education, infrastructure, and strong institutions supporting innovative activities—into innovation outcomes is no small task. This study develops an effective innovation system that balances knowledge creation, exploration, and investment (the inputs of innovation) with the generation of ideas and technologies for application, exploitation and impact (the outputs of innovation).
The WIPO study is unique in that it was developed and presented during the COVID-19 pandemic, which was a trigger for innovation in economies, including the manufacture and implementation of vaccines, teleworking, and online services. According to the authors of this study, the key indicators that have been most affected by the pandemic are science, global innovation products, scientific publications, R&D expenditures, international patent filings and venture capital (VC) operations.
3 Innovation ecosystem performance measurement framework
This section returns in more detail to the composition of the common framework proposed in Figure 1. The different studies examined above, which cover fine units such as clusters to very large units such as countries, allow more than 400 indicators of innovation performance measures to be gathered, divided between innovation inputs and outputs.
After similar indicators were combined by removing duplicates and overlaps, the indicators were ranked according to bibliometric impact importance. The nine studies presented above, as well as the sources used in these studies, are considered to justify the choice of indicators. The sources employed to validate the use of an indicator are empirical or theoretical studies that have clearly demonstrated that an indicator has an effect on innovation (innovation input) or that an indicator is affected by innovation (innovation output). The most relevant sources, cited at least 100 times in the literature, are retained.Note 6 The more a journal article is cited, the more it can be said to have influenced subsequent scientific research. This leaves 153 papers.
The indicators are then classified based on those 153 papers, from the least used to the most used. Indicators with fewer than 5 citations are weakly used, indicators with 5 to 10 citations are moderately used, and indicators with more than 10 citations are strongly used. The range of four items is the standard deviation and the mean of the distribution of the number of items per indicator. The minimum number of articles cited per indicator is 1, and the maximum number of articles cited per indicator is 20, for a total of 97 indicators listed. From the set of 97 indicators, 12 are heavily used, 26 are moderately used and 59 are lightly used in the literature. In the proposed common framework, only medium- and high-use indicators are included to reflect their role in the literature. However, on request, users can access an appendix containing all the indicators investigated in the literature in this study, to view low-use indicators and adapt them to the context of their analysis. This leaves 38 variables, as illustrated below.
Common innovation ecosystem indicators
- Inputs
- Enabling conditions
- Human capital and research
- Infrastructure and institutions
- Innovation linkages
- Business–university collaboration
- Business local collaboration
- Business international collaboration
- Market conditions
- Business dynamics
- Finance and support
- Enabling conditions
- Outputs
- Innovation impacts
- Knowledge outputs
- Patent applicationsNote †
- Product and process innovations
- Designs, copyrights and trademarks
- Knowledge outputs
- Economic impacts
- Innovation impacts
Notes: The rest of the indicators are moderately used in the literature. R&D = research and development; ICT = information and communications technology.
Source: Authors' calculations.
End of text boxThe fact that the majority of indicators are weakly replicated by other studies may indicate that they either are newly used or reflect contextual objectives of researchers. For example, some recent studies consider new indicators, such as those related to the effect of innovation on environmental performance. Furthermore, the availability of a variable does not mean that a particular indicator is robust. Some variables will be more widely used because they are more widely available, introducing potential bias in the results of the analysis.
To understand the bias, two alternative classifications are proposed. The first classification includes only recent papers, from the last 10 years, reducing the number of papers analyzed from 153 to 25. Indicators with fewer than three citations are weakly used, indicators with three to five citations are moderately used and indicators with more than five citations are strongly used. The interval of two between classes is the standard deviation of the distribution of the number of papers per indicator (the mean is three). The minimum number of articles cited per indicator is 1, and the maximum number of articles cited per indicator is 8, for a total of 81 indicators listed.
The number of moderately or heavily used indicators has dropped from 38 to 32. This new ranking, as presented in Appendix B, does not change the innovation outputs in relation to the common framework. However, it does change the innovation inputs, especially the indicators measuring the quality of infrastructure and institutions, which go from five to two. The indicators of market conditions also decrease. The measures of business incubators, start-ups and public spending on R&D disappear. In sum, considering only recent studies restricts the number of indicators without adding indicators different from the common framework. The common classification is not biased by older articles.
The second classification considers the fact that macro variables are generally easier to obtain than micro analyses, and this could result in a higher number of macro studies. This would result in more macro variables, which are less suitable for an analysis of ecosystem performance at the regional level. Therefore, a bibliometric analysis was conducted using only the microanalysis of the innovation ecosystem to see whether the list of indicators selected would be different.
The new classification reduces the number of papers analyzed from 153 to 142. Indicators with fewer than five citations are weakly used, indicators with four to eight citations are moderately used and indicators with more than eight citations are strongly used. The interval of three between classes is the standard deviation of the distribution of the number of papers per indicator (the mean is four). The minimum number of articles cited per indicator is 1, and the maximum number of articles cited per indicator is 16, for a total of 56 indicators listed.
The number of moderately or heavily used indicators has dropped from 38 to 30, as presented in Appendix C. A definite bias toward macroeconomic indicators is seen. Although there are only 11 macroeconomic studies, these construct 42% of the total indicators listed, 24% of the moderately or heavily used indicators. In particular, the enabling conditions variables decrease significantly from 16 to 8. The rest of the indicators remain more or less the same, and this classification adds a new one, the measure of establishment churn, which becomes an average indicator used in the literature.
The following points briefly discuss how to measure the indicators, especially in the Canadian context. For all the indicators described here, data sources for measuring them are available upon request from Statistics Canada at the national, provincial and sometimes municipal levels.
3.1 Human capital and research
Education expenditures: Spending on education is a good indicator of the priority and level of commitment a region places on education and human capital development, which have positive implications for innovation. Education provides the basic and advanced knowledge and skills that help individuals pursue and succeed in higher education, research and employment in innovation-related fields (see López-Claros and Mata, 2010; Cannon et al., 2015; Slaper et al., 2016; OECD, 2017; WIPO, 2021). To better represent innovation, education spending can be restricted to specific areas such as tertiary education or science, technology, engineering and mathematics (STEM) programs.
International students: International students reflect the importance of academic diversity as an active channel for the dissemination of knowledge (see Cannon et al., 2015; Slaper et al., 2016; OECD, 2017; Hollanders and Es-Sadki, 2021; WIPO, 2021). International students can be measured as the number of students from foreign countries. This number may contain international PhD students in particular. Not all international students stay—they may choose to return to their home country after graduation. Therefore, it may be better to count the number of postgraduation work permit applicants who stay and work in Canada after graduation.
Knowledge programs: These programs indicate the quality of learning outcomes and creative thinking of human capital (see López-Claros and Mata, 2010; Cannon et al., 2015; OECD, 2017; Hollanders and Es-Sadki, 2021; WIPO, 2021). This indicator can be measured as the Programme for International Student Assessment scales in reading, mathematics and science or Programme for the International Assessment of Adult Competencies scales in numeracy, literacy and problem solving of the 15-year-old population or workers. However, this indicator is more suitable for a country innovation ecosystem.
Researchers and technicians in R&D: Researchers and other R&D personnel are an essential input to the performance of R&D. Researchers are professionals involved in the design or creation of new knowledge in business, government, higher education and private non-profit organizations. They conduct research and improve or develop ideas, models, techniques, tools, software or operating methods. The number of researchers can be weighted by population (see Porter, 1990, 1998; Wolfe and Gertler, 2004; Arthurs et al., 2009; López-Claros and Mata, 2010; Cannon et al., 2015; OECD, 2017; WIPO, 2021).
Scientific and technical articles: Publications are a measure of the effectiveness of the research system, as collaboration increases scientific productivity (see Cannon et al., 2015; Slaper et al., 2016; OECD, 2017; Hollanders and Es-Sadki, 2021; WIPO, 2021). This indicator can be measured as the number of scientific publications with at least one foreign-based co-author. It can be measured as the number of scientific and technical journal articles per million people indexed in the journal database, published in the following fields: physics, biology, chemistry, mathematics, clinical medicine, biomedical research, engineering and technology, and earth and space sciences.
Tertiary education: Government policy makers are especially interested in the supply of scientists, engineers and ICT experts because of their direct involvement in technical activities and the ongoing digital transformation (see Heunks, 1998; Hadjimanolis, 2000; Barker and Mueller, 2002; Romijn and Albaladejo, 2002; Wolfe and Gertler, 2004; Crescenzi, 2005; Arthurs et al., 2009; Atkinson and Mayo, 2010; López-Claros and Mata, 2010; Arvanitis and Stucki, 2012; Cannon et al., 2015; Cukier et al., 2016; Slaper et al., 2016; OECD, 2017; Hollanders and Es-Sadki, 2021). STEM graduates are often employed in management positions. Tertiary education can be measured as university graduates, especially from STEM programs.
University-based knowledge spillovers: This measure estimates how scientific knowledge spreads from universities to neighbouring regions. Since universities are less competitive and profit-driven than industries, their knowledge should spread more widely between institutions and regions. This indicator could also predict the level of patenting in a region. University knowledge spillovers are measured by the distance between the university and the chosen region, or by the number of universities in cities (see Audretsch and Feldman, 1996; Anselin et al., 1997; Breschi and Lissoni, 2001; Salter and Martin, 2001; Cohen et al., 2002; Keller, 2002; Bode, 2004; Woodward et al., 2006; Drucker and Goldstein, 2007; Simonen and McCann, 2008; Casper, 2013; Slaper et al., 2016; WIPO, 2021).
Young adult population: The young population is guaranteed to include university students and working professionals, who are the most likely to engage in innovative activities. These individuals are also more likely to be less risk averse and more entrepreneurial. Moreover, the growth in the younger population suggests that new residents are likely to enhance the innovative and entrepreneurial aspects of the core community (see Slaper et al., 2011; Cannon et al., 2015; Cukier et al., 2016; Slaper et al., 2016; Hollanders and Es-Sadki, 2021).
3.2 Infrastructure and institutions
Broadband connections: Broadband supplies high-speed Internet connections to businesses and consumers. Several studies suggest that broadband capacity has a significant positive effect on economic performance (see Crandall et al., 2007; López-Claros and Mata, 2010; Lehr et al., 2006; Cukier et al., 2016; Slaper et al., 2016; OECD, 2017; Hollanders and Es-Sadki, 2021). Access to high-speed Internet allows businesses and individuals to collaborate from virtually any location. Broadband connections can be measured by the number of residential broadband connections per 1,000 households.
Doing business index: This index reflects businesses’ perceptions of the ease of starting a business in their region (see Porter, 1990; Arthurs et al., 2009; López-Claros and Mata, 2010; Hollanders and Es-Sadki, 2021; WIPO, 2021). This index would be based on the simple average of the scores for each of three indicators, such as all the procedures officially required, or commonly undertaken in practice, for an entrepreneur to formally start and operate an industrial or commercial enterprise, as well as the time and cost to complete these procedures.
ICT investment: ICT skills are highly relevant for innovation in an increasingly digital economy (see Arthurs et al., 2009; López-Claros and Mata, 2010; Grundke et al., 2017; OECD, 2017; Hollanders and Es-Sadki, 2021; WIPO, 2021). The share of investment in ICT is an indicator of the overall development of employee skills. It can be measured in monetary terms as external IT spending (technology products purchased) and internal IT spending (custom software and training), as well as spending on telecommunications and other office equipment (as a percentage of GDP). It can also be measured in numbers by the number of ICT specialist employees.
Local availability of capital: Local availability of capital indicates the ability of local banks to lend to businesses. Areas with a higher concentration of local bank deposits are more likely to have higher rates of entrepreneurship, innovation, new business creation and overall economic success in a region (see Porter, 1990; Wolfe and Gertler, 2004; Benfratello et al., 2008; Arthurs et al., 2009; Kerr and Nanda, 2009; Ayyagari et al., 2011; Slaper et al., 2016; WIPO, 2021). Local availability can be measured by the share of local deposits at all banks in the region, which serves as a predictor of local lending, or total capital expenditures.
Logistics performance: Logistics performance can be measured as an index assessing the perception of businesses and residents on the quality of trade and transport infrastructure and the competence and quality of logistics services (see Porter, 1990, 1998; Arthurs et al., 2009; López-Claros and Mata, 2010; Hollanders and Es-Sadki, 2021; WIPO, 2021).
3.3 Innovation linkages
Business–university collaboration: Innovation collaboration is a platform for disseminating knowledge and accelerating innovation development (see Porter, 1998; Arthurs et al., 2009; OECD, 2017; Beaudry and Solar-Pelletier, 2020; WIPO, 2021). Academic collaboration involves the active participation of universities and businesses. This indicator can be constructed from a survey question to businesses on the extent to which they collaborate with universities in R&D. It can also be measured by the number of research publications co-authored by universities and private businesses.
Business local collaboration: Local collaboration involves the active participation of businesses with other businesses and institutions, excluding academic organizations (see Porter, 1998; Sorenson and Fleming, 2004; Singh, 2005; Sorenson et al., 2006; Fleming et al., 2006; Arthurs et al., 2009; OECD, 2017; Beaudry and Solar-Pelletier, 2020; Hollanders and Es-Sadki, 2021). This indicator can be constructed from a survey question about the number of firms (usually innovative SMEs) that had cooperation agreements on innovation activities with other firms or institutions during the recent survey period. It can also be measured by the number of research publications co-authored by private or public-private firms.
Business international collaboration: International innovation collaboration refers to active cross-border participation in innovation collaboration (see Arthurs et al., 2009; OECD, 2017; Beaudry and Solar-Pelletier, 2020; WIPO, 2021). This indicator can be constructed from a survey question asked to businesses about the extent to which they collaborate with foreign businesses or institutions. It can also be measured by the number (or share) of co-inventions (or co-publications) in patent families with inventors located in at least two different countries.
3.4 Business dynamics
Business expenditures on R&D: Business R&D spending reflects the participation of businesses in the creation of new knowledge, which leads to greater economic growth in the region through higher patenting and productivity levels (see Audretsch and Feldman, 1996; Cohen et al., 2002; Keller, 2002; Bottazzi and Peri, 2002; Bilbao-Osorio and Rodriguez-Pose, 2004; Gulbrandsen and Smeby, 2005; Cannon et al., 2015; Slaper et al., 2016; Beaudry and Solar-Pelletier, 2020; OECD, 2017; Hollanders and Es-Sadki, 2021; WIPO, 2021). Business expenditures on R&D can be expressed as the share of total business R&D expenditure in GDP.
Business incubators: Incubators provide services to new businesses in the area and help them to survive and succeed, by transferring a flow of knowledge that increases their capacity for production and innovation (see Mian, 1996; Etzkowitz, 2002, 2003; Chan and Lau, 2005; Grimaldi and Grandi, 2005; Hansson et al., 2005; Löfsten and Lindelöf, 2005; Markman et al., 2005; Aerts et al., 2007; Slaper et al., 2016; Hollanders and Es-Sadki, 2021). This measure can be calculated by the proportion of business incubators in a region.
Establishment size: Small firms are highly adaptable and can easily change their processes to incorporate new ideas or technologies (see Acs and Audretsch, 1988, 1990; Porter, 1990; Arthurs et al., 2009; Cukier et al., 2016; Slaper et al., 2016; OECD, 2017). Large firms would contribute positively to innovation through the increased availability of funds for R&D (see Acs and Audretsch, 1988; Porter, 1990; Hicks and Hegde, 2005; Arthurs et al., 2009; Cukier et al., 2016; Slaper et al., 2016). Large and small establishments can be measured as the number of establishments with fewer than 50 employees (small firms) or more than 500 employees (large firms) per 10,000 workers. However, there may not be many differences between regions in terms of small businesses per employee. It may be relevant to consider the percentage of employees in small versus large businesses, which varies more from region to region.
High-tech industry employment: Innovative areas contain businesses that require a highly skilled and specialized workforce. Employees in high tech provide services to consumers directly, such as telecommunications, and provide raw materials to innovative businesses in all sectors of the economy (see Audretsch and Feldman, 1996; Klepper, 1996; Kolko, 2000; Feser, 2003; Florida, 2003; Wolfe and Gertler, 2004; Koo, 2005; Arthurs et al., 2009; Belussi and Sedita, 2009; Tödtling et al., 2009; Neffke et al., 2011; Neumark et al., 2011; Cannon et al., 2015; Cukier et al., 2016; Slaper et al., 2016; OECD, 2017; WIPO, 2021). This is knowledge-intensive service employment, represented by the sum of those in managerial, professional and technical positions as a percentage of the total people employed.
Industry concentration: The concentration measure can help determine the extent to which a country’s industrial system is competitive or uncompetitive in different industrial subsectors. Some studies show that the market structure significantly influences the production of innovations. This market structure can be competitive or poorly diversified and concentrated (see Porter, 1998, 2000; Stuart and Sorenson, 2003; Wolfe and Gertler, 2004; Feldman et al., 2005; Arthurs et al., 2009; Glaeser and Kerr, 2009; Delgado et al., 2010, 2014; Slaper et al., 2016; OECD, 2017; WIPO, 2021). This measure of concentration can be measured in different ways. It can be measured by the Herfindahl-Hirschman Index for the national industry, defined as the sum of the squared shares of the subsectors, usually in total manufacturing output. It can also be measured by key indicators such as the number of competitors, the relative size of competitors (larger or smaller than the respondent firm or multinationals), or qualitative measures of the intensity of competition in the firm’s market.
Institutionally based start-ups: Start-ups are actively involved in licensing technologies produced by universities and other research institutes to create new and improved goods and services. Technology transfer is an inherently innovative activity, representing the transformation of new knowledge into economic, or marketable, knowledge. A high rate of institutionally based start-ups means more concentrated innovation activity (see Porter, 1990; Almeida and Kogut, 1997; Thurik and Wennekers, 1999; Carree and Thurik, 2003; Audretsch and Keilbach, 2004; Acs and Plummer, 2005; Audretsch and Lehmann, 2005; Slaper et al., 2016; OECD, 2017). Institutional start-ups can be measured by the number of entities that universities and other non-profit research institutions have formed.
International workers: International workers can raise the level of human capital and foster technological progress. They can increase consumption, living standards and incomes in the long run. Their presence, in particular that of international STEM workers, is correlated with high rates of entrepreneurship and innovation (see Wadhwa et al., 2008; Hart and Acs, 2011; Kerr, 2013; Langdon et al., 2013; Slaper et al., 2016). International workers can be measured as the number of inbound migrant workers relative to the working-age population, particularly in STEM occupations. STEM workers are better positioned to use existing innovations and create new ones.
Proprietorship rate: High proprietorship rates are associated with greater employment growth and entrepreneurial activity conducive to innovation (see Thurik and Wennekers, 1999; Audretsch and Thurik, 2001; Thurik et al., 2008; Romero and Martínez-Román, 2012; Acs et al., 2013; Slaper et al., 2016). The proprietorship rate can be measured as the number of proprietors relative to the total number of employed people. It can also be measured by the proportion of self-employment in the region.
3.5 Finance and support
Academic expenditures on R&D: R&D within universities is a good predictor of the level of patenting. It predicts knowledge transfer to the private sector and subsequent innovation (see Audretsch and Feldman, 1996; Cheshire and Magrini, 2000; Cohen et al., 2002; Keller, 2002; Bottazzi and Peri, 2002; Bilbao-Osorio and Rodriguez-Pose, 2004; Bode, 2004; Woodward et al., 2006; Bercovitz and Feldman, 2007; Drucker and Goldstein, 2007; Cannon et al., 2015; Slaper et al., 2016; OECD, 2017). It can be measured as the total expenditure on education (current expenditure, capital expenditure and transfers) as a percentage of GDP.
Foreign direct investment: Foreign direct investment increases competition and gives rise to positive externalities and technology spillovers, thereby increasing dynamic efficiency (see Sjöholm, 1999; Branstetter, 2006; Blalock and Gertler, 2008; López-Claros and Mata, 2010; Slaper et al., 2016; Hollanders and Es-Sadki, 2021; WIPO, 2021). This indicator helps determine the extent to which foreign or domestic firms invest in the region relative to others, improves knowledge and technology transfer, describes the openness of a region’s economy and community, and provides insights into a firm’s ability to improve productivity. Foreign direct investment can be measured as the average over recent years of net inflows characterized by the sum of equity, reinvested earnings, other long-term capital, and short-term capital as reported in the balance of payments. It can be expressed as a share of GDP or can also be divided by the working-age population.
Government expenditures on R&D: Government support for R&D has been found to lead to an increase in the number of patents. There is a significant relationship between industry funding and the quality and quantity of university research. R&D funding leads to greater knowledge creation and more opportunities for innovation (see Audretsch and Feldman, 1996; Salter and Martin, 2001; Cohen et al., 2002; Keller, 2002; Bottazzi and Peri, 2002; Bilbao-Osorio and Rodriguez-Pose, 2004; Rodríguez-Pose and Crescenzi, 2008; Slaper et al., 2016; Hollanders and Es-Sadki, 2021). Public funding of R&D includes direct funding through instruments such as grants and public contracts and indirect support through the tax system. It is therefore the sum of government tax support for R&D spending and direct funding of business R&D spending, which can be expressed as a percentage of GDP.
Gross expenditures on R&D: R&D spending is often used to forecast innovation and economic growth, and recent indexes have included R&D spending as a measure of innovation. R&D expenditures predict patenting and productivity levels and also have a positive effect on the creation of new businesses and other measures of innovation and economic development (see Audretsch and Feldman, 1996; Salter and Martin, 2001; Cohen et al., 2002; Keller, 2002; Bottazzi and Peri, 2002; Bilbao-Osorio and Rodriguez-Pose, 2004; Rodríguez-Pose and Crescenzi, 2008; Arthurs et al., 2009; López-Claros and Mata, 2010; Cannon et al., 2015; Slaper et al., 2016; OECD, 2017; WIPO, 2021). Gross expenditures on R&D represent the total amount of funds spent on R&D activities across all sectors (business, higher education, federal and provincial or territorial governments, private non-profit organizations, and foreign organizations).
VC investment: VC funds are used to bring new ideas to market, bring new technology to market or develop innovative businesses (see Kortum and Lerner, 2000; Engel and Keilbach, 2007; Mann and Sager, 2007; Hirukawa and Ueda, 2011; Rin et al., 2013; Cannon et al., 2015; Cukier et al., 2016; Slaper et al., 2016; OECD, 2017; Hollanders and Es-Sadki, 2021; WIPO, 2021). Higher VC activity is associated with higher levels of innovation, as measured by patents and total factor productivity growth. VC investment can be measured in dollars as the private capital raised for investment in businesses, which includes seed capital (seed plus start-up) and expansion and replacement capital. It can also be measured by the total number of VC deals. VC can be expressed as a percentage of GDP and averaged over three years.
3.6 Knowledge outputs
Patent applications: The number of patents is an established measure of regional innovation, as it predicts subsequent patent filings and the birth of new industries (see Jaffe, 1989; Jaffe et al., 1993; Hall et al., 2001; Agrawal and Henderson, 2002; Bottazzi and Peri, 2002; Bilbao-Osorio and Rodriguez-Pose, 2004; Corrado et al., 2009; López-Claros and Mata, 2010; Cannon et al., 2015; Cukier et al., 2016; Slaper et al., 2016; OECD, 2017; Hollanders and Es-Sadki, 2021; WIPO, 2021). Patent-related knowledge is shared across networks and spreads to neighbouring regions. This indicator can be measured as the number of patent applications filed by residents.
Product and process innovations: This is the direct measure of innovations. Product innovation is the creation and introduction of a new good or service to the market or an improved version of a previous product (see Wolfe and Gertler, 2004; Arthurs et al., 2009; Corrado et al., 2009; Cannon et al., 2015; OECD, 2017; Beaudry and Solar-Pelletier, 2020; Hollanders and Es-Sadki, 2021). Process innovation is the introduction of a new or improved method of production or delivery.
Designs, copyrights and trademarks: Trademarks, copyrights and designs are an important indicator of innovation, especially for the service sector, because their establishment ensures consistent product quality, productivity growth and competitiveness, which is essential for innovation growth (see Corrado et al., 2009; López-Claros and Mata, 2010; OECD, 2017; Hollanders and Es-Sadki, 2021; WIPO, 2021). This indicator can be measured as the number of individual trademarks, copyrights and designs filed.
3.7 Employment
Change in establishment births: New businesses stimulate and enhance competition among firms, which increases productivity and economic growth over the long term. Start-ups also play a key role in bringing about innovations, which often change the game, open new markets, and disrupt the status quo (see Fritsch, 2008; Neumark et al., 2011; Hyatt and Spletzer, 2013; Criscuolo et al., 2014; Decker et al., 2014; Foster et al., 2016; Slaper et al., 2016; OECD, 2017; WIPO, 2021). This indicator can be measured as the number of newly registered establishments per 1,000 working-age people or the average of the number of new establishments less than 1 year old divided by the total number of active establishments.
Establishment churn: Technology and knowledge requirements that have changed, or even been eliminated, offer the opportunity to create new industries, processes, and jobs. Labour turnover is an indicator of the improved employment tenure of labour force workers. Workers are moving into more desirable and better-paying jobs. Similarly, labour turnover, whether measured by the creation of new businesses or the increase in the workforce of existing businesses, is an indicator of positive economic change in the region (see Criscuolo et al., 2014; Decker et al., 2014; Hathaway and Litan, 2014; Cukier et al., 2016; OECD, 2017; Slaper et al., 2016). Establishment turnover can be measured as the ratio of establishments that increase employment (with or without adding entries) to firms that reduce employment (with or without adding exits).
Job growth to population growth ratio: Employment growth is often used to measure economic growth and as an output of innovation. High employment growth relative to population growth indicates that jobs are being created faster than people are moving into an area. The ratio measures whether employment is growing faster or slower than the general population, indicating good innovation activity, as a firm’s performance is strongly correlated with its ability to innovate (see Dowrick and Nguyen, 1989; Acs and Armington, 2004; Boarnet, 2005; Cukier et al., 2016; Slaper et al., 2016; OECD, 2017; Beaudry and Solar-Pelletier, 2020).
3.8 Production
Exports in high-tech industries: Exports in high-tech industries measure technological competitiveness as the ability to commercialize the results of R&D and innovation in international markets. High-tech products are key drivers of economic growth, productivity, and welfare, and they are typically a source of high-value-added, well-paying jobs (see Porter, 1990, 1998; Wolfe and Gertler, 2004; Arthurs et al., 2009; Cannon et al., 2015; Slaper et al., 2016; OECD, 2017; Beaudry and Solar-Pelletier, 2020; Hollanders and Es-Sadki, 2021; WIPO, 2021). Typically, these are companies in management, scientific and technical consulting services; scientific R&D services; chemicals; basic pharmaceuticals; weapons and ammunition; computer, electronic and optical products; electrical equipment, machinery and equipment; motor vehicles; trailers and semi-trailers; other transportation equipment, excluding shipbuilding, air- and spacecraft and related machinery; or medical and dental instruments. High-tech exports can be expressed as a percentage of total trade.
GDP growth: GDP can be a measure of economic performance, because it includes labour compensation and returns to capital. Innovative products or processes are undertaken because they would increase wages or profits (see Slaper et al., 2011; Cukier et al., 2016; Slaper et al., 2016; Beaudry and Solar-Pelletier, 2020; Hollanders and Es-Sadki, 2021; WIPO, 2021). Since not all companies that contribute to GDP growth are innovative or active in innovation, GDP growth of high-tech companies can be considered instead. However, GDP may give a misleading reading for Canada in recent years, given population growth. GDP per hour worked (i.e., labour productivity) or other measures of productivity (e.g., multifactor or total factor productivity growth) could therefore be considered instead.
Proprietor income to wages and salaries: This measure examines the success of entrepreneurial activity by comparing owner income to total employee wages and salaries. A high ratio suggests the presence of profitable entrepreneurial activity, which may also indicate a more dynamic and innovative economy. The data on wage earnings and owner income are based on the location of the work. This allows for a stronger relationship between innovation activities and innovation rewards based on where the innovation activities took place (see Low et al., 2005; Wong et al., 2005; Hessels et al., 2008; Koellinger, 2008; Goetz and Rupasingha, 2009; Minniti and Lévesque, 2010; Slaper et al., 2016; OECD, 2017). Proprietor income to wages and salaries can be measured as the ratio of owner income to total wages and salaries.
4 Discussion and conclusion
4.1 Methodology of the innovation framework
According to the OECD’s Handbook on Constructing Composite Indicators: Methodology and User Guide, the two main criteria for assessing composite indicators are ease of interpretation and the transparency of the methodology used. The selected indicators meet these criteria because they are widely used in the literature and at the international level, as well as on the methodological basis of simple popularity criteria. The common framework for analyzing the performance of innovation ecosystems is based on the use of factual data. Only 5 of 38 indicators (doing business, logistics performance and the three collaboration indicators) are based on indexes built on the perceptions of businesses or civil society. The framework is composed of 26 innovation input indicators and 12 innovation output indicators. It allows innovation ecosystems to be analyzed based on a variety of indicators, measuring different dimensions of innovation.
The literature review refers to indicators used to measure the performance of innovation ecosystems. These indicators can be used to construct a composite index to compare the evolution of a city’s innovation ecosystem over time or to compare two cities. A composite index can be created from all the indicators by using a simple or weighted average (based on their medium or high ranking) of the indicator scores.
Following the methodology of the European Innovation Scoreboard (see Hollanders and Es-Sadki, 2021) is proposed. It allows a simple and efficient construction of innovation indexes comparable in time and space. This methodology uses a scoring system to build a composite index. For each indicator, a base year is identified based on the availability of data from the observed sample.
Missing data are then treated by replacing, for example, missing values with those from the previous or next available year. Then, outliers are identified and replaced by the respective maximum and minimum values observed over the entire period of the observed sample. This methodology also transforms the data if they are highly skewed. Some indicators will be expressed as percentages, while others will have values that are not limited to an upper threshold. If these values are very volatile and asymmetric, they can be replaced by the square root of the indicator value. At this stage, it is possible to identify, for each indicator, the maximum score (the highest value of the sample over the whole observed period) and the minimum score (the lowest value of the sample over the whole observed period).
The values of the indicators are finally rescaled for each period to have them from 0 to 100. To do this, a formula is applied: (value−minimum(maximum)) × 100. Finally, for each observed period, a composite synthetic innovation index can be computed as the unweighted average of the rescaled scores for all indicators, where all indicators receive the same weighting (1/38 if data are available for all 38 indicators of the common framework). The European methodology proposes expressing performance scores relative to those of the European Union, which would be equivalent to expressing, for example, the composite index of Canadian cities relative to that of Canada.
4.2 Ecosystem performance analysis
Table 1 presents the indicators for two regions, A and B. The indicator values were randomly generated between the minimum and maximum values observed for each indicator at the provincial level in Canada from 2016 to 2018. They were generated for 50 regions to construct a good sample of regions. Only two regions are presented for illustrative purposes. The scores generated are at the indicator group and subgroup level. The value column gives the observed value of the indicator. The score column gives the score generated following the methodology presented above.
In the example presented, region B (58) has better overall innovation performance than region A (49). The framework allows the performance of these two ecosystems to be analyzed in more detail. Region A performs better in terms of innovation inputs than region B (54 versus 47), mainly because of better investment in the financial environment, as well as in the human and research capital of the ecosystem. By contrast, region B performs significantly better in all areas of innovation inputs than region A (68 versus 44), translating into better overall performance in terms of innovation. Another feature that this framework highlights is that region A’s better performance in terms of investment in innovation inputs does not translate well in terms of innovation outputs. This represents the major challenge for Canada in transforming its innovation investments into knowledge products. Given that these values were generated randomly, no further interpretive analysis can be done, but the common framework would allow researchers to assess, for example, which innovation input investment profile best translates into good innovation creation or existing innovation development.
The framework allows for an analysis of important categorical indexes for the inputs and outputs of innovation. This framework does not indicate how the volume of inputs affects the quantity of outputs. The OECD recommends using indicators cautiously, with the objective of providing complementary information to already established analyses on innovation ecosystems. Thus, this framework should be combined with empirical and theoretical analysis, including informed judgments and common sense.
| Indicators | Region A | Region B | ||
|---|---|---|---|---|
| value | score | value | score | |
| Innovation index | Note ...: not applicable | 48.9 | Note ...: not applicable | 57.9 |
| 1. Inputs | Note ...: not applicable | 53.8 | Note ...: not applicable | 47.4 |
| Human capital and research | Note ...: not applicable | 47.0 | Note ...: not applicable | 22.8 |
| Education expenditures (% GDP) | 0.9 | 4.7 | 1.3 | 21.0 |
| International students (% total students) | 18.8 | 56.9 | 12.3 | 9.7 |
| Knowledge programs (% population) | 15.1 | 65.6 | 2.5 | 0.1 |
| Researchers and technicians in R&D (% employment) | 33.9 | 97.4 | 4.0 | 2.5 |
| Scientific and technical articles (per capita) | 1,469.0 | 21.6 | 966.0 | 8.2 |
| Tertiary education (% population) | 28.1 | 34.1 | 19.6 | 17.6 |
| University-based knowledge spillovers (total universities) | 29.0 | 58.3 | 28.0 | 56.3 |
| Young adult population (% population) | 5.8 | 37.3 | 6.3 | 66.7 |
| Infrastructure and institutions | Note ...: not applicable | 45.5 | Note ...: not applicable | 53.9 |
| Broadband connections (% firms) | 48.8 | 83.2 | 30.8 | 18.9 |
| Doing business index (international score) | 79.5 | 61.6 | 92.0 | 90.0 |
| ICT investment (% firms with ICT training) | 18.6 | 44.2 | 34.6 | 100.0 |
| Local availability of capital (bank deposits to GDP) | 85.4 | 20.6 | 97.3 | 37.2 |
| Logistics performance (resource productivity $/kg) | 1.5 | 17.7 | 1.8 | 23.3 |
| Innovation linkages | Note ...: not applicable | 57.3 | Note ...: not applicable | 45.2 |
| Business–university collaboration (co-papers per capita) | 553.0 | 50.1 | 495.0 | 42.8 |
| Business local collaboration (% firms) | 18.4 | 34.8 | 35.7 | 81.3 |
| Business international collaboration (co-papers per capita) | 3,862.0 | 86.9 | 1,014.0 | 11.4 |
| Business dynamics | Note ...: not applicable | 64.0 | Note ...: not applicable | 64.5 |
| Business expenditures on R&D (% GDP) | 3.4 | 77.1 | 2.8 | 62.4 |
| Business incubators (total firms) | 23.0 | 43.6 | 23.0 | 43.6 |
| Establishment size (SME % employment) | 93.4 | 82.9 | 79.7 | 46.3 |
| High-tech industry employment (% total employment) | 13.4 | 33.5 | 33.1 | 99.7 |
| Industry concentration (HHI measure) | 56.2 | 97.9 | 14.5 | 23.7 |
| Institutionally based start-ups (total academic spin-offs) | 44.0 | 87.8 | 23.0 | 44.9 |
| International workers (% employment) | 14.0 | 43.9 | 28.5 | 95.2 |
| Proprietorship rate (% self-employment) | 13.4 | 45.2 | 19.6 | 100.0 |
| Finance and support | Note ...: not applicable | 54.9 | Note ...: not applicable | 54.5 |
| Academic expenditures on R&D (% GDP) | 1.3 | 81.0 | 1.4 | 87.1 |
| Foreign direct investment (% GDP) | 5.3 | 78.2 | 3.5 | 50.8 |
| Government expenditures on R&D (% GDP) | 0.2 | 53.6 | 0.4 | 94.8 |
| Gross expenditures on R&D (% GDP) | 1.6 | 49.7 | 1.0 | 3.7 |
| Venture capital investment (% GDP) | 5.5 | 11.9 | 15.0 | 36.1 |
| 2. Outputs | Note ...: not applicable | 43.9 | Note ...: not applicable | 68.3 |
| Knowledge outputs | Note ...: not applicable | 41.5 | Note ...: not applicable | 54.7 |
| Patents applications (per billion GDP) | 2.0 | 22.2 | 1.0 | 11.1 |
| Product and process innovations (per billion GDP) | 11.0 | 2.3 | 53.0 | 100.0 |
| Designs, copyrights and trademarks (per billion GDP) | 36.0 | 100.0 | 21.0 | 53.1 |
| Employment | Note ...: not applicable | 63.4 | Note ...: not applicable | 94.8 |
| Change in establishment births (growth rate) | 9.8 | 92.9 | 10.0 | 100.0 |
| Establishment churn (turnover rate) | 3.0 | 0.0 | 22.0 | 100.0 |
| Job growth to population growth ratio | 6.4 | 97.2 | 5.2 | 84.3 |
| Production | Note ...: not applicable | 26.7 | Note ...: not applicable | 55.3 |
| Exports in high-tech industries (% total exports) | 11.2 | 16.2 | 64.0 | 95.2 |
| Gross domestic product growth | 4.3 | 49.1 | 1.6 | 20.4 |
| Proprietor income to wages and salaries | 0.7 | 14.8 | 0.8 | 50.5 |
|
... not applicable Notes: GDP = gross domestic product; R&D = research and development; ICT = information and communications technology; SME = small and medium-sized enterprise; HHI = Herfindahl-Hirschman Index. Source: Authors' calculations. |
||||
However, the selected indicators allow regions to be ranked according to their innovation input and output performance. Spatial and temporal analysis can be performed on specific or combined dimensions of ecosystem performance. Through the common framework, readers, and users—especially in the public domain—will be able to see, very quickly, the dimensions measured in innovation ecosystems. As a source of information, therefore, this framework can assist in the development of various policies. It can be useful for quantifying and defining numerical targets and benchmarks. For example, a comparative analysis between regions with numerical indicators that are easy to understand can be used to motivate behaviour change, because one can compare oneself to others. The United Nations Development Programme’s Human Development Index classifications have inspired development practitioners to approach economic development in a broader dimension, involving composite indicators.
The analytical framework can also help develop common goals in public debate. Indexes and associated rankings are useful tools for focusing public attention on a particular set of policy issues. When supported by detailed data, they can provide valuable information about underlying strengths and weaknesses, which can then serve as a catalyst for further policy debate and efforts to improve specific areas of expertise.
In conclusion, this study covers the literature on performance indicators for innovation ecosystems at different scales of analysis. The selected indicators are easily computable, provided that the data are available. They are also regionally and internationally comparable, thanks to the methodology used to select them.
More than 400 indicators have been explored and combined into just over 100, classified according to their occurrence in the literature. The study provides a useful framework for assessment, which will be made more effective by a greater emphasis on improving the weakly developed dimensions of innovation. It is an interesting and comprehensive tool for policy makers, researchers, the private sector, and innovation actors. However, although this ranking lists the indicators most widely used in the literature, it does not include lesser-used indicators that reflect new trends and dynamics in local economies. To visualize low-use indicators and adapt them to the context of their analysis, readers can request access to the appendix containing all the indicators in the literature examined by this study.
Appendix A
| Papers | Variables | Application | Description | Reference | Comments |
|---|---|---|---|---|---|
| National Research Council Index | 34 | Canada | Cluster analysis | Arthurs et al., 2009 | They measure through clusters the success of individual companies and its moderation by cluster factors, supporting organizations, customers and competitors. They focus on sectoral linkages. |
| Innovation, Science and Economic Development Canada | 15 | Canada | Supercluster analysis | Beaudry and Solar-Pelletier, 2020 | Superclusters are a framework for identifying the factors that facilitate the emergence and success of innovation ecosystems. They focus on technological linkages. |
| Innovation Ecosystem Scorecard | 22 | Canada | Regional analysis | Cukier et al., 2016 | They assess the innovation ecosystem of a region and define it as a dense network of stakeholders, processes and organizations in an enabling environment. They focus on small communities. |
| Indiana Business Research Center, Innovation Index 2.0 | 65 | United States | Regional analysis | Slaper et al., 2016 | They measure and provide a comparison of the innovation capacity and the production potential of a state or region through innovation inputs and outputs. |
| Science, Technology and Innovation Council | 28 | Canada | Country analysis | Cannon et al., 2015 | They define an innovation ecosystem as a combination of skilled and creative talent, high-quality knowledge, and an innovative private sector, supported by a government that plays a key role in creating an enabling environment that encourages innovation throughout the economy. |
| European Innovation Scoreboard | 51 | Europe | Country analysis | Hollanders and Es-Sadki, 2021 | They make a comparative assessment of the research and innovation performance of European Union member states. |
| OECD Science, Technology and Industry Scoreboard | 78 | OECD countries | Country analysis | OECD, 2017 | They build a data infrastructure to connect a country's actors, outcomes and impacts. They also highlight knowledge assets, research excellence, collaboration, business innovation, competitiveness and digital transformation. |
| Innovation Capacity Index | 61 | Worldwide | Country analysis | López-Claros and Mata, 2010 | They make a reasonably broad coverage of the factors that affect a nation's ability to innovate (enabling conditions) on the one hand, and a certain degree of economy (performance) on the other. |
| WIPO Global Innovation Index | 81 | Worldwide | Country analysis | WIPO, 2021 | They provide an innovation system that balances knowledge creation, exploration and investment (the inputs of innovation) with the production of ideas and technologies for application, exploitation and impact (the outputs of innovation). |
|
Notes: OECD = Organisation for Economic Co-operation and Development; WIPO = World Intellectual Property Organization. Source: Authors' calculations. |
|||||
Appendix B
Common innovation ecosystem indicators (recent studies)
- Inputs
- Enabling conditions
- Human capital and research
- Education expenditures
- International students
- Knowledge programs
- Researchers and technicians in R&D
- Scientific and technical articles
- Tertiary educationNote †
- University-based knowledge spillovers
- Young adult population
- Infrastructure and institutions
- Broadband connections
- ICT investment
- Innovation linkages
- Business–university collaboration
- Business local collaboration
- Business international collaboration
- Human capital and research
- Market conditions
- Business dynamics
- Business expenditures on R&DNote †
- Establishment size
- High-tech industry employment
- Industry concentration
- International workers
- Proprietorship rate
- Finance and support
- Business dynamics
- Enabling conditions
- Outputs
- Innovation impacts
- Knowledge outputs
- Patent applicationsNote †
- Product and process innovations
- Designs, copyrights and trademarks
- Knowledge outputs
- Economic impacts
- Innovation impacts
Notes: The rest of the indicators are moderately used in the literature. R&D = research and development; ICT = information and communications technology.
Source: Authors' calculations.
End of text boxAppendix C
Common innovation ecosystem indicators (Microeconomics studies)
- Inputs
- Enabling conditions
- Human capital and research
- Infrastructure and institutions
- Broadband connections
- Local availability of capitalNote †
- Innovation linkages
- Business–university collaboration
- Business local collaboration
- Business international collaboration
- Market conditions
- Business dynamics
- Finance and support
- Enabling conditions
- Outputs
- Innovation impacts
- Knowledge outputs
- Patent applicationsNote †
- Product and process innovations
- Designs, copyrights and trademarks
- Knowledge outputs
- Economic impacts
- Innovation impacts
Notes: The rest of the indicators are moderately used in the literature. R&D = research and development; ICT = information and communications technology.
Source: Authors' calculations.
End of text boxReferences
Acs, Z. and Armington, C. (2004). Employment growth and entrepreneurial activity in cities. Regional Studies, 38(8):911–927.
Acs, Z., Audretsch, D., and Lehmann, E. E. (2013). The knowledge spillover theory of entrepreneurship. Small Business Economics, 41:757–774.
Acs, Z. J. and Audretsch, D. B. (1988). Innovation in large and small firms: An empirical analysis. The American Economic Review, 78(4):678–690.
Acs, Z. and Audretsch, D. B. (1990). Innovation and Small Firms. MIT Press, Cambridge, MA.
Acs, Z. J. and Plummer, L. A. (2005). Penetrating the "knowledge filter" in regional economies. The Annals of Regional Science, 39:439–456.
Adner, R. (2006). Match Your Innovation Strategy To Your Innovation Ecosystem. Harvard Business Review, 84:98–107; 148.
Aerts, K., Matthyssens, P., and Vandenbempt, K. (2007). Critical role and screening practices of European business incubators. Technovation, 27(5):254–267.
Agrawal, A. and Henderson, R. (2002). Putting patents in context: Exploring knowledge transfer from MIT. Management Science, 48(1):44–60.
Almeida, P. and Kogut, B. (1997). The exploration of technological diversity and the geographic localization of innovation: Start-up firms in the semiconductor industry Small Business Economics, 9(1):21–31.
Anselin, L., Varga, A., and Acs, Z. (1997). Local geographic spillovers between university research and high technology innovations. Journal of Urban Economics, 42(3):422–448.
Araujo Reis, D. Rodrigues de Moura, F., and Machado de Aragão, I. (2021). The linkage between input and output in the innovation ecosystem. Global Journal of Human-Social Science Research.
Arthurs, D., Cassidy, E., Davis, C., and Wolfe, D. (2009). Indicators to support innovation cluster policy. International Journal of Technology Management, 464:263–279.
Arvanitis, S. and Stucki, T. (2012). What determines the innovation capability of firm founders? Industrial and Corporate Change, 21(4):1049–1084.
Atkinson, R. D. and Mayo, M. J. (2010). Refueling the U.S. innovation economy: Fresh approaches to science, technology, engineering and mathematics (STEM) education.
Audretsch, D. and Keilbach, M. (2004). Entrepreneurship capital and economic performance. Regional Studies, 38(8):949–959.
Audretsch, D. and R. Thurik (2001), "Linking Entrepreneurship to Growth", OECD Science, Technology and Industry Working Papers, No. 2001/02, OECD Publishing, Paris, https://doi.org/10.1787/736170038056.
Audretsch, D. B. and Feldman, M. P. (1996). Innovative clusters and the industry life cycle. Review of Industrial Organization, 11(2):253–273.
Audretsch, D. B. and Lehmann, E. E. (2005). Does the knowledge spillover theory of entrepreneurship hold for regions? Research Policy, 34(8):1191–1202. Regionalization of Innovation Policy.
Ayyagari, M., Demirgüç-Kunt, A., and Maksimovic, V. (2011). Firm innovation in emerging markets: The role of finance, governance, and competition. Journal of Financial and Quantitative Analysis, 46(6):1545–1580.
Barker, V. III and Mueller, G. C. (2002). CEO characteristics and firm R&D spending. Management Science, 48(6):782–801.
Beaudry, C. and Breschi, S. (2003). Are firms in clusters really more innovative? Economics of Innovation and New Technology, 12(4):325–342.
Beaudry, C., and Solar-Pelletier, L. (2020). The Superclusters Initiative: An Opportunity to Reinforce Innovation Ecosystems. IRPP Study 79. Montreal: Institute for research on Public Policy.
Bednarzik, R. W. (2000). The role of entrepreneurship in U.S. and European job growth. Monthly Labor Review, 123.
Belussi, F. and Sedita, S. R. (2009). Life cycle vs. multiple path dependency in industrial districts. European Planning Studies, 17(4):505–528.
Benfratello, L., Schiantarelli, F., and Sembenelli, A. (2008). Banks and innovation: Micro-econometric evidence on Italian firms. Journal of Financial Economics, 90(2):197–217.
Bercovitz, J. E. L. and Feldman, M. P. (2007). Fishing upstream: Firm innovation strategy and university research alliances. Research Policy, 36(7):930–948.
Bilbao-Osorio and Rodriguez-Pose, A. (2004). From R&D to innovation and economic growth in the EU. Growth and Change, 35(4):434–455.
Blalock, G. and Gertler, P. J. (2008). Welfare gains from foreign direct investment through technology transfer to local suppliers. Journal of International Economics, 74(2):402–421.
Boarnet, M. G. (2005). An empirical model of intrametropolitan population and employment growth. Papers in Regional Science, 73(2):135–152.
Bode, E. (2004). The spatial pattern of localized R&D spillovers: An empirical investigation for Germany. Journal of Economic Geography, 4(1):43–64.
Boschma, R. (2005). Proximity and innovation: A critical assessment. Regional Studies, 39(1):61–74.
Bottazzi, L. and Peri, G. (2002). Innovation and spillovers in regions: Evidence from European patent data. European Economic Review, 47(4):687–710.
Branstetter, L. (2006). Is foreign direct investment a channel of knowledge spillovers? Evidence from Japan’s FDI in the United States. Journal of International Economics, 68(2):325–344.
Breschi, S. and Lissoni, F. (2001). Knowledge spillovers and local innovation systems: A critical survey. Industrial and Corporate Change, 10(4):975–1005.
Busom, I. and Fernández-Ribas, A. (2008). The impact of firm participation in R&D programmes on R&D partnerships. Research Policy, 37(2):240–257.
Cannon, E., Forest, S., Chakma, A., Fortier, S., Garbutt, D., Gupta, A., Simair, M., Kang, C.-Y., Darkes, M., Knox, K., Laflamme, R., Romero, J., Scott, J., Treurnicht, I., Gracht, P., Venne-Man, N., Verschuren, A., and Secretariate, S. (2015). Science, Technology and Innovation Council to the Government of Canada. Technical report.
Carree, M. A. and Thurik, A. R. (2003). Chapter - The impact of entrepreneurship on economic growth. In Acs, Z. J. and Audretsch, D. B., editors, Handbook of Entrepreneurship Research: An Interdisciplinary Survey and Introduction, pages 437–471. Springer, Boston, MA.
Casper, S. (2013). The spill-over theory reversed: The impact of regional economies on the commercialization of university science. Research Policy, 42(1):1313–1324.
Chan, K. F. and Lau, T. (2005). Assessing technology incubator programs in the science park: the good, the bad and the ugly. Technovation, 25(10):1215–1228.
Cheshire, P. and Magrini, S. (2000). Endogenous processes in European regional growth: Convergence and policy. Growth and Change, 31(4):455–479.
Cohen, W. M., Nelson, R. R., and Walsh, J. P. (2002). Links and impacts: The influence of public research on industrial R&D. Management Science, 48(1):1–23.
Combes, P.-P. and Gobillon, L. (2015). Chapter 5 - The empirics of agglomeration economies. In Duranton, G., Henderson, J. V., and Strange, W. C., editors, Handbook of Regional and Urban Economics, volume 5, pages 247–348. Elsevier.
Corrado, C., Hulten, C., and Sichel, D. (2009). Intangible Capital and U.S. Economic Growth. Review of Income and Wealth, 55(3):661–685.
Crandall, R., Litan, R., and Lehr, W. (2007). The effects of broadband deployment on output and employment: A cross-sectional analysis of U.S. data. Issues in Economic Policy, 6.
Crescenzi, R. (2005). Innovation and regional growth in the enlarged Europe: The role of local innovative capabilities, peripherality, and education. Growth and Change, 36(1):471–507.
Criscuolo, C., P. Gal and C. Menon (2014), "The Dynamics of Employment Growth: New Evidence from 18 Countries", OECD Science, Technology and Industry Policy Papers, No. 14, OECD Publishing, Paris.
Cukier, W., Stolarik, K., Ngwenyama, O., N.,.and Elmi, M. (2016). Mapping the Innovation Ecosystem in Eastern Ontario. Technical report, Institute for Innovation and Technology Management.
Decker, R., Haltiwanger, J., Jarmin, R., and Miranda, J. (2014). The role of entrepreneurship in US job creation and economic dynamism. Journal of Economic Perspectives, 28(3):3–24.
Delgado, M. and Porter, M. E. (2017). Clusters and the Great Recession. In DRUID Conference Paper. Technical Report.
Delgado, M., Porter, M. E., and Stern, S. (2010). Clusters and entrepreneurship. Journal of Economic Geography, 10(4):495–518.
Delgado, M., Porter, M. E., and Stern, S. (2014). Clusters, convergence, and economic performance. Research Policy, 43(10):1785–1799.
Döring, T. and Schnellenbach, J. (2006). What do we know about geographical knowledge spillovers and regional growth?: A survey of the literature. Regional Studies, 40(3):375–395.
Dowrick, S. and Nguyen, D.-T. (1989). OECD comparative economic growth 1950-85: Catch-up and convergence. The American Economic Review, 79(5):1010–1030.
Drucker, J. and Goldstein, H. (2007). Assessing the regional economic development im- pacts of universities: A review of current approaches. International Regional Science Review, 30(1):20–46.
Duranton G, Puga D. 2004. Micro-Foundations of Urban Agglomeration Economies. In Handbook of Regional and Urban Economics, ed. J. V. Henderson and J.-F. Thisse, Amsterdam: Elsevier. Vol. 4: 2063-2117.
Engel, D. and Keilbach, M. (2007). Firm-level implications of early stage venture capital investment ― An empirical investigation. Journal of Empirical Finance, 14(2):150–167.
Eom, B.-Y. and Lee, K. (2010). Determinants of industry–academy linkages and, their impact on firm performance: The case of Korea as a latecomer in knowledge industrialization. Research Policy, 39(5):625–639. Special Section on Government as Entrepreneur.
Etzkowitz, H. (2002). Incubation of incubators: Innovation as a triple helix of university- industry-government networks. Science and Public Policy, 29(2):115–128.
Etzkowitz, H. (2003). Innovation in innovation: The triple helix of university-industry- government relations. Social Science Information, 42(3):293–337.
Feldman, M., Francis, J., and Bercovitz, J. (2005). Creating a cluster while building a firm: Entrepreneurs and the formation of industrial clusters. Regional Studies, 39(1):129–141.
Feller, I., Ailes, C. P., and Roessner, J. D. (2002). Impacts of research universities on technological innovation in industry: evidence from engineering research centers. Research Policy, 31(3):457–474.
Feser, E. J. (2003). What regions do rather than make: A proposed set of knowledge-based occupation clusters. Urban Studies, 40(10):1937–1958.
Fleming, L., King, C. III, and Juda, A. (2006). Small worlds and regional innovation. Organization Science, 18.
Florida, R. (2003). Cities and the creative class. City & Community, 2(1):3–19.
Foster, L., Grim, C., and Haltiwanger, J. (2016). Reallocation in the great recession: Cleansing or not? Journal of Labor Economics, 34(S1):S293–S331.
Fritsch, M. (2008). How does new business formation affect regional development? Introduction to the special issue. Small Business Economics, 30:1–14.
Glaeser, E. L. and Kerr, W. R. (2009). Local industrial conditions and entrepreneurship: How much of the spatial distribution can we explain? Journal of Economics & Management Strategy, 18(1):623–663.
Goetz, S. J. and Rupasingha, A. (2009). Determinants of growth in non-farm proprietor densities in the US, 1990-2000. Small Business Economics, 32(4):425–438.
Gomes, L. A. d. V., Facin, A. L. F., Salerno, M. S., and Ikenami, R. K. (2018). Unpacking the innovation ecosystem construct: Evolution, gaps and trends. Technological Forecasting and Social Change, 136:30–48.
Gordon, I. R. and McCann, P. (2005). Innovation, agglomeration, and regional development. Journal of Economic Geography, 5(5):523–543.
Granstrand, O. and Holgersson, M. (2020). Innovation ecosystems: A conceptual review and a new definition. Technovation, 90-91:102098.
Grimaldi, R. and Grandi, A. (2005). Business incubators and new venture creation: An assessment of incubating models. Technovation, 25(2):111–121.
Grundke, R., Jamet, S., Kalamova, M., Keslair, F., and Squicciarini, M. (2017). Skills and global value chains: A characterization. OECD Science, Technology and Industry Working Papers, No. 2017/05, OECD Publishing, Paris.
Gulbrandsen, M. and Smeby, J.-C. (2005). Industry funding and university professors’ research performance. Research Policy, 34(6):932–950.
Hadjimanolis, A. (2000). A resource-based view of innovativeness in small firms. Technology Analysis & Strategic Management, 12(2):263–281.
Hall, B. H., Jaffe, A. B., and Trajtenberg, M. (2001). The NBER patent citations data file: Lessons, insights and methodological tools. NBER Working Paper 8498.
Hansson, F., Husted, K., and Vestergaard, J. (2005). Second generation science parks: From structural holes jockeys to social capital catalysts of the knowledge society. Technovation, 25(9):1039–1049.
Hart, D. M. and Acs, Z. J. (2011). High-tech immigrant entrepreneurship in the United States. Economic Development Quarterly, 25(2):116–129.
Hathaway, I. and Litan, R. E. (2014). Declining business dynamism in the United States: A look at states and metros. Economic Studies at Brookings.
Hecker, D. E. (2005). High-technology employment: A NAICS-based update. Monthly Labor Review / U.S. Department of Labor, Bureau of Labor Statistics, 128:57–72.
Hessels, J., van Gelderen, M., and Thurik, R. (2008). Entrepreneurial aspirations, motivations, and their drivers. Small Business Economics, 31:323–339.
Heunks, F. J. (1998). Innovation, creativity and success. Small Business Economics, 10(3):263–272.
Hicks, D. and Hegde, D. (2005). Highly innovative small firms in the markets for technology. Research Policy, 34(5):703–716.
Hirukawa, M. and Ueda, M. (2011). Venture capital and innovation: Which is first? Pacific Economic Review, 16(4):421–465.
Hollanders, H. and Es-Sadki, N. (2021). European Innovation Scoreboard 2021. Technical report, European Union.
Hyatt, H. R. and Spletzer, J. R. (2013). The recent decline in employment dynamics. IZA Journal of Labor Economics, 2(5).
Innovation, Science and Economic Development Canada. (2024). Global Innovation Clusters. https://ised-isde.canada.ca/site/global-innovation-clusters/en.
Jaffe, A. (1989). The real effects of academic research. American Economic Review, 79(5):957–970.
Jaffe, A. B., Trajtenberg, M., and Henderson, R. (1993). Geographic localization of knowledge spillovers as evidenced by patent citations. The Quarterly Journal of Economics, 108(3):577–598.
Keller, W. (2002). Geographic localization of international technology diffusion. American Economic Review, 92(1):120–142.
Kerr, W. and Nanda, R. (2009). Financing constraints and entrepreneurship. Handbook of Research on Innovation and Entrepreneurship.
Kerr, W. R. (2013). U.S. high-skilled immigration, innovation, and entrepreneurship: Empirical approaches and evidence. Working Paper 19377, National Bureau of Economic Research.
Kirchhoff, B. A., Newbert, S. L., Hasan, I., and Armington, C. (2007). The influence of university R&D expenditures on new business formations and employment growth. Entrepreneurship Theory and Practice, 31(4):543–559.
Klepper, S. (1996). Entry, exit, growth, and innovation over the product life cycle. The American Economic Review, 86(3):562–583.
Koellinger, P. (2008). Why are some entrepreneurs more innovative than others? Small Business Economics, 31(1):21–37.
Kolko, J. (2000). The high-tech rural renaissance? Information technology, firm size and rural employment growth. Small Business Research Summary, 201.
Koo, J. (2005). Knowledge-based industry clusters: Evidenced by geographical patterns of patents in manufacturing. Urban Studies, 42(9):1487–1505.
Kortum, S. and Lerner, J. (2000). Assessing the contribution of venture capital to innovation. The RAND Journal of Economics, 31(4):674–692.
Langdon, D., McKittrick, G., Beede, D., Khan, B., and Doms, M. (2013). STEM: Good jobs now and for the future. U.S. Department of Commerce, Washington, DC.
Lehr, W., Osorio, C., Gillett, S. E., and Sirbu, M. A. (2006). Measuring broadband’s economic impact. (ESD-WP-2006-02).
Löfsten, H. and Lindelöf, P. (2005). R&D networks and product innovation patterns― academic and non-academic new technology-based firms on Science Parks. Technovation, 25(9):1025–1037.
López-Claros, A. and Mata, Y. (2010). Policies and Institutions Underpinning Country Innovation: Results from the Innovation Capacity Index. pages 3–63.
Low, S., Henderson, J., and Weiler, S. (2005). Gauging a region’s entrepreneurial potential. Economic Review, 90:61–89.
Mann, R. J. and Sager, T. W. (2007). Patents, venture capital, and software start-ups. Research Policy, 36(2):193–208.
Markman, G. D., Phan, P. H., Balkin, D. B., and Gianiodis, P. T. (2005). Entrepreneurship and university-based technology transfer. Journal of Business Venturing, 20(2):241–263. Special issue on Science Parks and incubators.
Martin, P., Mayer, T., and Mayneris, F. (2011). Public support to clusters: A firm level study of French “local productive systems.” Regional Science and Urban Economics, 41(2):108–123.
Mian, S. A. (1996). Assessing value-added contributions of university technology business incubators to tenant firms. Research Policy, 25(3):325–335.
Minniti, M. and Lévesque, M. (2010). Entrepreneurial types and economic growth. Journal of Business Venturing, 25(3):305–314.
Neffke, F., Henning, M., Boschma, R., Lundquist, K.-J., and Olander, L.-O. (2011). The dynamics of agglomeration externalities along the life cycle of industries. Regional Studies, 45(1):49–65.
Neumark, D., Wall, B., and Zhang, J. (2011). Do small businesses create more jobs? New evidence for the United States from the National Establishment Time Series. The Review of Economics and Statistics, 93(1):16–29.
Niosi, J. and Bas, T. G. (2001). The competencies of regions ― Canada’s clusters in biotechnology. Small Business Economics, 17:31–42.
OECD (2017). OECD Science, Technology and Industry Scoreboard 2017: The digital transformation. OECD Science, Technology and Industry Scoreboard. OECD Publishing, Paris.
OECD and Eurostat (2018). Oslo Manual 2018.
Porter, M. E. (1990). The Competitive Advantage of Nations. The Free Press, New York.
Porter, M. E. (1998). Clusters and Competition: New Agendas for Companies, Governments, and Institutions. Clusters and Competition. Harvard Business Review Books, Cambridge, MA.
Porter, M. E. (2000). Location, competition, and economic development: Local clusters in a global economy. Economic Development Quarterly, 14(1):15–34.
Rin, M. D., Hellmann, T., and Puri, M. (2013). Chapter 8 - A survey of venture capital research. volume 2 of Handbook of the Economics of Finance, pages 573–648. Elsevier.
Rodríguez-Pose, A. and Crescenzi, R. (2008). Research and development, spillovers, innovation systems, and the genesis of regional growth in Europe. Regional Studies, 42(1):51–67.
Romero, I. and Martínez-Román, J. A. (2012). Self-employment and innovation. Exploring the determinants of innovative behavior in small businesses. Research Policy, 41(1):178–189.
Romijn, H. and Albaladejo, M. (2002). Determinants of innovation capability in small electronics and software firms in southeast England. Research Policy, 31(7):1053–1067.
Salter, A. J. and Martin, B. R. (2001). The economic benefits of publicly funded basic research: A critical review. Research Policy, 30(3):509–532.
Santoro, M. D. and Gopalakrishnan, S. (2001). Relationship dynamics between university research centers and industrial firms: Their impact on technology transfer activities. The Journal of Technology Transfer, 26(1-2):163–171.
Sen, A. (1999). Development as Freedom. Alfred Knopf, New York.
Simonen, J. and McCann, P. (2008). Firm innovation: The influence of R&D cooperation and the geography of human capital inputs. Journal of Urban Economics, 64(1):146–154.
Singh, J. (2005). Collaborative networks as determinants of knowledge diffusion patterns. Management Science, 51(5):756–770.
Sjöholm, F. (1999). Technology gap, competition and spillovers from direct foreign investment: Evidence from establishment data. The Journal of Development Studies, 36(1):53–73.
Slaper, T. F., Hart, N. R., Hall, T. J., and Thompson, M. F. (2011). The index of innovation: A new tool for regional analysis. Economic Development Quarterly, 25(1):36–53.
Slaper, T., van der Does, T., Egan, P., Ortuzar, G., and Strange, R. (2016). Driving Regional Innovation: The Innovation Index 2.0. Technical report, U.S. Economic Development Administration.
Soetanto, D. P, and Jack, S. L. (2011). Business incubators and the networks of technology- based firms. The Journal of Technology Transfer, 38.
Sorenson, O. and Fleming, L. (2004). Science and the diffusion of knowledge. Research Policy, 33(10):1615–1634.
Sorenson, O., Rivkin, J. W., and Fleming, L. (2006). Complexity, networks and knowledge flow. Research Policy, 35(7):994–1017.
Statistics Canada. (2021). Science, Technology and Innovation Data Gaps Initiative. What we heard - key takeaways. Unpublished report.
Stuart, T. and Sorenson, O. (2003). The geography of opportunity: Spatial heterogeneity in founding rates and the performance of biotechnology firms. Research Policy, 32(2):229–253. Special issue on technology entrepreneurship and contact information for corresponding authors.
Teece, D. J. (2007). Explicating dynamic capabilities: The nature and microfoundations of (sustainable) enterprise performance. Strategic Management Journal, 28(13):1319–1350.
Thurik, A. R., Carree, M. A., Andrévan Stel, and Audretsch, D. B. (2008). Does self-employment reduce unemployment? Journal of Business Venturing, 23(6):673–686. The Economics of Entrepreneurship.
Thurik, R. and Wennekers, S. (1999). Linking entrepreneurship and economic growth. Small Business Economics, 13:27–55.
Tödtling, F., Lehner, P., and Kaufmann, A. (2009). Do different types of innovation rely on specific kinds of knowledge interactions? Technovation, 29(1):59–71.
U.S. Department of Commerce, Economic Development Administration (2010). A Practitioner’s Guide to Economic Development Tools for Regional Competitiveness in a Knowledge-Based Economy.
Wadhwa, V., Saxenian, A., Rissing, B., and Gereffi, G. (2008). Skilled immigration and economic growth. Applied Research in Economic Development, 5(1):6–15.
Warda, J. (2001). Measuring the value of R&D tax treatment in OECD countries. STI Review, 27:185–211.
WIPO (2021). Global Innovation Index 2021: Tracking Innovation through the COVID-19 Crisis. World Intellectual Property Organization, Geneva.
Wolfe, D. A. and Gertler, M. S. (2004). Clusters from the inside and out: local dynamics and global linkages. Urban Studies, 41(5/6):1071–1093.
Wong, P. K., Ho, Y. P., and Autio, E. (2005). Entrepreneurship, innovation and economic growth: Evidence from gem data. Small Business Economics, 24(3):335–350.
Woodward, D., Figueiredo, O., and Guimarães, P. (2006). Beyond the Silicon Valley: University R&D and high-technology location. Journal of Urban Economics, 60(1):15–32.
- Date modified: