
Analytical Studies: Methods and References
An Exploration of Methods to Estimate the Number of Immigrant Girls and Women at Risk of Female Genital Mutilation or Cutting in Canada
Skip to text
Text begins
Acknowledgements
This study was funded by Women and Gender Equality Canada. The authors would also like to acknowledge their consultation with members of GENDER-NET Plus, who provided valuable advice on the research approach used in this study. GENDER-NET Plus is an external academic group focused on women’s health, in particular on issues related to immigrant women and gender. Throughout 2019 and 2020, the authors attended several meetings with GENDER-NET Plus to obtain their advice and feedback, including multiple presentations on the findings throughout the course of the study.
Abstract
This report explores four potential methods of estimating the number of girls and women currently living in Canada who are considered at risk for female genital mutilation or cutting (FGM/C) based on their (and their parents’) country of birth. In this report, “at risk for FGM/C” broadly means at risk of having experienced FGM/C or of experiencing it in the future. Data on the country-specific estimated prevalence rates of FGM/C were obtained from the Demographic and Health Surveys and the Multiple Indicator Cluster Surveys (UNICEF 2017). These estimates were applied to the 2016 Census population counts of women living in Canada who were born in one of the 29 countries for which nationally representative data on FGM/C prevalence existed at the time of this analysis. Four different approaches were explored to estimate the number of girls and women living in Canada who may be at risk for FGM/C. Results show that the proportion of them who may be at risk for FGM/C depends on the target population considered in the methodology. Upper and lower estimates of girls and women at risk for FGM/C are presented.
Executive summary
It is estimated that at least 200 million girls and women around the world have experienced female genital mutilation or cutting (FGM/C). The World Health Organization defines FGM/C as “all procedures involving partial or total removal of the external female genitalia or injury to the female genital organs for non-medical reasons” (World Health Organization 2008). The practice of FGM/C is concentrated in Africa, the Middle East, and parts of Asia. However, estimates of FGM/C prevalence vary greatly by country and even by region within countries, and FGM/C has been documented in as many as 92 countries (End FGM European Network, U.S. End FGM/C Network, Equality Now 2020).
This report explores different approaches used in previous research to estimate the number of girls and women currently living in Canada who may be at riskNote for FGM/C based on their (and their parents’) country of birth. Information on FGM/C in Canada may help to inform health care providers, community service providers, and policy makers interested in women, health care, and immigration about this issue in Canada. Additionally, this information may inform intervention strategies focusing on women’s human rights, gender equality, and women’s health (Ortensi and Menonna 2017).
In Canada, FGM/C is considered a form of aggravated assault under the Criminal Code (Department of Justice 2017). However, there is a lack of information on the prevalence of FGM/C in Canada. This information gap was highlighted on the International Day for Zero Tolerance for FGM/C in 2021, when Prime Minister Trudeau issued a statement indicating a need for improved data to address FGM/C within Canada (Government of Canada 2021). Monitoring FGM/C in Canada is important for addressing Sustainable Development Goal indicator 5.3.2, which is focused on determining the proportion of girls and women aged 15 to 49 years who have undergone FGM/C, by age (United Nations n.d.). Currently, there are no available data on this issue for Canada.
While other nations, such as Australia and the United States, have estimated the number of immigrant girls and women at risk for FGM/C in their countries (Australia Institute of Health and Welfare 2019; Population Reference Bureau 2016), previous research examining FGM/C in Canada has largely been qualitative and focused on specific immigrant groups (e.g., Chalmers and Omer Hashi, 2000; 2002; Jacobson et al., 2018; Omorodian, 2020; Perovic et al., 2021). Therefore, an understanding of the number of women and girls in Canada who may be at risk for having experienced FGM/C is lacking. This information would be especially valuable for Canadian health care providers, because a recent study indicated that less than 10 percent of Canadian health care providers felt “very prepared” to care for FGM/C patients, and 90 percent indicated they would benefit from more information and training related to FGM/C (Deane et al., 2022). Additionally, FGM/C patients have reported negative experiences with health care providers in Canada including stigmatization, shame, judgment, inappropriate care, and disregard for health care preferences (e.g., method of delivery), with many indicating that they had delayed seeking health care during pregnancy because of these issues (Chalmers and Omer Hashi, 2000; Jacobson et al., 2022).
Since no national surveys directly collect information on FGM/C, estimates of FGM/C are derived through indirect measures, an approach consistent with other countries (e.g., the United States and Australia). Similar to FGM/C research in other nations, country- and age-specific prevalence rates from international surveys are used (Australian Institute of Health and Welfare 2019; Population Reference Bureau 2016). Data on the country-specific estimated prevalence rates of FGM/C were obtained from the Demographic and Health Surveys (DHS) and the Multiple Indicator Cluster Surveys (MICS) (UNICEF 2017). These estimates were applied to the 2016 Census Canadian population counts of women living in Canada who were born in one of the 29 countries for which nationally representative data on FGM/C prevalence were available at the time of this analysis.
Four different methods were used to estimate the number of girls and women living in Canada who may be at risk for FGM/C. In approach A, the estimated number of at-risk women in Canada was based on the 2016 Census immigration counts multiplied by 2017 UNICEF estimates for in-country prevalence of FGM/C. Approach B slightly refined this method by using age-specific estimates of FGM/C prevalence. Approach C added first-generation immigrant girls aged 0 to 14 years, as well as women aged 50 and older. Finally, approach D included second-generation immigrants—that is, those who were born in Canada and have at least one parent who was born outside of Canada. Since the rate of FGM/C among second-generation immigrants living in Canada is unclear, approach D estimated a range of risk for FGM/C, varying from no risk among the second generation (i.e., no cases of FGM/C if born in Canada) to the same risk as first-generation immigrants (high-end or upper-bound estimate).
Among the approximately 125,000 reproductive-aged girls and women (aged 15 to 49) who were currently living in Canada, but had immigrated from one of the 29 countries where the practice of FGM/C was documented (UNICEF 2017), about 58,000 were estimated to be at risk for having experienced FGM/C. When the other first-generation immigrant girls and women (i.e., those aged 0 to 14 years and 50 and older) as well as second-generation girls and women aged 0 to 49 years were included, approximately 95,000 to 161,000 girls and women currently residing in Canada were estimated to be at risk of experiencing or having experienced FGM/C.
Canada is home to a significant number of first- and second-generation immigrant girls and women who may be at risk for FGM/C, which may have implications for public policy related to health care, immigration, and public safety. However, several limitations warrant consideration. First, selective migration was not considered—that is, women who are more highly educated, who have higher incomes, and who are from urban areas are more likely to immigrate to Canada than their counterparts, and they (and their daughters) may be less at risk of having undergone or undergoing FGM/C (UNICEF 2013; Ortensi, Farina and Menonna 2015; Farina, Ortensi and Menonna 2016). Additionally, there is some evidence that women who migrate may be less likely to have undergone FGM/C, in particular if they are from countries with moderate or low prevalence of FGM/C (UNICEF 2013). Second, acculturation in Canada may mean that second-generation girls and women are less likely to undergo FGM/C. Third, the FGM/C estimates used in this analysis may be limited—rates in many countries are declining over time, and there may be variation in the rate of FGM/C within a country depending on the time of measurement. Moreover, since prevalence rates were only available for 29 countries, there may be women and girls in Canada from other countries of origin where FGM/C is practised that are not included in the calculations. Because of these factors, the estimates could over- or under-estimate the number of girls and women in Canada who are at risk for FGM/C and should not be interpreted as official estimates of FGM/C in Canada.
Future work may include a qualitative exploration of the experiences of women from countries that practise FGM/C who now live in Canada. A qualitative approach is necessary to understand topics that are difficult to address through surveys, especially when the topics are sensitive and the terms used to describe and understand FGM/C vary. Additionally, qualitative research may better capture differing perspectives and cultural traditions associated with the practice of FGM/C. Future work is needed to inform regional variations within a country, as well as the applicability of country-specific rates of FGM/C to second-generation girls and women. Other research methods could also be explored to better understand the health implications and to address policies, programs, and interventions geared toward this group of women.
1 Introduction
It is estimated that more than 200 million girls and women worldwide have experienced FGM/C (UNICEF 2020). FGM/C includes “all procedures involving partial or total removal of the external female genitalia or other injury to the female genital organs for non-medical reasons” (World Health Organization 2008). While there has been a decrease in support for FGM/C in some countries (UNFPA-UNICEF 2017), FGM/C is an ongoing issue for both the regions where it is practised and the countries to which these women and girls migrate.
The practice of FGM/C is concentrated in Africa, the Middle East, and parts of Asia. Among the 29 countries for which nationally representative data on FGM/C prevalence were available at the time of this analysis, prevalence estimates by country varied from 1% of girls and women in Cameroon and Uganda to 98% in Somalia (UNICEF 2017) (see Appendix A for a list of these 29 countries and within-country rates of FGM/C).Note
Social acceptance and religious reasons are the most common reasons cited as justification for FGM/C (UNFPA-UNICEF 2017). However, FGM/C can be viewed as more of a cultural practice as opposed to a religious practice, because it predates religions such as Christianity and Islam (Hayford and Trinitapoli 2011; Moges 2003). This is demonstrated by large variations in the rates of FGM/C across different countries with the same religious background and evidence that FGM/C is practised by members of different religions (El-Damanhoury 2013; Moges 2003). FGM/C is perpetuated by a desire or pressure to conform to choices made by others in the community (i.e., social acceptance or tradition, as evidenced by large, regional within-country differences in the rates of FGM/C) (Onagoruwa and Wodon 2018). FGM/C has also been explained as a way to control women’s sexuality (Onagoruwa and Wodon 2018) or as a rite of passage that is ingrained in tradition, marriageability, and the preservation of family honour (Exterkate 2013). Some consider FGM/C a social norm and, as such, approaches for its abandonment are based on changing social norms (UNFPA-UNICEF 2017).
FGM/C is typically performed by traditional practitioners, although in some African countries it may be performed by a trained medical professional (Macfarlane and Dorkenoo 2014). In Canada, under the Criminal Code, FGM/C is a form of aggravated assault. As stated by the Department of Justice, “[f]emale genital mutilation of a child is a crime in Canada. Also, any person who helps mutilate a female child’s genitals could be charged with a crime. This includes parents, doctors, or nurses. Even a person who asks someone else to do this to a child commits a crime. It is also against the law to take a child out of Canada to have this procedure done in another country.” (Department of Justice 2017).
There are no known health benefits to FGM/C (Peron et al. 2013). The practice is related to a series of negative health consequences and complications with immediate and long-term ramifications (Macfarlane and Dorkenoo 2014), including infections, infertility, and birth complications (Onagoruwa and Wodon 2018). According to a recent systemic review, the most common physical implications of FGM/C include urinary tract infections, bacterial vaginosis, prolonged labour, and difficult delivery (Berg et al. 2014). Psychological ramifications include anxiety disorders and post-traumatic stress disorder (Mulongo, Hollins Martin and McAndrew 2014). Finally, FGM/C violates a number of human rights principles, because it constitutes gender-based discrimination and is most often carried out on children (Macfarlane and Dorkenoo 2014; UNFPA-UNICEF 2017). In 2015, the international community agreed to target Sustainable Development Goal 5.3 to eliminate all harmful practices, such as child, early and forced marriage, and female genital mutilation by 2030 (United Nations n.d.).
While other nations such as the United States and Australia have made efforts to estimate FGM/C among their immigrant populations, similar national-level information about the domestic situation of FGM/C in Canada has not been produced. This information gap on the statistics of women and girls who might be at risk in Canada has been confirmed by stakeholders and advocacy organizations and is part of Canada’s Strategy to Prevent and Address Gender-Based Violence (Women and Gender Equality Canada 2019). The lack of data on FGM/C was also highlighted on the International Day for Zero Tolerance for FGM/C in 2021, when Prime Minister Trudeau issued a statement indicating a need for improved data to address FGM/C within Canada (Government of Canada 2021). Monitoring FGM/C in Canada is important for addressing Sustainable Development Goal indicator 5.3.2, which is focused on determining the proportion of girls and women aged 15 to 49 years who have undergone FGM/C, by age (United Nations n.d.). Currently, there are no available data on this for Canada. However, the findings from this paper can begin to fill this gap. Moreover, by examining the intersections of sex, ethnicity, and country of origin, the examination of the risk of FGM/C among different groups in Canada aligns with Statistics Canada’s Disaggregated Data Action Plan, which aims to produce statistical information that better reflects the experiences of specific population groups and analytical insights on diverse groups of people (Statistics Canada 2021).
The purpose of this report is to explore methods to estimate the number of girls and women living in Canada in 2016 who may be at risk for FGM/C, using approaches similar to research done in other Western migrant countries such as the United States (Goldberg et al. 2016; Population Reference Bureau 2016), Australia (Australia Institute of Health and Welfare 2019), England and Wales (Macfarlane and Dorkenoo 2014), and Italy (Farina, Ortensi and Menonna 2016). The estimates reflect the number of girls and women who may be “at risk” for FGM/C and not the number of girls and women who have actually experienced the procedure. “At risk” is broadly based on the women’s country of birth and, if born in Canada, the country of birth of their parents. “At risk” also broadly means at risk for having experienced FGM/C or of experiencing it in the future—in Canada or abroad.
Since there are no direct measures of FGM/C in Canada, estimates must be determined through indirect measures. Estimated in-country rates of FGM/C are extrapolated to the Canadian immigrant population from the 29 countries of birth that are of interest in this study. These prevalence rates are sourced from population health surveys across the countries of interest. Estimates for other countries have focused on girls and women aged 15 to 49 (i.e., those who are of reproductive age). However, this report broadens the scope to explore FGM/C for girls and women of all ages, including girls aged 0 to 14 years, which is the age range during which FGM/C is typically carried out (WHO 2022), and women older than 49.
Different strategies for estimating the number of at-risk girls and women were explored to replicate the approaches taken by other studies and to provide estimates of the number of girls and women who may be at risk. These estimates are of interest to several areas of public policy, including health care, chiefly immigrant women’s health. Previous research has shown that some immigrant women who have undergone FGM/C are unaware of the health implications of this practice (Chalmers and Omer 2000; Omorodion 2020; Packer, Runnels and Labonté 2015), while there is also evidence that many Canadian health care providers do not feel adequately prepared to care for FGM/C patients (Chalmers and Omer 2000; Deane et al. 2022; Jacobson et al. 2022). The results may also inform intervention strategies focusing on women’s human rights, gender equality, and women’s health (Ortensi and Menonna 2017).
2 Data sources and methods
Country-level information on FGM/C: Nationally representative data on the estimated proportion of women who have undergone FGM/C were extrapolated from the DHS, sponsored by the United States Agency for International Development, and UNICEF’s MICS (UNFPA-UNICEF 2017). Both are household interview surveys that typically collect health and population data every five years across a variety of countries in Africa, Asia, and Latin America. The year of data collection differs by country and was generally conducted after 2010, although the FGM/C estimates for Cameroon (2004), Djibouti (2006), and Somalia (2006) are from earlier years of collection. These surveys ask women of reproductive age about their own and any daughters’ FGM/C status, as well as their attitudes and opinions toward the practice. At the time of study, there were 29 countries for which representative data on FGM/C prevalence were available (UNICEF 2017). The validity of this methodological approach assumes that the girls and women residing in Canada are generally representative of the girls and women living in the countries of interest for which the prevalence rates of FGM/C were determined.
Immigration to Canada: Data on the number of first- and second-generation immigrants were obtained from the 2016 Census of Population in Canada.Note This census is conducted every five years and aims to produce counts for the total population of Canada. Content includes population counts; age and sex; family and household characteristics, such as the province of residence; and the immigration status for self and parents. For this report, custom tabulations were produced to determine the number of girls and women living in Canada whose country of birth was among the 29 countries where FGM/C was documented at the time of the analysis. Second-generation status (those who were born in Canada but have at least one parent born outside Canada) was obtained from the parental country of birth, which was also collected on the census questionnaire.Note
Four approaches were used to construct an estimate of the number of girls and women who may be at risk for FGM/C.
The first approach (A) used the DHS and MICS estimates of FGM/C in each country (UNICEF 2017), multiplied by the number of girls and women aged 15 to 49 who have immigrated to Canada from each country.
The result is the number of first-generation immigrant girls and women aged 15 to 49 currently living in Canada who are estimated to have been at risk for FGM/C.
Previous research has also applied the selective migration hypothesis to the estimation of FGM/C among immigrant populations (Farina, Ortensi, and Menonna 2016; Ortensi, Farina and Menonna 2015). This hypothesis suggests that women who are more educated and younger, and who live in urban areas, are more likely to migrate, and that these women are also less likely to experience FGM/C. To account for these confounders, Ortensi, Farina and Menonna suggested an adjustment factor to the country FGM/C estimate (generally a slight decrease), thus influencing the overall count of the number of women who may be at risk. However, when those adjusted country rates were applied to Canadian census data, only a small difference was shown in the FGM/C risk estimate (the estimate was reduced by fewer than 1,000 cases, data not shown). The Ortesi, Farina and Menonna correction factor was applied to the World Health Organization (WHO) prevalence estimates at the time of their report (2015), but not to the most recent UNICEF (2017) rates. Since the WHO prevalence estimates have generally decreased over time, this may have limited any noticeable difference when the correction factor was applied. Therefore, further exploration of the selective migration hypothesis is warranted.
Similar to estimates of FGM/C produced for Belgium (Dubourg et al. 2011), the second approach (B) considered age-range-specific information for both the in-country proportion of women who have undergone FGM/C and the immigration counts.Note
This methodology also produces an estimate for the number of first-generation immigrant girls and women aged 15 to 49 currently living in Canada who may be at risk for FGM/C, although it considers differences in FGM/C prevalence in different countries based on the age of the individual. For example, the estimated rate of FGM/C among girls and women aged 15 to 19 in Ethiopia is 62%, while the rate among women aged 45 to 49 is 81%. These age groups provide a more precise estimate of FGM/C for all immigrants from each country.
The third approach (C) adds first-generation immigrant girls aged 0 to 14 years, as well as women aged 50 and older. Country-specific FGM/C rates are available from the DHS and MICS for girls aged 0 to 14; however, the FGM/C estimate for women aged 45 to 49 must be used as a proxy for women aged 50 and older.
The fourth and final approach (D) considers second-generation immigrants (Dubourg et al. 2011)—that is, those born in Canada from a parent or parents born outside Canada. This method accounts for the possibility that even after migrating to Canada, families may still choose for their daughters to undergo FGM/C. FGM/C is illegal in Western countries (Johnsdotter and Essen 2016) and has been recognized in Canada’s Criminal Code as a form of aggravated assault since 1997. Therefore, FGM/C may occur via travel to the country of origin or covertly and outside the medical system (Dubourg et al. 2011), as countries with immigrant profiles similar to Canada (e.g., the United Kingdom and Australia) have reported cases of FGM/C being practised on girls within their countries (Packer, Runnels, and Labonté, 2015). Since limited research exists on the extent to which second-generation immigrant girls and women experience FGM/C, the rate of FGM/C among second-generation immigrants living in Canada is unclear. A range is provided for approach D: the lower estimate assumes no risk among the second generation (i.e., no cases of FGM/C if born in Canada) and the upper estimate assumes the same risk as first-generation immigrants (high-end or upper-bound estimate).
For girls and women aged 0 to 49,Note the country of origin of their parents was used to classify them as second-generation immigrants from a country of interest. Since the mother’s and father’s countries of origin were not necessarily the same (and possibly were not both one of the 29 countries of interest for this analysis), this method required four different calculations: (1) the mother originated from one of the 29 countries of interest; (2) the father originated from one of the 29 countries of interest; (3) the mother originated from one of the 29 countries of interest and the father also originated from one of the countries of interest, but the rate for the mother’s country is used in the calculation; and (4) the father originated from one of the 29 countries of interest and the mother also originated from one of the countries of interest, but the rate for the father’s country is used in the calculation.Note
In summary, approach A is an estimate of the number of at-risk girls and women aged 15 to 49 in Canada based on the UNICEF (2017) estimated country prevalence of FGM/C. Approach B improves on this by considering the rate of FGM/C within five-year age groupings; however, the FGM/C values were estimated in 2016. Approach C adds first-generation immigrant girls aged 0 to 14, as well as women aged 50 and older. This approach is advantageous because it includes all immigrant women rather than just women of childbearing age, as in the previous two approaches. Finally, approach D includes second-generation immigrants—that is, those born in Canada with at least one parent who was born outside Canada. Because of a lack of information on the rate of FGM/C among second-generation immigrants living in Canada, lower-bound estimates assume no cases of FGM/C if born in Canada and upper-bound estimates assume the same risk as first-generation immigrants.
3 Results
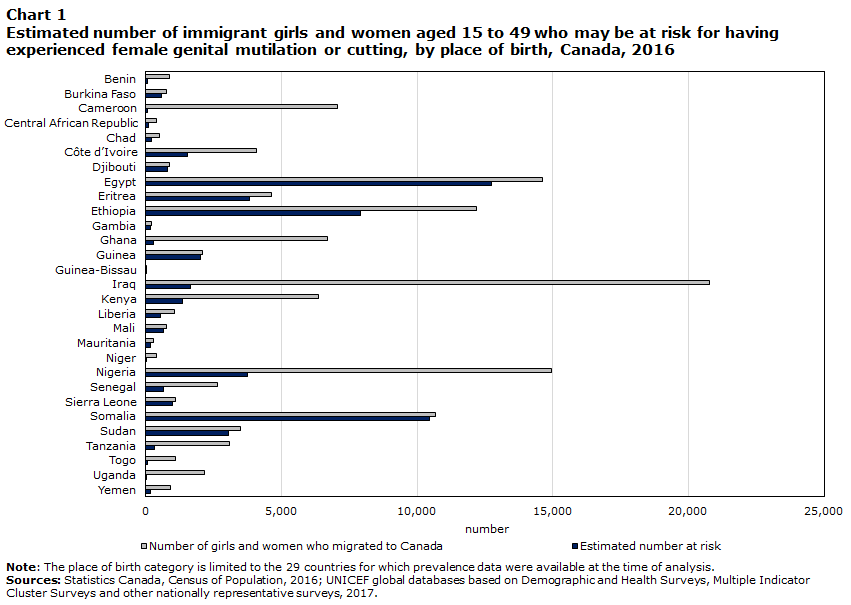
Out of the approximately 125,000 girls and women aged 15 to 49 years who immigrated to Canada from the 29 countries where the prevalence of FGM/C was documented at the time of analysis (UNICEF 2017), about 54,100 were estimated to be at risk for having experienced FGM/C (approach A). In terms of countries of origin, Egypt, Somalia, and Ethiopia were the countries from which the most at-risk girls and women originated. Although a greater overall number of women immigrated to Canada from Iraq or Nigeria, the in-country estimate of FGM/C is much lower, whereas the in-country estimate of FGM/C in Egypt (87%) and Somalia (98%) is relatively high, placing more Egyptian and Somalian girls and women at risk prior to migrating to Canada (see Figure 1).
Data table for Chart 1
| Number of girls and women who migrated to Canada | Estimated number at risk | |
|---|---|---|
| number | ||
| Benin | 875 | 79 |
| Burkina Faso | 765 | 581 |
| Cameroon | 7,070 | 71 |
| Central African Republic | 390 | 94 |
| Chad | 520 | 198 |
| Côte d’Ivoire | 4,075 | 1,549 |
| Djibouti | 875 | 814 |
| Egypt | 14,630 | 12,728 |
| Eritrea | 4,620 | 3,835 |
| Ethiopia | 12,185 | 7,920 |
| Gambia | 220 | 165 |
| Ghana | 6,710 | 268 |
| Guinea | 2,075 | 2,013 |
| Guinea-Bissau | 20 | 9 |
| Iraq | 20,780 | 1,662 |
| Kenya | 6,365 | 1,337 |
| Liberia | 1,070 | 535 |
| Mali | 780 | 647 |
| Mauritania | 270 | 181 |
| Niger | 385 | 8 |
| Nigeria | 14,935 | 3,734 |
| Senegal | 2,655 | 637 |
| Sierra Leone | 1,090 | 981 |
| Somalia | 10,670 | 10,457 |
| Sudan | 3,485 | 3,032 |
| Tanzania | 3,070 | 307 |
| Togo | 1,110 | 56 |
| Uganda | 2,170 | 22 |
| Yemen | 910 | 173 |
|
Note: The place of birth category is limited to the 29 countries for which prevalence data were available at the time of analysis. Sources: Census of Canada 2016, Statistics Canada; UNICEF global databases 2017, based on Demographic and Health Surveys, Multiple Indicator Cluster Surveys and other nationally representative surveys. Last updated: November 2017. |
||
The second approach (B) was similar in that the risk of FGM/C was estimated for first-generation immigrant girls and women in Canada aged 15 to 49; however, estimates of risk were based on the age of the individuals and the proportion who were expected to have experienced FGM/C in five-year age groupings. These age categories were fixed by the DHS and MICS prevalence estimates for FGM/C and were updated in 2016. Approximately 58,400 women were estimated to be at risk for having experienced FGM/C when age-specific estimates were used, slightly higher than the estimate based on the first approach (about 54,100). Given that this estimate is age-specific, it should be viewed as slightly more informative than approach A since, as shown in Appendix B, younger cohorts are less likely to experience FGM/C. Age of immigration was not considered in this report since the country rates of FGM/C were applied to the current age, not the age at which FGM/C might be performed.
Previous research has focused on those aged 15 and older based on the fact that FGM/C is generally practised on girls younger than 15, therefore, women and girls aged 15 and older are presumed to be past the age at which the procedure is likely completed, if it will be performed at all (UNICEF 2013). However, given the large number of girls younger than 15 and women older than 49, adding these girls and women to the estimate of the risk of having experienced FGM/C is relevant. Among the approximately 206,000 girls and women of any age who immigrated to Canada from the 29 countries for which FGM/C prevalence data were available at the time of analysis, about 94,900 girls and women were estimated to be at risk for having experienced FGM/C (approach C). As mentioned above, Egypt, Somalia, and Ethiopia were the countries from which the majority of at-risk girls and women originated, accounting for 55,800 (59%) of them.
Finally, the last approach targeted second-generation girls and women born to mothers and fathers whose country of origin was one of the 29 identified countries. Girls aged 0 to 14 and girls and women aged 15 to 49 were calculated separately (see Figure 2). These estimates of risk are considered a maximum or an upper bound (i.e., the top-end estimate) for the actual number of at-risk girls and women, since the in-country rate of risk is applied to second-generation girls and women and it is known that risk for FGM/C decreases in the migrant country (Exterkate 2013). Since estimates of FGM/C for Canadian-born girls and women are unknown, lower-bound estimates assume no cases (i.e., zero cases) of FGM/C for individuals born in Canada. Further research to better understand second-generation experiences of FGM/C is necessary.

Data table for Chart 2
| 0 to 14 years | 15 to 49 years | |
|---|---|---|
| number | ||
| Mother’s country of birth | 20,200 | 38,300 |
| Father’s country of birth | 22,200 | 44,300 |
| Mother’s and father’s country of birth | 18,100 | 33,300 |
|
Note: The place of birth category is limited to the 29 countries for which prevalence data were available at the time of analysis. Sources: Census of Population 2016, Statistics Canada; UNICEF global databases 2017, based on Demographic and Health Surveys, Multiple Indicator Cluster Surveys and other nationally representative surveys. Last updated: November 2017. |
||
According to approach D and when combining girls aged 0 to 14 years and girls and women aged 15 to 49, approximately 58,500 second-generation girls and women of all ages in Canada were at risk for having experienced FGM/C or of experiencing it in the future based on their mother’s country of origin; about 66,500 girls and women were at risk based on their father’s country of origin. When both parents’ countries of origin were among the 29 identified countries, approximately 51,400 girls and women were considered at risk for FGM/C. Again, this is an upper-bound estimate since the rate of FGM/C among second-generation immigrants is presently unknown.
To summarize the four different approaches taken here, if one considers both first- and second-generation immigrant girls and women aged 15 to 49, approximately 58,400 to 102,700 may be at risk of having experienced FGM/C (Figure 3). The lower-bound estimate was determined from approach B—which is preferred over approach A—because it accounts for age differences. The upper-bound estimate was determined by adding the lower-bound estimate to the highest estimate for those aged 15 to 49 from approach D (44,300; father’s country of birth).
More broadly, when women and girls of all ages are considered, approximately 94,900 to 161,400 of those in Canada may be at risk of having experienced FGM/C or of experiencing it in the future. The lower estimate for all ages of women and girls was determined from approach C, which included girls aged 0 to 14 years in the calculation. The upper estimate was determined by adding the lower-bound estimate to the highest estimates for each age group from approach D together (22,200 for those aged 0 to 14 years and 44,300 for those aged 15 to 49).

Data table for Chart 3
| Upper | Lower | Range | |
|---|---|---|---|
| number | |||
| Ages 15 to 49 | 102,700 | 58,400 | 44,300 |
| All ages | 161,400 | 94,900 | 66,500 |
| Sources: Statistics Canada, Census of Population, 2016; UNICEF global databases based on Demographic and Health Surveys, Multiple Indicator Cluster Surveys and other nationally representative surveys, 2017. | |||
Given the significant number of immigrant girls and women in Canada who may be at risk for FGM/C, it is important to explore key factors, such as geography (where they live) and the type of FGM/C procedure practised, as they may indicate health implications and other long-term effects for women.
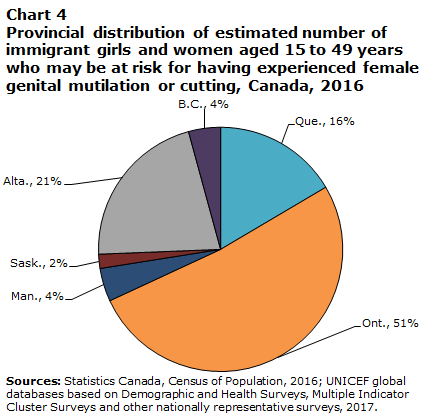
First, the provinces and territories where immigrant girls and women lived were examined. As shown in Figure 4, more than half of the girls and women who may be at risk for FGM/C (51%) lived in Ontario in 2016, reflecting the large proportion of immigrants in the province, while just over one-fifth (21%) lived in Alberta, and 16% lived in Quebec.
Data table for Chart 4
| Provinces | Percent |
|---|---|
| Newfoundland and Labrador | Note ...: not applicable |
| Prince Edward Island | Note ...: not applicable |
| Nova Scotia | Note ...: not applicable |
| New Brunswick | Note ...: not applicable |
| Quebec | 16 |
| Ontario | 51 |
| Manitoba | 4 |
| Saskatchewan | 2 |
| Alberta | 21 |
| British Columbia | 4 |
| Yukon | Note ...: not applicable |
| Northwest Territories | Note ...: not applicable |
| Nunavut | Note ...: not applicable |
|
... not applicable Sources: Statistics Canada, Census of Population, 2016; UNICEF global databases based on Demographic and Health Surveys, Multiple Indicator Cluster Surveys and other nationally representative surveys, 2017. |
|
Second, the type of procedure practised was examined based on a classification developed by the World Health Organization (WHO). The WHO classified countries in terms of four broad categories that reflect the severity of the most commonly practised types of FGM/C (Macfarlane and Dorkenoo 2014).Note The classification was informed by consultations with technical experts who reviewed the typology and evaluated potential alternatives (WHO 2008). Types I and II are the most common forms of FGM/C, and Type III, or infibulation (the most severe type), makes up less than 10% of the world’s cases (Johnsdotter and Essen 2016).
As seen in Figure 5, approximately 18,000 first-generation immigrant girls and women aged 15 to 49 who may be at risk for having experienced FGM/C originated from the four countries identified as having near-universal FGM/C national prevalence and as performing Type III procedures: Somalia, Eritrea, Sudan and Djibouti (Macfarlane and Dorkenoo 2014). Thus, in terms of severity, a large number of girls and women in Canada come from countries practising one of the most harmful forms of FGM/C. Somalia, Egypt, and Ethiopia were the countries from which the most at-risk girls and women aged 15 to 49 originated, and Figure 5 shows that Egypt and Ethiopia were identified as having high national FGM/C prevalence and predominantly practising types I and II. The physical and psychological health implications of all forms of FGM/C have been shown to be extensive (Mulongo, Hollins Martin and McAndrew 2014; Onagoruwa and Wodon 2018), and further research on long-term ramifications of each type of FGM/C is necessary (Johnsdotter and Essen 2016).

Data table for Chart 5
| Number of immigrant girls and women | |
|---|---|
| Almost universal FGM/C, Type III | |
| Somalia | 10,457 |
| Eritrea | 3,835 |
| Sudan | 3,032 |
| Djibouti | 814 |
| High national prevalence, types I and II | |
| Egypt | 12,728 |
| Ethiopia | 7,920 |
| Guinea | 2,013 |
| Sierra Leone | 981 |
| Mali | 647 |
| Burkina Faso | 581 |
| Gambia | 165 |
| Moderate national prevalence, types I and II | |
| Nigeria | 3,734 |
| Iraq | 1,662 |
| Ivory Coast | 1,549 |
| Kenya | 1,337 |
| Senegal | 637 |
| Liberia | 535 |
| Chad | 198 |
| Mauritania | 181 |
| Yemen | 173 |
| Central African Republic | 94 |
| Guinea-Bissau | 9 |
| Low national prevalence, types I and II | |
| Tanzania | 307 |
| Ghana | 268 |
| Benin | 79 |
| Cameroon | 71 |
| Togo | 56 |
| Uganda | 22 |
| Niger | 8 |
|
Notes: FGM/C stands for female genital mutilation or cutting. The place of birth category is limited to the 29 countries for which prevalence data were available at the time of analysis. Sources: Statistics Canada, Census of Population, 2016; UNICEF global databases based on Demographic and Health Surveys, Multiple Indicator Cluster Surveys and other nationally representative surveys, 2017. |
|
Overall, the results suggest that the proportion of women who may be at risk for FGM/C depends on the target population used in the methodology. If one considers only first-generation migrants of childbearing age from 29 identified countries, about 58,400 women may be at risk for having experienced FGM/C (approach B). Adding girls aged 0 to 14, as well as women aged 50 and older, increases this estimate to 94,900 girls and women, and adding second-generation immigrant girls and women aged 0 to 49 produces a range of 94,900 to 161,400 girls and women. A large number of these women have migrated from Somalia, where Type III FGM/C is generally practised, and also from Egypt and Ethiopia, where types I and II of FGM/C are generally practised. Furthermore, more than three-quarters of women who may be at risk for FGM/C live in Ontario, Quebec, and Alberta.
4 Conclusions and limitations
The purpose of this report was to explore different methods to estimate the number of girls and women living in Canada in 2016 who may be at risk for FGM/C. These estimates are important for several areas of public policy such as health care, chiefly women’s health, immigration, and gender equity (Ortensi and Menonna 2017).
Generally, the results indicate that about 58,400 first-generation migrants between the ages of 15 and 49 may be at risk for having experienced FGM/C (based on approach B). When the age range is extended to include girls aged 0 to 14 years and second-generation women and girls in Canada, the estimates range between 94,900 and 161,400. Although the current report is one of the first to identify the risk of FGM/C among girls and women in Canada, several limitations must be acknowledged.
First, the estimates reflect the number of girls and women who may be at risk for FGM/C and not the number who have actually experienced the procedure. The term “at risk” is broadly based on women’s country of birth and, if born in Canada, the country of birth of their parents. “At risk” also broadly means at risk for having experienced FGM/C or of experiencing it in the future—inside or outside Canada.
Second, migrant women, as compared with those who remain in their country of origin, differ in important ways (Farina, Ortensi and Menonna 2016). The selective migration hypothesis (Farina, Ortensi and Menonna 2016) suggests that migrant women leave their country of origin disproportionately based on certain characteristics (i.e., those who have higher education, have higher income, and live in urban areas are more likely to migrate). Education, higher income, and urban geography may also be associated with a lower likelihood of experiencing FGM/C (UNICEF 2013; Ortensi, Farina and Menonna 2015). If one assumes that education, income, and urbanity are associated with a lower likelihood of undergoing FGM/C, and that women who are educated, have higher income, and live in urban areas are more likely to migrate, it is possible that the in-country rates of FGM/C will overestimate the prevalence of FGM/C in migrant countries for those particular women and possibly result in an overestimate of the number of women who may be at risk in Canada.
Similarly, girls and women who migrate to Canada may be less likely to undergo FGM/C once they immigrate because of a change in values based on cultural reflection or comparison with other non-practising immigrants once they are in the new country (Gele, Johansen and Selby 2012). For instance, when immigrant mothers observe that people of a similar religion or culture do not practise FGM/C in Canada, they may be less likely to desire the procedure for their daughters; however, there is also evidence that some women who have undergone FGM/C request reinfibulation from their health providers (Deane et al. 2022). Yet a systematic review suggested that second-generation immigrant girls and women may experience a much lower risk for FGM/C (Exterkate 2013). Additionally, there is evidence that women who migrate from countries that practise FGM/C may be less likely to have undergone FGM/C, in particular if they are from countries with a moderate or low prevalence of FGM/C (UNICEF 2013). Research from Norway has also found that age of migration plays a role, as Somalian girls who were aged at least 12 years when they migrated to Norway were almost five times more likely to have undergone FGM/C than their counterparts who were younger than 12 years when they migrated (Mbanya et al. 2018). Thus, the current estimates for FGM/C among Canadian-born women should be viewed as an upper-bound (or high-end) estimate of risk rather than prevalence. That is, the values stated in this report reflect the number of girls and women who may be at risk for FGM/C and not the number who have actually experienced the procedure.
Third, it should be acknowledged that there is a large degree of within-country variation in FGM/C rates based on a country’s region or ethnicity (Macfarlane and Dorkenoo 2014). Currently, the Canadian census does not collect region-specific immigration data, so the country FGM/C estimates were applied broadly in conducting this analysis. This may lead to an overestimation of the number of women who may be at risk in Canada. Further work could be done to refine the present analyses, including qualitative work or more specific examinations based on region-level immigrant information.
Fourth, although the DHS and MICS provide fairly recent country estimates of FGM/C, these estimates are not all collected for the same year, and the prevalence of FGM/C is constantly changing, generally on a downward trend. For these reasons, an overestimation of the number of women who have undergone FGM/C in more recent years may result. However, since prevalence rates were only available for 29 countries, there may be women and girls in Canada from other countries of origin where FGM/C is practised that are excluded from the calculations, which could lead to an underestimation of the number of girls and women in Canada who are at risk for FGM/C. Therefore, because of the limitations of this study, the results should not be interpreted as official estimates of FGM/C in Canada.
One area for future exploration may be to examine population projections of immigration to see how many women are anticipated (or projected) to immigrate to Canada in the next few decades, and how that relates to FGM/C risk (Ortensi and Menonna 2017). Currently, it is not possible to do so for Canada since population projections can only be performed for large geographic areas (e.g., Northern Africa as a whole) as opposed to individual country levels, because the number of people who immigrate to Canada from each region varies greatly from year to year. However, some shifts in place of birth of immigrants have occurred since 2016, with small increases in individuals migrating from regions which practise FGM/C, such as Western and Eastern Africa, Western Central Asia, and the Middle East.Note Note Therefore, if one considers that immigration rates from the 29 identified countries are generally on the rise, at a level of 1% from Central Africa to a level of 9.5% to 11% from countries such as Iraq in West Central Asia and the Middle East, the absolute number of girls and women living in Canada who may be at risk for FGM/C may also be elevated.
Future work should include a qualitative exploration of the experiences of women from countries that practise FGM/C who now live in Canada. A qualitative approach may be necessary to understand topics that may be more difficult to address than through surveys, in particular when the topics are sensitive and the terms used to describe and understand FGM/C vary. Qualitative work may shine light on regional variations within a country, as well as the applicability of country-specific estimates of FGM/C to second-generation girls and women. Other research methods could also be explored as novel ways to estimate the practice for this generation. Quantitative research approaches could also be improved by considering other factors that may affect the prevalence of FGM/C among immigrant women and girls, such as the age of immigration.
Findings from this study suggest that there are women who may be at risk for FGM/C in Canada. Since FGM/C impacts the health and wellness of those who are affected, further work could focus on understanding the health implications of the practice and inform health care providers, community service providers, and policy makers interested in women’s health care and immigration.
Appendix A
| Country of birth | FGM/C prevalence among girls aged 0 to 14 years |
FGM/C prevalence among girls and women aged 15 to 49 years |
|---|---|---|
| percent | ||
| Benin | 0.2 | 9.0 |
| Burkina Faso | 13.0 | 76.0 |
| Cameroon | Note ...: not applicable | 1.0 |
| Central African Republic | 1.0 | 24.0 |
| Chad | 10.0 | 38.0 |
| Côte d'Ivoire | 10.0 | 38.0 |
| Djibouti | Note ...: not applicable | 93.0 |
| Egypt | 14.0 | 87.0 |
| Eritrea | 33.0 | 83.0 |
| Ethiopia | 16.0 | 65.0 |
| Gambia | 56.0 | 75.0 |
| Ghana | 1.0 | 4.0 |
| Guinea | 46.0 | 97.0 |
| Guinea-Bissau | 30.0 | 45.0 |
| Iraq | Note ...: not applicable | 8.0 |
| Kenya | 3.0 | 21.0 |
| Liberia | Note ...: not applicable | 50.0 |
| Mali | 76.0 | 83.0 |
| Mauritania | 53.0 | 67.0 |
| Niger | Note ...: not applicable | 2.0 |
| Nigeria | 17.0 | 25.0 |
| Senegal | 15.0 | 24.0 |
| Sierra Leone | Note ...: not applicable | 90.0 |
| Somalia | Note ...: not applicable | 98.0 |
| Sudan | 32.0 | 87.0 |
| Tanzania | 0.4 | 10.0 |
| Togo | 0.3 | 5.0 |
| Uganda | 1.0 | 1.0 |
| Yemen | Note ...: not applicable | 19.0 |
|
... not applicable Notes: FGM/C stands for female genital mutilation or cutting. The country of birth category is limited to the 29 countries for which prevalence data were available at the time of analysis. Sources: UNICEF global databases based on Demographic and Health Surveys, Multiple Indicator Cluster Surveys and other nationally representative surveys, 2017. |
||
Appendix B

Data table for Chart B
| Number of girls and women who migrated to Canada | Number at risk for FGM/C | |
|---|---|---|
| number of immigrant girls and women | ||
| 15 to 19 years | 10,260 | 3,510 |
| 20 to 24 years | 11,165 | 4,485 |
| 25 to 29 years | 16,790 | 7,710 |
| 30 to 34 years | 22,315 | 10,381 |
| 35 to 39 years | 22,645 | 10,942 |
| 40 to 44 years | 21,685 | 11,083 |
| 45 to 49 years | 19,925 | 10,279 |
|
Note: FGM/C stands for female genital mutilation or cutting. Sources: Statistics Canada, Census of Population, 2016; UNICEF global databases based on Demographic and Health Surveys, Multiple Indicator Cluster Surveys and other nationally representative surveys, 2017. |
||
References
Australian Institute of Health and Welfare. (2019) Towards estimating the prevalence of female genital mutilation/cutting in Australia. .
Berg, R.C., Underland, V., Odgaard-Jenssn, J., Fretheim, A., & Vist, G.E. 2014. “Effects of female genital cutting on physical health outcomes: a systematic review and meta-analysis.” BMJ Open 4.
Chalmers, B. & Omer Hashi, K. 2002. “What Somali women say about giving birth in Canada.” Journal of Reproductive and Infant Psychology, 20(4): 267–282.
Chalmers, B. & Omer Hashi, K. 2000. “432 Somali women’s birth experiences in Canada after earlier female genital mutilation.” Birth, 27(4): 227–234.
Deane, A., Mattatall, F., & Brown, A. 2022. “Are health care professionals prepared to provide care for patients who have experienced female genital cutting? A cross-sectional survey of Canadian health care providers.” Journal of Obstetrics and Gynaecology Canada, 44(4): 403–406.
Department of Justice. (2017, July 21). Female genital mutilationl.
Dubourg, D., Richard, F., Leye, E., Ndame,S., Rommens, T., & Maes, S. 2011. “Estimating the number of women with female genital mutilation in Belgium.” The European Journal of Contraception and Reproductive Health Care 16: 248–257.
El-Damanhoury, I. (2013). “The Jewish and Christian view on female genital mutilation.” African Journal of Urology 19(3): 127–129.
End FGM European Network, U.S. End FGM/C Network, Equality Now. March 2020. Female genital mutilation/cutting: a call for a global response. Retrieved July 20, 2021.
Exterkate, M. 2013. Female genital mutilation in the Netherlands: prevalence, incidence, and determinants. Utrecht, the Netherlands: PHAROS Centre of Expertise on Health for Migrants and Refugees.
Farina, P.,Ortensi, L.E., & Menonna, A. 2016. “Estimating the number of foreign women with female genital mutilation/cutting in Italy.” European Journal of Public Health 26(4): 656–661.
Gele, A.A., Johansen, E.B., & Selby, J. 2012. “When female circumcision comes to the West: attitudes toward the practice among Somali immigrants in Oslo.” BMC Public Health 12: 697.
Goldberg, H., Stupp, P., Okoroh, E., Besera, G., Goodman, D. & Danel, I. 2016. “Female genital mutilation/cutting in the United States: updated estimates of women and girls at risk, 2012.” Public Health Reports 131: 340–347.
Government of Canada. 2021. Statement by the Prime Minister on International Day of Zero Tolerance for Female Genital Mutilation. Available at: https://pm.gc.ca/en/news/statements/2021/02/06/statement-prime-minister-international-day-zero-tolerance-female-genital.
Hayford, S.R. & Trinitapoli, J. 2011. “Religious differences in female genital cutting: A case study from Burkina Faso.” Journal for the Scientific Study of Religion 50(2): 252–271.
Jacobson, D., Glazer, E., Mason, R., Duplessis, D., Blom, K., DuMont, J., Jassal, N., & Einstein, E. 2018. “The lived experience of female genital cutting in Somali-Canadian women’s daily lives.” PLoS ONE 13(11): 1–24.
Jacobson, D., Grace, D., Boddy, J., & Einstein, G. 2022. “Emotional health work of women with female genital cutting prior to reproductive health care encounters.” Qualitative Health Research, 32(1): 108–120.
Johnsdotter, S., & Essen, B. 2016. “Cultural change after migration: Circumcision of girls in Western migrant countries.” Best Practice & Research in Clinical Obstetrics & Gynaecology 32: 15–25.
Macfarlane, A., & Dorkenoo, E. 2014. “Female genital mutilation in England and Wales: updated statistical estimates of the numbers of affected women living in England and Wales and girls at risk, interim report on provisional estimates.” London: City University London.
Mbanya, V.N., Gele, A.A., Diaz, E. & Kumar, B. 2018. “Health care-seeking patterns for female genital mutilation/cutting among young Somalis in Norway.” BMC Public Health, 18: 517.
Moges, A. (2003). What is behind the tradition of FGM? African Women’s Organization. Available at: https://www.support- africanwomen.org/images/downloads/FGM-Themen/FGM-Was_steckt_dahinter-EN-web.pdf
Mulongo, P., C. Hollins Martin, & McAndrew, S. 2014. “The psychological impact of female genital mutilation/cutting (FGM/C) on girls/women’s mental health: a narrative literature review.” Journal of Reproductive and Infant Psychology 32.
Onagoruwa, A., & Wodon, Q. 2018. Selected factors leading to the transmission of female genital mutilation across generations: quantitative analysis for six African countries. Ending Violence against Women Notes Series. Washington, D.C.: The World Bank.
Ortensi, L.E., P. Farina, & Menonna, A. 2015. “Improving estimates of the prevalence of female genital mutilation/cutting among migrants in Western countries.” Demographic Research 32 (18): 543–562.
Ortensi, L.E., & Menonna, A. 2017. “Migrating with special needs? Projections of flows of migrant women with female genital mutilation/cutting toward Europe 2016–2030.” European Journal of Population 33: 559–583.
Packer, C., Runnels, V. & Labonté, R. 2015. “Canada’s response to female genital mutilation: are we failing our girls?” Canadian Medical Association Journal 187(6), e188–e189.
Peron, L., V. Senikas, M. Burnett, & Davis, V. 2013. “Clinical practice guidelines: female genital mutilation.” Journal of Obstetrics and Gynaecology Canada 35 (11): e1–e18.
Population Reference Bureau. (2016). Risk of female genital mutilation/cutting in the United States.
Statistics Canada. 2021. Disaggregated Data Action Plan: why it matters to you. Available at: Disaggregated data action plan: Why it matters to you (statcan.gc.ca) UNFPA-UNICEF. 2017. 2016 Annual Report of the UNFPA–UNICEF Joint Programme on Female Genital Mutilation/Cutting: Accelerating Change by the Numbers.
UNICEF. 2013. Female genital mutilation/cutting: a statistical overview and exploration of the dynamics of change. New York: UNICEF.
UNICEF. 2017. Female genital mutilation / cutting (FGM/C). UNICEF global databases 2017 (Last update: November 2017), based on Demographic and Health Surveys, Multiple Indicator Cluster Surveys and other nationally representative surveys. Retrieved November 2017, from data.unicef.org.
UNICEF. 2020. Female genital mutilation (FGM). Retrieved July 20, 2021.
United Nations. (n.d.). Goal 5 - Achieve gender equality and empower all women and girls. Retrieved July 20, 2021.
World Health Organization. 2008. Eliminating female genital mutilation: an interagency statement. Geneva: WHO, UNFPA, UNICEF, UNIFEM, OHCHR, UNHCR, UNECA, UNESCO, UNDP and UNAIDS.
World Health Organization. 2022. Female genital mutilation. Retrieved June 7, 2022.
- Date modified: