
Analytical Studies: Methods and References
Construction and Assessment of a Social Inclusion Index for the Canada Mortgage and Housing Corporation: Technical Report
Skip to text
Text begins
Acknowledgements
The social inclusion index presented in this report has been designed and commissioned by the Canada Mortgage and Housing Corporation. The social inclusion index is not a Statistics Canada concept, nor is it endorsed by Statistics Canada.
Abstract
Using data from the Canadian Housing Survey, this project aimed to construct a measure of social inclusion, using indicators identified by the Canada Mortgage and Housing Corporation (CMHC), to report a social inclusion score for each geographic stratum separately for dwellings that are and are not in social and affordable housing. This project also sought to examine associations between social inclusion and a set of economic, social and health variables.
The Social Inclusion Index (SII) was designed and commissioned by CMHC. Five items were selected as indicators for the SII: dwelling satisfaction, neighbourhood satisfaction, satisfaction with feeling part of the community, sense of safety and economic hardship. A composite SII score was calculated based on an average of these indicators to examine associations between the SII composite score and a set of economic, social and health variables.
Overall, the findings supported an SII based on the five selected indicators, and provided a further assessment of the SII across different groups of interest for CMHC, with several noted differences. Although providing an explanation for the observed differences is beyond the scope of this study, the findings highlighted the need for future research to replicate and broaden the current findings, and to shed light on the observed differences. In particular, the extent to which the SII construct measures “social inclusion” warrants further research.
1 Introduction
A number of review articles on social inclusion (Baumgartner and Burns 2014; Coombs, Nicholas and Pirkis 2013; Filia et al. 2018) emerged in the last decade. Despite continued interest in social inclusion, there are still fundamental knowledge gaps, such as what social inclusion is and how it can be measured. In fact, there are various conceptualizations of social inclusion (Filia et al. 2018), and there is a consensus that it is difficult to measure social inclusion with precision (United Nations 2018). Social inclusion is often considered multifaceted and complex, and it includes a range of key quality-of-life indicators—such as participation in social activities, community involvement, suitable housing in a safe neighbourhood, involvement in education, health and well-being, and service utilization—(Levitas et al. 2007). However, there are few instruments that have adequate psychometric properties to measure social inclusion (Coombs, Nicholas and Pirkis 2013).
The Canada Mortgage and Housing Corporation (CMHC) has conducted extensive consultations with experts and has commissioned research and literature reviews (e.g., Eberle and Serge 2007) on social inclusion. In light of their programs and policies, CMHC defined social inclusion as “a situation in which individuals have the resources and opportunities to be involved in society to an extent that is satisfactory to them” (CMHC 2018). However, a measure of social inclusion has been lacking. To this end, CMHC has committed to developing a Social Inclusion Index (SII), and has identified several indicators to measure social inclusion using the information from the Canadian Housing Survey (CHS). As stated by CMHC, the SII “will help inform on the self-reported sense of satisfaction with regard to opportunities and resources in relation to respondents’ housing and community.”
This study had three objectives: to construct a measure of social inclusion using indicators identified by CMHC, to report a social inclusion score for each geographic stratum separately for dwellings that are and are not in social and affordable housing (SAH), and to examine associations between social inclusion and a set of economic, social and health variables. The SII was designed and commissioned by CMHC.
Section 2 discusses the data, key measures and methods. The results are presented in Section 3, and conclusions are provided in Section 4.
2 Data, measures and methods
Data
Data from the 2018 Canadian Housing Survey, fielded between November 2018 and March 2019, were used for this project. The CHS is conducted biennially and is designed to collect information about core housing needs, dwelling and neighbourhood satisfaction, housing moves or intentions to move, and other aspects of well-being related to housing. Overall, the CHS aims to provide information about how Canadians feel about their housing and how housing affects them. The target population for the CHS is private households across Canadian provinces and territories.Note
The sample for the 2018 CHS consisted of approximately 65,000 dwellingsNote in 45 geographic strata.Note One questionnaire was completed per dwelling by an individual responsible for housing decisions.
Measures and methods
Initially, three potential social inclusion models were identified based on indicators selected by CMHC. These three models were explored and tested via exploratory factor analysis (EFA) and confirmatory factor analysis (CFA). The results from these analyses are summarized in Technical Appendix A. Based on these results and further group discussions, CMHC selected five indicators for the SII:
- How satisfied are you with your dwelling? (dwelling satisfaction)
- How satisfied are you with your neighbourhood? (neighbourhood satisfaction)
- Using a scale of 0 to 10, where 0 means “very dissatisfied” and 10 means “very satisfied,” how satisfied are you with feeling as part of your community?Note (satisfaction with feeling part of community)
- How safe do you feel from crime walking alone in your area after dark? (sense of safety)
- In the past 12 months, how difficult or easy was it for your household to meet its financial needs in terms of transportation, housing, food, clothing and other necessary expenses? (economic hardship).
First, descriptive statistics for these five indicators were examined. Next, the suitability of the data for factor analysis was assessed. These five indicators were then subjected to a CFA to verify the pattern of the relationship between the indicators and the underlying dimension of an SII construct (Schumacker and Lomax 2004). The main question in the CFA was whether the model showed a good fit to the data. Model fit was evaluated (see O’Rourke and Hatcher, 2013) using the standardized root mean squared residual (SRMR) (Asparouhov and Muthen 2018), the root mean square error of approximation (RMSEA)—with its corresponding 90% confidence intervals—and the comparative fit index (CFI) global goodness-of-fit statistics, using criterion values recommended by Hu and Bentler (1999). When these criteria were met, the model was deemed a good fit to the data.
The parameter estimates of all indicators were also considered to evaluate model fit (Schumacker and Lomax 2004). A composite SII scoreNote was derived based on the average of these indicators, and scores ranged between 0.75 and 5.33 (first quartile = 3.50, second quartile (median) = 3.96, and third quartile = 4.36). Finally, associations between the composite SII score and a set of economic, social and health variables were examined. All analyses were conducted with sampling and bootstrap weights to account for the complex survey design of the CHS, using SAS version 9.3 unless noted differently.
3 Results
Descriptive statistics of the Social Inclusion Index indicators
About 8 in 10 respondents reported that they were either very satisfied (36.8%) or satisfied (45.8%) with their dwelling. A slightly higher percentage of respondents reported that they were very satisfied (43.8%) or satisfied (41.7%) with their neighbourhood. In contrast, less than half (44.5%) of respondents reported that they were very satisfied or almost very satisfied (a score of 8 and above) with feeling part of their community. Not many missing data were observed for the feeling part of the community indicator: 0.1%, including respondents in the Northwest Territories who were not asked this question, and 1.5%, including respondents who did not provide a response.
Regarding sense of safety, just under three-quarters of respondents reported feeling very safe (30.9%) or reasonably safe (42.9%) from crime when they were walking alone in their area after dark. Finally, just under a quarter of respondents indicated that it had been very difficult (5.1%) or difficult (17.0%) to meet their household’s financial needs in the past 12 months, compared with about 4 in 10 who indicated that it had been easy (25.0%) or very easy (11.8%). Not many missing data were observed for these two indicators—0.2% for sense of safety and 0.3% ability to meet household financial needs, respectively.
The majority of respondents reported being very satisfied or satisfied with their dwelling or neighbourhood. In contrast, less than half were very satisfied or almost very satisfied with feeling part of their community. About 7 in 10 respondents felt very safe or reasonably safe from crime when they were walking alone in their area after dark and, finally, about 4 in 10 indicated that they did not have difficulties meeting their household’s financial needs in the past 12 months. Not many missing data were observed. Little’s missing completely at random (MCAR) test (Little 1988) suggested that these missing data were not (MCAR), χ2 (31) =1258.20, p < 0.0001. The majority of the missing data patterns involved missing values for a single item. It should be noted that the sampling weights were adjusted to treat missing data as missing at random.
Confirmatory factor analysis of SII items
To assess the suitability of the data for factor analysis, first model assumptions (i.e., linearity, normality, and multicollinearity) were evaluated. There were no major violations of assumptions, so the data were considered suitable for factor analysis. Next, a correlation matrix was examined (Table 1). The correlationsNote among the five items ranged from 0.13 to 0.42, with an acceptable internal consistency (Cronbach’s alpha = 0.63). Notably, the sense of safety item, in general, had the weakest associations with the other four items. However, this item was kept in the SII model for conceptual reasons.
TABLE 1
| Number of the item | SII indicators | SII indicators | ||||
|---|---|---|---|---|---|---|
| 1 | 2 | 3 | 4 | 5 | ||
| correlation coefficients | ||||||
| 1 | Dwelling satisfaction | 1 | Note ...: not applicable | Note ...: not applicable | Note ...: not applicable | Note ...: not applicable |
| 2 | Neighbourhood satisfaction | 0.42 | 1 | Note ...: not applicable | Note ...: not applicable | Note ...: not applicable |
| 3 | Satisfaction with feeling part of community | 0.33 | 0.38 | 1 | Note ...: not applicable | Note ...: not applicable |
| 4 | Sense of safety | 0.13 | 0.23 | 0.13 | 1 | Note ...: not applicable |
| 5 | Economic hardship | 0.31 | 0.22 | 0.23 | 0.13 | 1 |
|
... not applicable Note: All correlation coefficients are statistically significant at p < 0.0001. SII: Social Inclusion Index. Source: Statistics Canada, Canadian Housing Survey (CHS), 2018. |
||||||
A single-factor CFA model with five items was assessed using sampling weights and the weighted-least-square-mean-and-variance-adjusted-estimators (WLSMV) estimation methodNote in Mplus, version 8.3. All variables were specified as categorical except the “satisfaction with feeling part of the community” variable. Given the large sample size, the chi-square value was statistically significant, χ2 (5) =469.78, p < 0.0001. Based on the global goodness-of-fit statistics and the recommended values by Hu and Bentler (1999),Note the single-factor CFA model of SII showed a good fit to the data (SRMR = 0.022; RMSEA [90% confidence intervals] = 0.038 [0.035-0.041]; CFI = 0.973). Factor loadings for the five indicators were all statistically significant and ranged from 0.37 to 0.74 (Figure 1). Taken together, these results supported a single-factor structure for the SII based on the five selected indicators. An equal weighting strategy was used, and a composite score based on the average of the indicator scores was calculated to examine associations between SII and a set of economic, social and health variables.
Figure 1. A Social Inclusion Index model
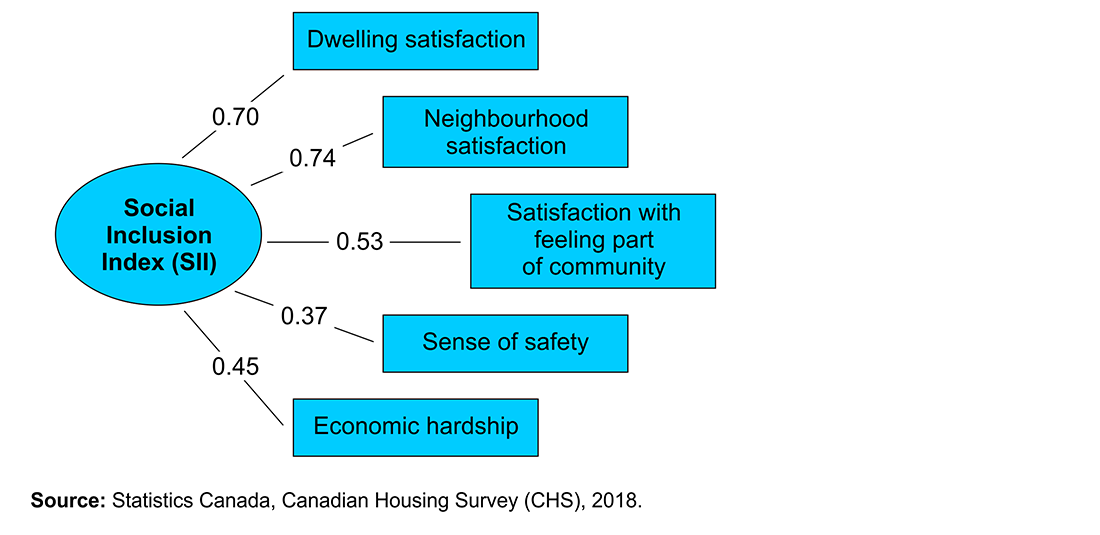
Description for Figure 1
The figure shows the construct of social inclusion index with five indicators along with their factor loadings ranging from 0.37 for sense of safety to 0.74 for neighbourhood satisfaction.
The indicator factor loadings are Dwelling satisfaction (0.70), Neighbourhood satisfaction (0.74), Satisfaction with feeling part of community (0.53), Sense of safety 0.37) and Economic hardship (0.45).
Source: Statistics Canada, Canadian Housing Survey (CHS), 2018.
Associations between SII and economic, social and health variables
This section includes an examination of the associations between the SII and a set of economic, social and health variables. These analyses aimed to provide a further assessment of the SII across different groups of interest for CMHC.
Differences by province and territory
The average SII score in Canadian households was 3.9 (out of 5.3), which suggests relatively moderate to high feelings of social inclusion, as reported by respondents who were responsible for housing decisions. SII scores were higher in households in Newfoundland and Labrador, Prince Edward Island, New Brunswick, and Quebec compared with households in the other provinces and territories. Comparatively, SII scores were lower in households in Ontario, Manitoba, Saskatchewan, Alberta, British Columbia, the Northwest Territories and Nunavut compared with households in the other provinces and territories (Table 2).
TABLE 2
| Number | Mean | 95% lower confidence limit | 95% upper confidence limit | |
|---|---|---|---|---|
| Canada | 14,790,354 | 3.9 | 3.9 | 3.9 |
| Newfoundland and Labrador | 218,825 | 4.0Table 2 Note ‡ | 4.0 | 4.0 |
| Prince Edward Island | 62,182 | 4.1Table 2 Note ‡ | 4.0 | 4.1 |
| Nova Scotia | 410,841 | 3.9 | 3.9 | 4.0 |
| New Brunswick | 323,211 | 4.0Table 2 Note ‡ | 3.9 | 4.0 |
| Quebec | 3,664,656 | 4.0Table 2 Note ‡ | 4.0 | 4.0 |
| Ontario | 5,551,996 | 3.9Table 2 Note ‡ | 3.8 | 3.9 |
| Manitoba | 498,891 | 3.9Table 2 Note ‡ | 3.8 | 3.9 |
| Saskatchewan | 442,149 | 3.9Table 2 Note ‡ | 3.8 | 3.9 |
| Alberta | 1,612,560 | 3.8Table 2 Note ‡ | 3.8 | 3.8 |
| British Columbia | 1,964,363 | 3.8Table 2 Note ‡ | 3.8 | 3.9 |
| Yukon | 15,865 | 4.0 | 3.9 | 4.0 |
| Northwest Territories | 14,760 | 3.8Table 2 Note ‡ | 3.8 | 3.8 |
| Nunavut | 10,055 | 3.8Table 2 Note ‡ | 3.7 | 3.9 |
|
||||
Differences by geographic strata
In the CHS, 45 geographic strata were identified, using census subdivision boundaries as domains of interest. SII scores varied across these geographic strata. For example, SII scores were higher in the city of Québec and Montréal, but lower in Toronto, Winnipeg, Saskatoon, Calgary and Vancouver compared with those of the other geographic strata combined (Table 3).
TABLE 3
| Number | Mean | 95% lower confidence limit | 95% upper confidence limit | |
|---|---|---|---|---|
| Canada | 14,790,354 | 3.9 | 3.9 | 3.9 |
| St. John's | 88,114 | 3.9 | 3.8 | 3.9 |
| Halifax | 185,966 | 3.9 | 3.9 | 3.9 |
| Moncton | 66,525 | 3.9 | 3.8 | 3.9 |
| Saint John | 53,806 | 3.9 | 3.9 | 4.0 |
| Québec | 366,313 | 4.1Table 3 Note § | 4.1 | 4.1 |
| Montréal | 1,804,539 | 4.0Table 3 Note § | 3.9 | 4.0 |
| Ottawa–Gatineau | 569,211 | 3.9 | 3.9 | 3.9 |
| Toronto | 2,333,320 | 3.8Table 3 Note § | 3.8 | 3.8 |
| Hamilton | 316,480 | 3.9 | 3.8 | 3.9 |
| Kitchener–Cambridge–Waterloo | 211,177 | 3.8Table 3 Note § | 3.8 | 3.9 |
| Winnipeg | 328,717 | 3.8Table 3 Note § | 3.8 | 3.8 |
| Regina | 103,349 | 3.8Table 3 Note § | 3.8 | 3.8 |
| Saskatoon | 126,203 | 3.8Table 3 Note § | 3.8 | 3.9 |
| Calgary | 550,990 | 3.8Table 3 Note § | 3.8 | 3.9 |
| Edmonton | 543,959 | 3.8Table 3 Note § | 3.7 | 3.8 |
| Lethbridge | 45,340 | 3.8Table 3 Note § | 3.7 | 3.8 |
| Vancouver | 1,029,189 | 3.8Table 3 Note § | 3.8 | 3.8 |
Source: Statistics Canada, Canadian Housing Survey (CHS), 2018. |
||||
Differences by population centre size
SII scores also varied by population centre size. Households in both rural areas and small population centres had slightly higher SII scores compared with households in large urban population centres (Table 4).
TABLE 4
| Number | Mean | 95% lower confidence limit | 95% upper confidence limit | |
|---|---|---|---|---|
| Total | 14,790,354 | 3.9 | 3.9 | 3.9 |
| Rural area | 2,501,179 | 4.1Note * | 4.1 | 4.1 |
| Small population centre, population between 1,000 to 29,999 | 1,928,527 | 4.0Note * | 3.9 | 4.0 |
| Medium population centre, population between 30,000 and 99,999 | 1,410,425 | 3.8 | 3.8 | 3.9 |
| Large urban population centre, population of 100,000 or more (reference group) | 8,950,223 | 3.8 | 3.8 | 3.9 |
|
||||
Differences by social and affordable housing status
One of the objectives of the CHS is to provide detailed information on households in SAH. The average SII score was 4.0 for owner households. Renter households both in SAH and not in SAH had lower SII scores than owner households (3.5 and 3.7, respectively). Notably, renter households in SAH had the lowest SII score (Table 5).
TABLE 5
| Number | Mean | 95% lower confidence limit | 95% upper confidence limit | |
|---|---|---|---|---|
| Total | 14,790,354 | 3.9 | 3.9 | 3.9 |
| Renter household in SAH | 628,757 | 3.5Note * | 3.5 | 3.6 |
| Renter household not in SAH | 4,023,796 | 3.7Note * | 3.7 | 3.7 |
| Owner household (reference group) | 10,137,801 | 4.0 | 4.0 | 4.0 |
|
||||
Differences by dwelling type
When dwelling type was considered, SII scores were slightly higher for detached households compared with all other dwelling types. Notably, SII scores were lowest in low-rise and high-rise apartments (Table 6).
TABLE 6
| Number | Mean | 95% lower confidence limit | 95% upper confidence limit | |
|---|---|---|---|---|
| Total | 14,790,354 | 3.9 | 3.9 | 3.9 |
| Detached (reference group) | 7,448,379 | 4.0 | 4.0 | 4.0 |
| Semi-detached, flat, other single | 1,543,304 | 3.9Note * | 3.8 | 3.9 |
| Row | 958,087 | 3.8Note * | 3.7 | 3.8 |
| Apartment, low rise | 2,766,743 | 3.7Note * | 3.7 | 3.8 |
| Apartment, high rise | 1,639,736 | 3.7Note * | 3.7 | 3.7 |
| Moveable dwelling | 179,258 | 3.9Note * | 3.8 | 4.0 |
|
||||
Differences by core housing need
A household is in core housing need “if its housing does not meet one or more of the adequacy, suitability or affordability standards, and it would have to spend 30% or more of its before-tax income to access acceptable local housing” (CMHC 2018). Households in core housing need had lower SII scores compared with households not in core housing need (Table 7).
TABLE 7
| Number | Mean | 95% lower confidence limit | 95% upper confidence limit | |
|---|---|---|---|---|
| Total | 14,790,354 | 3.9 | 3.9 | 3.9 |
| Households in core housing need | 1,644,858 | 3.6Note * | 3.5 | 3.6 |
| Households not in core housing need (reference group) | 12,540,222 | 3.9 | 3.9 | 4.0 |
|
||||
Thus far, SII scores were examined across different geographic and housing characteristics. Several differences were noted. In summary, the SII scores were higher in the Atlantic provinces (except for Nova Scotia) and Quebec compared with the other provinces and territories combined. In particular, the city of Québec and Montréal had higher SII scores compared with other geographic strata. SII scores were also higher in rural areas and small population centres, owner households, and detached dwellings. Households in core housing need had lower SII scores.
The next set of analyses focused on the characteristics of the respondents who were responsible for housing decisions, with a particular focus on the National Housing Strategy priority vulnerable groups (CMHC 2018).
Differences by age groups
Compared with younger respondents (aged 15 to 34), older respondents had higher SII scores. Notably, the average SII score was highest in households with respondents aged 65 or older (Table 8). The average SII score for households with respondents aged 18 to 29 was similar (3.8) to that for households with respondents aged 15 to 34 (data not shown).
TABLE 8
| Number | Mean | 95% lower confidence limit | 95% upper confidence limit | |
|---|---|---|---|---|
| Total | 14,790,354 | 3.9 | 3.9 | 3.9 |
| 15 to 34 years old (reference group) | 2,661,818 | 3.8 | 3.8 | 3.8 |
| 35 to 64 years old | 8,296,000 | 3.9Note * | 3.9 | 3.9 |
| 65 years old or older | 3,832,536 | 4.0Note * | 4.0 | 4.0 |
|
||||
Differences by gender
On average, SII scores were lower among female respondents compared with male respondents (3.8 vs. 4.0). Respondents who reported their gender as being other than male or female had the lowest SII scores (Table 9).
TABLE 9
| Number | Mean | 95% lower confidence limit | 95% upper confidence limit | |
|---|---|---|---|---|
| Total | 14,790,354 | 3.9 | 3.9 | 3.9 |
| Male (reference group) | 7,426,625 | 4.0 | 4.0 | 4.0 |
| Female | 7,353,142 | 3.8Note * | 3.8 | 3.9 |
| Other, please specify | 10,586 | 3.0Note * | 2.6 | 3.5 |
|
||||
Differences by lesbian, gay, bisexual, transgender, queer and two-spirited identity or any other gender identity
When the SII scores were examined by lesbian, gay, bisexual, transgender, queer and two‑spirited identity or any other gender identity (LGBTQ2+), respondents who identified as homosexual, bisexual or another LGBTQ2+ identity had lower SII scores compared with heterosexual respondents (Table 10).
TABLE 10
| Number | Mean | 95% lower confidence limit | 95% upper confidence limit | |
|---|---|---|---|---|
| Total | 14,790,354 | 3.9 | 3.9 | 3.9 |
| Heterosexual (reference group) | 13,793,846 | 3.9 | 3.9 | 3.9 |
| Homosexual | 246,436 | 3.8Note * | 3.6 | 3.9 |
| Bisexual | 262,818 | 3.7Note * | 3.6 | 3.7 |
| Other, please specify | 55,587 | 3.7Note * | 3.5 | 3.8 |
Source: Statistics Canada, Canadian Housing Survey (CHS), 2018. |
||||
Differences by immigrant status
Households with immigrant respondents had lower SII scores compared with households with non-immigrant respondents. This results pattern was similar for households with recent immigrant respondents and for immigrants who landed prior to 2013 (Table 11).
TABLE 11
| Number | Mean | 95% lower confidence limit | 95% upper confidence limit | |
|---|---|---|---|---|
| Total | 14,790,354 | 3.9 | 3.9 | 3.9 |
| Not immigrant (reference group) | 12,540,402 | 3.9 | 3.9 | 3.9 |
| Recent immigrant (landing year between 2013 and 2018) | 399,225 | 3.7Note * | 3.6 | 3.8 |
| Immigrant (landing year before 2013) | 1,850,727 | 3.7Note * | 3.7 | 3.8 |
|
||||
Differences by household income quintiles
There was a gradient effect between SII scores and household income quintiles such that households in the lowest income quintile had the lowest SII scores, and households in the top income quintile had the highest scores (Table 12).
TABLE 12
| Number | Mean | 95% lower confidence limit | 95% upper confidence limit | |
|---|---|---|---|---|
| Total | 14,790,354 | 3.9 | 3.9 | 3.9 |
| Lowest | 2,957,408 | 3.7Note * | 3.7 | 3.7 |
| Second | 2,958,688 | 3.8Note * | 3.8 | 3.9 |
| Third | 2,958,072 | 3.9Note * | 3.9 | 3.9 |
| Fourth | 2,956,811 | 4.0Note * | 3.9 | 4.0 |
| Top (reference group) | 2,959,376 | 4.1 | 4.1 | 4.1 |
|
||||
Differences by homelessness
The average SII score was lower among respondents who had ever been homeless compared with those who had never been homeless (Table 13).
TABLE 13
| Number | Mean | 95% lower confidence limit | 95% upper confidence limit | |
|---|---|---|---|---|
| Total | 14,790,354 | 3.9 | 3.9 | 3.9 |
| Yes | 364,268 | 3.4Note * | 3.4 | 3.5 |
| No (reference group) | 14,405,410 | 3.9 | 3.9 | 3.9 |
|
||||
Thus far, the analyses have focused on respondents’ sociodemographic characteristics and have suggested that SII scores were higher among seniors, men, heterosexual people, non‑immigrants, and those in households in the top income quintile. In addition, respondents who had ever been homeless had lower SII scores.
The final set of analyses focused on respondents’ physical, mental and social well-being characteristics.
Differences by general mental health
There was a gradient effect between SII scores and general mental health such that respondents who reported excellent general mental health had highest SII scores and those who reported poor general mental health had the lowest scores (Table 14). A similar gradient effect was observed for general physical health (data not shown).
TABLE 14
| Number | Mean | 95% lower confidence limit | 95% upper confidence limit | |
|---|---|---|---|---|
| Total | 14,790,354 | 3.9 | 3.9 | 3.9 |
| Poor (reference group) | 348,182 | 3.0 | 2.9 | 3.1 |
| Fair | 1,214,481 | 3.4Note * | 3.4 | 3.5 |
| Good | 4,323,646 | 3.7Note * | 3.7 | 3.8 |
| Very good | 4,959,351 | 4.0Note * | 4.0 | 4.0 |
| Excellent | 3,873,414 | 4.2Note * | 4.2 | 4.2 |
|
||||
Differences by life satisfaction
Respondents who reported being very satisfied with life had the highest SII scores, whereas those who reported being very dissatisfied with life had the lowest scores (Table 15).
TABLE 15
| Number | Mean | 95% lower confidence limit | 95% upper confidence limit | |
|---|---|---|---|---|
| Total | 14,790,354 | 3.9 | 3.9 | 3.9 |
| 0 (very dissatisfied) to 5 (reference group) | 2,318,252 | 3.2 | 3.2 | 3.3 |
| 6 | 1,102,862 | 3.5Note * | 3.5 | 3.6 |
| 7 | 2,605,662 | 3.7Note * | 3.7 | 3.8 |
| 8 | 3,877,994 | 4.0Note * | 4.0 | 4.0 |
| 9 | 1,882,995 | 4.2Note * | 4.2 | 4.2 |
| 10 (very satisfied) | 2,882,238 | 4.4Note * | 4.4 | 4.4 |
|
||||
Overall, these results indicated a systematic relationship between SII and well-being. The SII scores were highest among respondents with excellent general physical or mental health, as well as those who were very satisfied with life. SII scores gradually decreased and were lowest among respondents with poor general physical or mental health, as well as those who were very dissatisfied with life.
4 Conclusion
Using data from the Canadian Housing Survey, this project sought to construct a measure of social inclusion, using indicators identified by CMHC, to report a social inclusion score for each geographic stratum separately for dwellings in SAH and dwellings not in SAH, and to examine associations between social inclusion and a set of economic, social and health variables.
The SII was designed and commissioned by CMHC. CMHC selected five indicators for the SII: dwelling satisfaction, neighbourhood satisfaction, satisfaction with feeling part of the community, sense of safety and economic hardship. A single-factor SII structure based on these five selected items indicated a good fit of the model to the data. In other words, the findings suggested that dwelling and neighbourhood satisfaction, feeling part of the community, sense of safety, and economic hardship are related in a way that represents a common underlying construct, although the extent to which this construct measures social inclusion warrants further research. Based on these five indicators, a composite SII score was calculated, and associations between this SII composite score and a set of economic, social and health variables were examined.
Firstly, the SII scores were examined across different geography and housing characteristics. The SII scores were higher in the Atlantic Provinces (except for Nova Scotia) and Quebec compared with the other provinces and territories combined. In particular, the city of Québec and Montréal had higher SII scores compared with other geographic strata. SII scores were also higher in rural areas and small population centres, owner households, and detached dwellings. Households in core housing need had lower SII scores.
Secondly, the SII scores were examined across a range of respondent sociodemographic characteristics. The findings indicated that SII scores were higher among seniors, men, heterosexual people, non-immigrants and those in households in the top income quintile. In addition, respondents who had ever been homeless had lower SII scores. Although providing an explanation for the observed differences is beyond the scope of this study, these findings highlight the need for future research to shed light on these differences.
Finally, the SII scores were examined across respondents’ physical, mental and social well-being characteristics. A gradient effect was observed for all three characteristics. Specifically, SII scores were highest among respondents with excellent general physical or mental health, as well as those who were very satisfied with life. SII scores gradually decreased and were lowest among respondents with poor general physical or mental health, as well as those who were very dissatisfied with life.
Taken together, the findings supported an SII based on the five selected indicators, and provided a further assessment of the SII across different groups of interest for CMHC. Despite the encouraging results, one source of evidence can never be entirely adequate to establish construct validity (Hubley and Zumbo 1996) because construct validation is an ongoing process (Zumbo 2007). Therefore, the process of construct validation for the SII cannot be drawn solely from the present study. Future conceptual and empirical work is warranted to replicate and broaden the current findings. In particular, the extent to which the SII construct measures social inclusion warrants further research.
5 Technical Appendix A
Three potential models of social inclusion were systematically assessed: a large (19 items), medium (9 items) and small (6 items) model (Table 1A). After providing support for the structural validity of each of these three potential models, the construct validity of each was further assessed in terms of their association with selected outcomes from the Canadian Housing Survey (CHS), including life satisfaction, general and mental health, and intention to move.
Factor analysis was used to construct and assess potential models of social inclusion. Factor analysis, often used when developing a measure, is a statistical technique that reveals relationship patterns among variables thought to measure a construct of interest (Tabachnick and Fidell 2012). There are two types of factor analysis: exploratory and confirmatory. In exploratory factor analysis (EFA), the aim is to describe and summarize data by grouping items that are correlated to reveal the underlying construct of interest. In contrast, in confirmatory factor analysis (CFA), the aim is to verify the pattern of the relationship between the items and the underlying dimensions of a construct of interest (Schumacker and Lomax 2004). In summary, while EFA is associated with theory development, CFA is a more sophisticated technique than EFA and is associated with theory testing (Brown 2014). Both EFA and CFA were used to construct and assess potential models of social inclusion.
It is not recommended to run an EFA and a CFA on the same dataset because the analyses may lead to a final model that may not be generalized to other samples or populations (O’Rourke and Hatcher 2013). Given this, the CHS data were randomly divided into two datasets with an equal distribution of data by province, region, and social and affordable housing. The first dataset was used for EFA to explore potential models of social inclusion and, specifically, to determine the number of factors that could be retained to measure social inclusion. The second dataset was used for CFA to test whether the model showed a good fit to the data. Prior to EFA, the suitability of the data for factor analysis was assessed. Multiple criteria were used to evaluate the results from EFA and CFA.
For the EFA, Kaiser’s measure of sampling adequacy was first obtained to determine whether it was appropriate to proceed with the EFA. Next, a polychoric correlation matrix among all items was inspected and internal consistency (i.e., Cronbach alpha) was assessed to determine whether all preselected items in the model were relevant for EFA. Subsequently, an initial unrestricted EFA solution using selected items was examined. A parallel analysis (O’Connor 2000 and 2018) was also run to determine the number of factors that should be retained in addition to the inspection of scree plots and the eigenvalue >1 criteria. The factor loadings, including cross-loadings, were also evaluated according to the selected criteria. If an item was removed during the evaluation process, a new EFA was run. A parallel analysis was conducted each time.
Once the model was finalized in EFA, it was subjected to a CFA. The main question in the CFA was whether the model showed a good fit to the data. If yes, factor (and average) scores were computed. If not, some modifications, such as the exclusion of an item, were made to improve the model fit. Model fit in CFA was evaluated using the standardized root mean squared residual (SRMR), the root mean square error of approximation (RMSEA) (with its corresponding 90% confidence intervals) and the comparative fit index (CFI) global goodness-of-fit statistics (O’Rourke and Hatcher 2013), using criterion values recommended by Hu and Bentler (1999). When these criteria were met, the model was deemed as a good fit to the data. The parameter estimates of all items were also considered to evaluate model fit (Schumacker and Lomax 2004).
Large model
The EFA model included 19 items and suggested five factors with eigenvalues greater than 1. The model explained 51% of the variance. The internal consistency of the items was good (Cronbach’s alpha = 0.86). However, the correlations among the factors were moderate to relatively high, ranging from 0.30 to 0.64. Factor 1 included most of the items related to dwelling satisfaction; Factor 2 included the items related to economic hardship; Factor 3 included four items related to dwelling satisfaction, but two of these items had cross-loadings (i.e., they were also loading on Factor 1); Factor 4 included neighbourhood satisfaction and sense of safety items; and Factor 5 included satisfaction with feeling part of community and civic engagement items (with relatively low factor loadings: 0.36 and 0.43, respectively).
One item (CER_Q05: Civic Engagement) was excluded to improve the factor solution. When this item was removed, the EFA model suggested four factors with eigenvalues greater than 1 that explained slightly more of the variance (53%) than the model described above. Factors 1, 2 and 3 were similar to the model described above, and Factor 4 included neighbourhood satisfaction, satisfaction with feeling part of community and sense of safety items. The internal consistency of the items (Cronbach’s alpha = 0.87) and the correlations among the factors in this model were similar to the previous solution. Notably, Factor 1 and Factor 3 had a relatively high correlation (r = 0.64). For both conceptual and empirical reasons, a three-factor model was specified and tested in the CFA (i.e., the items under Factor 3 were forced to load under Factor 1 because all of these items were related to dwelling satisfaction). The three-factor CFA model showed a good fit to the data (SRMR = 0.047, RMSEA = 0.077[0.076-0.078], CFI = 0.926). The correlation between the average score of this large model and life satisfaction outcome variable was moderate (r = 0.54). The correlations with general and mental health and intention (not) to move were lower, at 0.30, 0.38 and 0.33, respectively.
A primary advantage of the large model is that it puts an emphasis on dwelling satisfaction and has a good internal consistency. However, the proportion of variance explained was moderate (53%) and some of the additional factors seemed to be redundant and added little explanatory power (<10%). In addition, the large model places the largest demands on the data, and obtaining a good fit of the model to the data in each geographic stratum may pose challenges.
Medium model
The EFA model included nine items and suggested two factors with eigenvalues greater than 1, which explained 66% of the variance. The internal consistency of the items was satisfactory (Cronbach’s alpha = 0.66). The correlation between the two factors was moderate (r = 0.44). Factor 1 included the items related to economic hardship, and Factor 2 included the remaining five items related to dwelling satisfaction, neighbourhood satisfaction, satisfaction with feeling part of community, sense of safety and civic engagement.
One item (CER_Q05: Civic Engagement) had very low loading (0.24 on Factor 2) and was therefore excluded to improve the factor solution. When this item was removed, the EFA model still suggested two factors with eigenvalues greater than 1 that explained slightly less of the variance (61%) than the medium model described above. Once again, Factor 1 included the items related to economic hardship, and Factor 2 included the remaining four items related to dwelling satisfaction, neighbourhood satisfaction, satisfaction with feeling part of community and sense of safety. The internal consistency of the items improved slightly in this model (Cronbach’s alpha = 0.69), and the correlation between the two factors was similar to the previous solution (r = 0.47). The two-factor CFA model showed a good fit to the dataNote (SRMR = 0.043, RMSEA = 0.086[0.084-0.088], CFI = 0.953). The correlation between the average score of this medium model and the life satisfaction outcome variable was moderate (r = 0.53) and similar to the one observed in the large model. The correlations with general and mental health and intention (not) to move were lower, and also similar to the ones observed in the large model, at 0.32, 0.38 and 0.22, respectively.
A primary advantage of the medium model is that it has the highest proportion of variance explained while representing a multidimensional model of social inclusion with two domains— namely, presence of satisfaction and absence of economic hardship. The internal consistency in this model is lower compared with the large model, but can be considered satisfactory, especially after omitting the civic engagement item. Finally, similar to the large model, the multidimensional nature of the medium model may also pose challenges when obtaining a good fit of the model to the data in each geographic stratum.
Small model
The EFA model included six items and suggested two factors with eigenvalues greater than 1, which explained 54% of the variance. The internal consistency of the items was low (Cronbach’s alpha = 0.56). The correlation between the two factors was relatively high (r = 0.77). Factor 1 included all items (except for civic engagement), and Factor 2 included the civic engagement item (with a relatively low factor loading, 0.38) and the satisfaction with feeling part of community item, which had a cross-loading on this factor. Overall, the preliminary results suggested that the factor solution may be improved by excluding the civic engagement item.
When the civic engagement item was removed, the EFA model suggested a single-factor solution with an eigenvalue greater than 1 that explained 44% of the variance. All factor loadings were greater than 0.40, except for the sense of safety items. The internal consistency of the items improved slightly in this model (Cronbach’s alpha = 0.61). The single-factor CFA model with five items showed a good fit to the dataNote (SRMR = 0.032, RMSEA = 0.088[0.083-0.092], CFI = 0.953). The correlation between the average score of this small model and the life satisfaction outcome variable was also moderate (r = 0.58) (and similar to the correlations observed in the large and medium models). The correlations with general and mental health and intention (not) to move were lower (and also similar to the correlations observed in the large and medium models), at 0.30, 0.38 and 0.27, respectively.
A primary advantage of the small model is that it provides the most parsimonious solution while considering various identified indicators of social inclusion, including the presence of satisfaction indicators and the absence of economic hardship. Thus, obtaining a good fit of the model to the data in each geographic stratum may be relatively easy. However, the internal consistency in this model is low compared with the other two models.
In summary, each potential social inclusion model had advantages and disadvantages. Based on these results, there were questions to answer. First, which potential social inclusion model should be pursued? A multiple-factor model or a single-factor model? Second, which set of items should be considered for the selected social inclusion model? Upon group discussion, CMHC selected a single-factor model with five items.
TABLE A.1
| Item name | Item text | Models | ||
|---|---|---|---|---|
| Large (19 items) |
Medium (9 items) |
Small (6 items) |
||
| DWS_Q05 | How satisfied are you with your dwelling? | √ | √ | √ |
| DWS_Q10A | Having enough space overall in your home | √ | †† | †† |
| DWS_Q10B | Having enough bedrooms | √ | †† | †† |
| DWS_Q10C | Being affordable | √ | †† | †† |
| DWS_Q10D | Its condition | √ | †† | †† |
| DWS_Q10E | Blocking regular noise from outside or from neighbours | √ | †† | †† |
| DWS_Q10F | Being accessible to someone using a wheelchair | √ | †† | †† |
| DWS_Q10G | Being safe and secure within the home | √ | †† | †† |
| DWS_Q10H | Being energy efficient | √ | †† | †† |
| DWS_Q10I | Being able to maintain a comfortable temperature in the winter | √ | †† | †† |
| DWS_Q10J | Being able to maintain a comfortable temperature in the summer | √ | †† | †† |
| NES_Q05 | How satisfied are you with your neighbourhood? | √ | √ | √ |
| COS_Q05 | Using a scale of 0 to 10, where 0 means “very dissatisfied” and 10 means “very satisfied,” how satisfied are you with feeling part of your community? | √ | √ | √ |
| NSC_Q15 | How safe do you feel from crime walking alone in your area after dark? | √ | √ | √ |
| CER_Q05 | In the past 12 months, were you a member of or participant in a community group within your neighbourhood? | √ | √ | √ |
| EHA_Q05A | In the past 12 months, did any member of your household ever do any of the following because they were short of money? Ask for financial help from friends or relatives for day-to-day expenses |
√ | √ | †† |
| EHA_Q05B | Take on debt or sell an asset for day-to-day expenses | √ | √ | †† |
| EHA_Q05C | Have to turn to a charity organization | √ | √ | †† |
| EHA_Q10 | In the past 12 months, how difficult or easy was it for your household to meet its financial needs in terms of transportation, housing, food, clothing and other necessary expenses? | √ | √ | √ |
|
†† indicates the item was omitted from the model Source: Statistics Canada, Canadian Housing Survey (CHS), 2018. |
||||
References
Asparouhov, T., and B. Muthen. 2018. SRMR in Mplus. Mplus Web Notes: May 2, 2018. Available at: http://www.statmodel.com/download/SRMR2.pdf.
Baumgartner, J. N., and J. K. Burns. 2014. “Measuring social inclusion—a key outcome in global mental health.” International Journal of Epidemiology 43(2): 354–364.
Brown, T. A. 2014. Confirmatory Factor Analysis for Applied Research. New York: Guilford Press.
Canada Mortgage and Housing Corporation (CMHC). 2018. The National Housing Strategy Glossary of Common Terms. Available at: https://cmhc-schl.gc.ca/en/nhs/guidepage-strategy/glossary.
Coombs, T., A. Nicholas, and J. Pirkis. 2013. A review of social inclusion measures. Australian & New Zealand Journal of Psychiatry 47 (10): 906–919.
Eberle, M., and L. Serge. 2007. Social inclusion and urban form: An exploratory research study. Ottawa, ON: Canada Mortgage and Housing Corporation. Commissioned report. Available at: http://publications.gc.ca/collections/collection_2011/schl-cmhc/nh18-1/NH18-1-234-2007-eng.pdf.
Filia, K. M., H. J. Jackson, S. M. Cotton, A. Gardner, and E. J. Killackey. 2018. What is social inclusion? A thematic analysis of professional opinion. Psychiatric Rehabilitation Journal 41 (3): 183–195.
Hu, L., and P. Bentler. 1999. Cutoff criteria for fit indexes in covariance structure analysis: Conventional criteria versus new alternatives. Structural Equation Modeling 6: 1–55.
Hubley, A. M., and B. D. Zumbo. 1996. A dialectic on validity: Where we have been and where we are going. The Journal of General Psychology 123: 207-215.
Levitas, R., C. Pantazis, E. Fahmy, D. Gordon, E. Lloyd, and D. Patsios. 2007. The multi-dimensional analysis of social exclusion. Bristol, UK: University of Bristol.
Little, R. J. A. 1988. A test of missing completely at random for multivariate data with missing values. Journal of the American Statistical Association 83 (404): 1198–1202.
O’Connor, B. P. 2000. SPSS and SAS programs for determining the number of components using parallel analysis and Velicer’s MAP test. Behavior Research Methods, Instrumentation, and Computers 32: 396–402.
O’Connor, B. P. 2018. Factor Analysis Functions for Assessing Dimensionality. Package ‘paramap.’ Available at: https://people.ok.ubc.ca/brioconn/nfactors/paramap.pdf.
O’Rourke, N., and L. Hatcher. 2013. A step-by-step approach to using SAS for factor analysis and structural equation modeling. SAS Institute.
Schumacker, R. E., and R. G. Lomax. 2004. A beginner’s guide to structural equation modeling. 2nd edition. Mahwah, NJ: Lawrence Erlbaum.
Tabachnick, B. G., and L. S. Fidell. 2012. Using multivariate statistics. 6th edition. Boston, MA: Pearson Education.
United Nations. 2018. “In-depth review of measuring social exclusion.”Conference of European Statisticians (Economic Commission for Europe), Geneva, June 18 to 10, 2018.Available at: https://www.unece.org/fileadmin/DAM/stats/documents/ece/ces/2018/CES_18_E_Agenda_item_12_Social_exclusion.pdf.
Zumbo, B. D. 2007. “Validity: Foundational issues and statistical methodology.” In Handbook of Statistics, Volume 26: Psychometrics, ed. C. R. Rao and S. Sinharay, p. 45–79. Amsterdam: Elsevier.
- Date modified: