Analytical Studies: Methods and References
Estimating the Effect of Changing Canada-US Border Costs on North American Trade Patterns and Expenditures: Detailed Methodology
by W. Mark Brown, Afshan Dar-Brodeur and Jay Dixon
Analytical Studies Branch No. 023
This paper
shows how to estimate the effect of the Canada-United States border on
non-energy goods trade at a sub-provincial/state level using Statistics
Canada’s Surface Transportation File (STF), augmented with United States
domestic trade data. It uses a gravity
model framework to compare cross-border to domestic trade flows among 201
Canadian and United States regions in year 2012. It shows that some 25 years
after the Canada-United States Free Trade Agreement (the North American Free
Trade Agreement’s predecessor) was ratified, the cost of trading goods across
the border still amounts to a 30% tariff on bilateral trade between Canadian
and United States regions. The paper also demonstrates how these estimates can
be used along with general equilibrium Poisson pseudo maximum likelihood
(GEPPML) methods to describe the effect of changing border costs on North
American trade patterns and regional welfare.
1 Introduction
World
trade has expanded since the Second World War, facilitated by the ratification of
multilateral and regional trade agreements. One of the earliest such agreements
was the 1988 Canada
United States Free Trade
Agreement, to which Mexico acceded in 1994 to create the North American Free Trade Agreement (NAFTA). It was renegotiated in 2018. These agreements originally focused on
disciplining tariffs and quotas applied to goods crossing the border. The most
recent negotiations, while addressing market access in certain industries, also
focused more on other burdens associated with administrative borders.Note
At the
same time, Canadian provinces have been negotiating to further reduce trade
barriers between them by updating the 1995 Agreement on Internal Trade (AIT) with the signing of the
Canadian Free Trade Agreement (CFTA) in 2017. There are no tariffs or quotas
levied at the borders separating provinces. The main impediments are thought
instead to be caused by differences in regulatory frameworks and government
procurement practices, and amount to about a 7% tariff equivalent (Bemrose, Brown and Tweedle 2017).
Frictions
caused by red-tape and delays at borders, regulatory differences, or
uncertainty over future policies, are commonly referred to as non-tariff barriers (NTBs). Unlike traditional trade policies like tariffs and quotas that
are easy to identify and measure directly, frictions that range from red tape
and border-related delivery delays, to divergent regulations and firms’
uncertainty about how policies will evolve, are not. The average bilateral
costs of both tariff and non-tariff barriers can, however, be estimated
indirectly by applying the gravity model framework to suitable data.
Trade
frictions generated by the Canada-United States border have already
been the subject of extensive research using the gravity model. The seminal
work by McCallum (1995) on Canada and United States trade pointed to an
extraordinarily large border effect. But the literature’s subsequent estimates
of border frictions have declined as researchers have taken advantage of
refinements to theory, measurement and estimation methods. These refinements
include Anderson and van Wincoop’s (2003) incorporation of “multilateral
resistance” terms to accommodate regional differences in access to and
competition from global markets. The “structural” gravity model imbues the estimation
with a general equilibrium structure that summarizes the ability of a region to
generate and absorb trade from all other potential trading partners.
More
recent work has suggested that further refinements are needed to accurately
estimate border costs. Much of the emphasis has been on how to deal with the
paucity of detail in available data. Trade flows are often measured at an
aggregated level, between nations or large sub-national units, like provinces
or states. But the level of geographic aggregation used in estimation matters,
with higher levels of aggregation often biasing border estimates upwards.
Hillberry and Hummels (2008) uses geographically detailed (i.e., zip code
level) United States data to show that when the size of regions is reduced to
the sub-state level the state borders’ effects on inter-state trade found with
more aggregate data vanish entirely. Similarly, Bemrose, Brown and Tweedle 2017 found that
smaller and more geographically uniform regions are associated with smaller
estimated provincial border effects in Canada, although they are not
eliminated.
This
methodological note describes how to estimate the costs that administrative
borders impose on Canada-United States trade using recently constructed data at
Statistics Canada. A structural gravity model is applied to data from the
Surface Transportation File (STF). The STF was built from shipping records
to measure domestic trade between detailed locations within Canada and between
the United States and Canada. It is augmented for this paper with the 2012
United States Commodity Flow Survey (CFS) to produce a data set that measures
trade among 201 comparable Canadian and United States regions in year 2012. The
combined data can measure the average costs of Canada-United States and
provincial borders simultaneously. We are unaware of any work estimating the
Canada-United States border effect at such a fine-grained geography.
The
average tariff equivalents are useful to illustrate the effect of trade
frictions on Canada-United States bilateral trade. But changing international
border costs also affect domestic trade patterns as firms shift between
domestic and international markets. Together these first- and second-order
impacts give a fuller picture of the economic significance of changing international
trade costs.Note Anderson, Larch and Yotov (2018) show how, using
counterfactual scenarios, the structural gravity model allows for the direct
and indirect impacts of a change in bilateral trade costs to be quantified. We
present the application of the structural gravity model in this paper and use
it to illustrate the aggregate outcomes of counterfactual changes to
Canada-United States border costs.
The
following section discusses the gravity model. Section 3 covers the
construction of the data and highlights the advantages and limitations of using
detailed shipment data from different sources. Section 4 discusses the model’s
empirical implementation, including the need to adjust the estimating equation
to allow for features of the data. Results for Canada-United States and
provincial border effects are presented in Section 5. A methodology for
elaborating on the general equilibrium effects with an example of results are
discussed in Section 6. For a more detailed description of these results, see
Brown, Dar-Brodeur and Dixon (2019).
2 The gravity model
In the
gravity model framework, bilateral trade is analysed by analogy with Newtonian
gravity: trade flows between two regions are assumed to be an increasing
function of their economic sizes and inversely related to the distance between
them. Trade flows not explained by these variables are attributed to other
trade “frictions”. When applied to measuring administrative borders, the model
estimates the degree to which interregional trade frictions must exceed domestic
ones.
Anderson
and van Wincoop’s (2003, 2004) showed that in addition to size and proximity,
gravity models should also incorporate regions’ relationships with third
parties. These models are often referred to as “structural” gravity, of which
there are many varieties in the literature.Note Each imposes different conditions on consumers
or producers, leading to different interpretations of the parameters, they
all result in common expressions for the equilibrium value of bilateral exports,
, from geographical location
to location
:
where
and
The
variables
and are the values of location
’s total output and location
’s total expenditure (on goods and services
to/from all locations, including themselves), respectively. The variable tij is the bilateral trade costs between i and j. The parameter
is the elasticity of trade with respect to
trade costs (or more commonly, the trade cost elasticity).Note
Depending on the underlying model, the trade
cost elasticity reflects one or more of the heterogeneity of consumer
preferences, scale economies, or the fixed costs of exporting. In the case of
supply-side models, it reflects the (Frechet or Pareto) dispersion of firms’
productive efficiency.
The key
feature distinguishing the structural gravity model from its earlier forms is
the introduction of “multilateral resistance” (MR) terms, variables and
, which
are the solutions to the non-linear system of 2N Equations (2) and (3), subject
to a normalization.Note
The
first term is referred to as region
’s outward multilateral resistance (OMR) and
the second term as region
’s inward multilateral resistance (IMR). These
terms account for the fact that bilateral trade flows are not only affected by
trade frictions between the two regions, but also by their relative positions
with respect to all other potential trading partners. As described by Anderson
and Yotov (2010), the OMRs can be interpreted as measure of the trade cost
incidence on sellers as they bring goods to a hypothetical world market.
Similarly, the IMRs summarize the incidence of trade costs on consumers
receiving goods from the world market. In models derived from the constant elasticity of substitution (CES) utility function, the IMRs are also the regional consumer price indexes.
Economic geographers often refer to OMRs as an index of exporting regions’
market access and the IMRs as indexes of competition in the destination region.
Together, the multilateral resistance terms account for the indirect effect
that multilateral trading relationships have on bilateral trade flows.
3 Data
The
literature has identified two data-related issues that may influence border
effect estimates. Due to data limitations, many papers are confined to
analysing trade between highly aggregated/heterogeneous regions like countries
or provinces/states. The distance goods travel are approximated by the great
circle distance between administrative or commercial capitals, or the regions’
economic or demographic centroids. Gravity researchers have observed that
estimated border frictions can be influenced by heterogeneity in internal
regional trade costs associated with trading regions of differing sizes
(Coughlin and Novy, 2016). In addition, standard distance measures may bias the
estimation of border frictions, because trade flows tend to be short distance
and so are likely overestimated (Head and Mayer 2009).
The two
different data sources used in this paper address these concerns by using a
relatively homogeneous set of sub-provincial/state regions and a more accurate measure
of the distance that goods travel between them. The following subsections
discuss the construction of the data, their advantages and potential limitations.
3.1 Trade
data
The data
are derived from two different sources. Canadian domestic and cross-border
trade flows are derived from Statistics Canada’s Surface Transportation File
(STF). United States internal trade comes from the United States 2012
Commodity Flow Survey (CFS). They include shipments measured in terms of commodity,
tonnage, value, network distance shipped, and by detailed origin and
destination. The precision of the origins and destinations allows for the
measurement of trade flows between 201 sub-provincial/state areas.
While
the STF covers the major modes of transportation used by most commodities, it
does not cover air, marine and goods moved by pipeline, or own-account
trucking. To account for these limitations, shipment values are weighted to
ensure they add to inter-/intra-provincial trade totals by commodity for
domestic trade reported by the provincial supply-use (input-output) tables.
Similarly, cross-border shipments are weighted to add to provincial-United
States exports/imports by commodity, again using the provincial supply-use
tables.Note Hence, domestic and cross-border flows add to known totals. This approach
assumes that the patterns of trade followed by modes not covered follow those
generated by the for-hire trucking and rail.Note
The
exception is commodities produced by the energy industry. Although energy
products are also shipped by rail and truck, they are primarily moved by
pipeline. Since pipelines are not included in the STF, there is not enough
information in the file to accurately attribute energy flows down to the
sub-provincial level. The energy sector is therefore excluded from this
analysis.
The STF by itself is insufficient to
measure the Canada-United States border effect. The appropriate comparison
group to cross-border trade is domestic trade in both countries. The United
States domestic trade flows are not included in the STF, and so comparable
shipment-level data from the 2012 CFS are used to fill the gap.Note CFS
trade flows are scaled to United States gross output as in Anderson and van
Wincoop (2003), and the oil and gas industry is excluded.Note
The CFS
is a quinquennial survey, and only has publicly available microdata for 2012,
while the STF is based on annual data from 2004-2012. The combined data is restricted
to the year 2012 to generate a shipment-level file for North America. The
shipments are aggregated to generate intra- and inter-regional trade on a North
America-wide basis, taking advantage of the (relatively) detailed origins and
destinations reported on each file.
While
the STF and CFS are broadly comparable, there are some important differences to
be kept in mind when using the combined information for analytical purposes.
First, domestic STF flows are benchmarked to the provincial supply-use tables estimating
origin and final use of commodities across provinces. As a result, the domestic
portion of the STF is converted from a ‘logistics file’ that measures where goods are picked
up and dropped off to a quasi-‘trade file’, tracking where they are made and
used. The CFS and cross-border trade from the STF remain logistics-based. Bemrose, Brown and Tweedle (2017) show that benchmarking stretches trade flows across space,
relative to un-benchmarked logistics flows.
Second,
both the STF and CFS derive trade flows from shipping records, but the STF
obtains them from
trucking firms (‘carrier-based’ survey), while the CFS obtains them from establishments
that generate the shipments (‘shipper-based’ survey), leading to potential
differences in coverage. The truck-based shipments in STF are derived from the Trucking Commodity Origin Destination (TCOD) Survey, which does not include private
trucking. The CFS, on the other hand, does. If private trucking is a significant proportion
of short distance flows, these flows will be better represented in the CFS
than the STF. Finally, the CFS
measures distances
between zip codes, while the STF uses much more spatially detailed postal
codes.
One additional
factor complicates the calculation of a full set of regional flows and their respective
distances below the provincial/state level. While truck shipments to and from
the United States are reported by zip code on the STF file, only the state of destination/origin
are reported for rail shipments. Interregional rail shipments between Canada
and the United States were allocated to sub-state areas using the
value-weighted share of corresponding truck exports/imports. While the pattern
of rail and truck shipments at the sub-state level are likely not perfectly
correlated, there should be a strong correspondence.Note Hence,
any error introduced is expected to have a relatively small effect on the
aggregate flows.
3.2 Geography
The
gravity model, by construction, measures inter-regional relative to average
intra-regional trade costs. This construction presents no issues when regions
are homogeneous (i.e., they have roughly the same size and geography). However,
in most data, the units of analysis have different sizes and thus different,
usually unobservable, internal trade costs. Larger regions naturally have
higher internal costs than smaller ones, and yet estimation often treats them
both as dimensionless points in space. Coughlin and Novy (2016) show that the
size-related heterogeneity can bias border effect estimates.Note
The data
allow for two sub-national geographies to define trading units. The first is
the province/state geography that the literature has relied upon. However, in
the light of Coughlin and Novy (2016)’s findings, a second more fine-grained geography
is also used. It is based on the CFS’s division of states into metropolitan and
non-metropolitan (MA/non-MA) areas. While there is no perfect analogue in
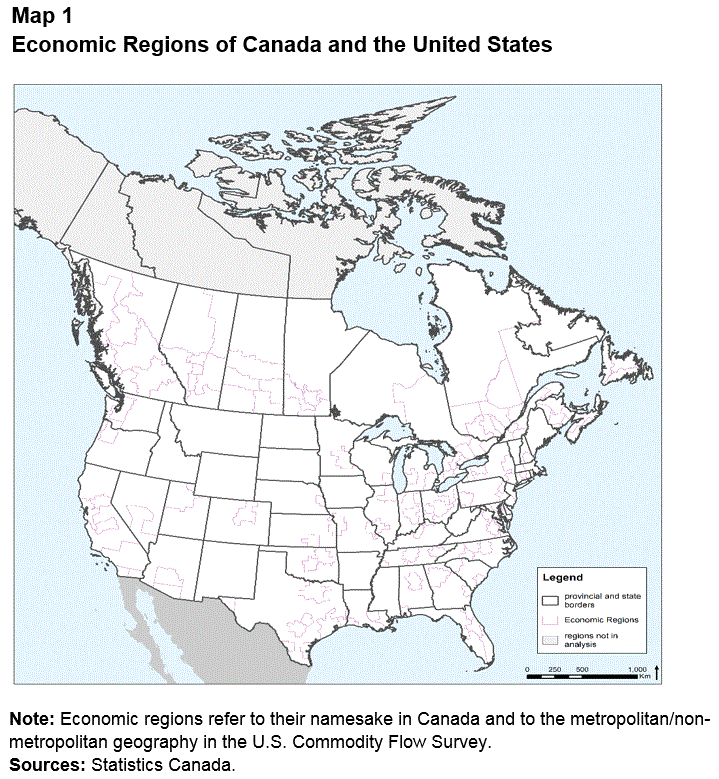
Canada, STF-based flows can be aggregated by Economic Regions (ERs) that are
comparable in size to the United States MA/non-MA geography (see Map 1).Note Furthermore, ERs and MA/non-MA boundaries respect provincial and state borders in the same way.
There
are some differences between ERs and MA/non-MAs. ERs are not purely
metropolitan-based. Hence, while there is a tendency for them to roughly follow
metropolitan boundaries (e.g., Edmonton and Calgary), other metropolitan areas
(e.g., the Toronto metropolitan region) are composed of several ERs. Furthermore, the United States
geography treats the rest of each state as a non-metropolitan residual, while
the “non-metropolitan” portions of provinces may be split into multiple ERs (see Map 1). Still, there is
enough commonality to treat them as compatible. To simplify the discussion both
geographies will hereafter be referred to as ERs.
Long description for Map 1
The title of Map 1 is “Economic regions of Canada and the United States.”
Map 1 shows the North American continent, except for the western part of Alaska, Greenland, and the southern part of Mexico. There are no labels indicating countries, regions or other geographical features on the map. The northern part of Mexico is shaded in grey. The water features are shaded in blue. The northern part of Canada (Nunavut, Northwest Territories and the Yukon) are shaded in light grey. The continental United States and the 10 Canadian provinces are white.
The map legend is located on the lower right corner of the map. It is a white square with a border in black colour. In this white square, there is a smaller square delineated with a thin black line, with “Provincial and state borders” written beside it in black. Below it is a square of same dimensions delineated with a thin light purple line, with “Economic Regions” written beside it in black. Below this second square is a square of the same dimensions, shaded in light grey colour, with “Regions not in the analysis” written beside it in black. This last square has no borders.
Below the legend is the scale for the map. The scale is a horizontal thick bar with alternating black and light blue colour. The scale extends from 0 to 1,000 kilometres, with graduations shown at 0, 250, 500 and 1,000 kilometres. It is about the same width as the map legend.
The provincial and state borders are shown on the map for all of Canada and the United States. The economic region borders are shown on the map for the continental United States and for the ten Canadian provinces, which are in white, because only these regions are part of the study.
The note and source for the map are as follows:
Note: Economic regions refer to their namesake in Canada and to the metropolitan/non-metropolitan geography used in the U.S. Commodity Flow Survey.
Another
factor potentially biasing border effect estimates is the mis-measurement of
shipping distances (Head and Mayer, 2009). Most research is limited to using great
circle distances between arbitrary points within trading areas. These measures
often mischaracterize the distance goods traded between regions actually
travel. The STF and CFS allow the derivation of the network distances that more accurately reflect the origins,
destinations and journeys goods can be expected to take.Note However,
the network distances used here are constructed using two sources that differ
in their methodologies, and the differences between them may bias border effect
estimates. It is thus important to understand how much they differ when
comparing cross-border to domestic trade.
Table 1
shows the distribution of distances between ERs for domestic Canadian and
cross-border trade derived from the STF and domestic United States trade derived
from the CFS. For domestic trade, the percentile distribution of distances are
reported for intra-ER, distances between ERs within the same province/state,
and between different provinces/states. Regardless of whether distances are
intra- or inter-ER, the two files generate the same distribution of shorter
distance flows. It is only at the 90th and especially the 99th percentile
of ER pairs that
we observe much longer distances shipped in Canada, reflecting its larger size
and more dispersed population. Otherwise, the STF and CFS generate broadly comparable
distributions of within and between ER distances.
Cross-border
distances tend to be longer than domestic flows. There are no cross-border pair
distances below 150 kilometres. Since cross-border flows are much more heavily
weighted towards longer distance shipments (greater than 400 km), any
difference in the effect of distance on trade flows stemming from the
construction of the data may bias the estimated border effect derived from the
model. This potential bias can be compensated for in the specification of the
econometric model. One possible remedy is discussed in Section 4.
Table 1
Network distances between Economic Regions by trade type and geography Table summary
This table displays the results of Network distances between Economic Regions by trade type and geography. The information is grouped by Trade Type (appearing as row headers), Percentile, Median, p1, p10, p25, p75, p90 and p99, calculated using kilometers units of measure (appearing as column headers).
Trade Type
Percentile
Median
p1
p10
p25
p75
p90
p99
kilometers
Canadian
Intra-ER
60
10
20
40
90
150
710
Intra-provincial
390
50
130
220
670
940
1,610
Inter-provincial
2,550
310
760
1,280
3,960
4,980
6,240
United States
Intra-ER
30
20
20
20
60
70
120
Intra-state
230
60
130
160
350
500
880
Inter-state
1,780
200
640
1,100
2,780
3,840
4,860
Canada-United States
2,690
430
1,060
1,750
3,720
4,660
5,860
Notes: Reported are the percentiles of the mean shipment-based network distance within and between Economic Regions (ERs) by trade type (i.e., Canada-U.S, Canadian domestic, and United States domestic) and, for domestic distances, geography. The latter includes intra-ER and ER to ER distances within provinces/states and between provinces and states. Distances are rounded to the nearest 10 kilometers. Source: Statistics Canada, authors' calculations.
4 Estimating the structural gravity model
The
estimation equation corresponding to the model for bilateral trade described in
Section 2 is often expressed as:
The link
between the estimating equation to Equation (1) can be seen by defining the
natural log of bilateral trade costs,
, as the
multiplication of the logarithmically transformed determinants of trade costs by their trade
elasticities,
(boldface denotes vectors),
and
. In
cross-sectional data, the last two terms can be incorporated in the estimation
as directional exporter and importer fixed effects accounting for the
multilateral resistance terms and the relative economic size of regions and
.Note The is a random error term that
captures un-modelled trade costs and allows for errors in data construction.
When implemented, the estimation must exclude both the intercept and a fixed
effect (importer or exporter) or two fixed effects (an importer and an
exporter) to avoid perfect collinearity. To make interpretation of the fixed
effects in the Section 5simpler, we
forgo an intercept and exclude the importer dummy for Ontario in the
province/state regressions, and for the Greater Toronto area when the ER
geography is used.
We define bilateral trade costs as:
The first term on the right-hand side
captures the non-linear effect of distance, discussed in more detail at the end
of this sub-section. The main focus of this paper is the trade frictions
induced by the intercession of administrative borders. In Equation (5) the
binary variables take a value of one if regions lie on either side of the
Canada-United States (
), a provincial (
) or a state border (
), respectively, and zero otherwise. The
exponentiated coefficient for the Canada-United States border dummy
and the trade elasticity can be used to
calculate a tariff equivalent for the
border’s impact on bilateral trade. The tariff equivalent summarizes the impact
of tariffs and “tariffies” any border-related non-tariff barriers.Note
In much
of the literature, trade costs of exporting from region to region are assumed to be a log-linear function of distance
between them. While this assumption is likely innocuous when modelling trade
over long distances, it may be problematic when using a fine geographic
breakdown, as trade involves fixed logistical and search costs that must be
covered to move goods any significant distance. These outlays inflate per km
costs at short distances, but their impact declines rapidly as they are spread
over longer distances (see Behrens and Brown (2018)). This non-linearity in
trade costs may be more pronounced in estimations that include a large number
of short distance flows within regions and between near neighbours (i.e., between
ERs within
provinces/states).Note
In order
to accommodate potential non-linearities, as well as compensating for
differences in the underlying data sources that make up our sample, the
estimating Equation (4) includes a spline over distance, (
):
where for
parameter estimates are
allowed to vary across trade types such that:
For
regressions at the provinces and state levels,
equals150 kilometres, while for regressions on
ER flows,
equals 50 kilometres
below these distances, trade
flows are exclusively intra-regional. Constraining the effect of the shortest
distances to be the same across regions essentially imposes the same
distance-related intra-regional trade costs across the two countries. The other
spline segments are represented by distance class set
:
where
There
are no international network distances of less than 150 kilometres in the data,
so the effects of the shorter unconstrained distances only vary between within-country
Canada and US flows.Note
4.1 Estimation
method
Equation
(4) has traditionally been estimated by taking the natural log and using
ordinary least squares (OLS). However, Silva and Tenreyro (2006) show that this
approach leads to biased estimates in the presence of heteroskedasticity,
because the conditional mean of the log error term will generally not be
independent of the covariates (a requirement of OLS estimation) unless strong
assumptions are made about the distribution of
.
Intuitively,
as the value of trade flows approach zero, they can only vary in one direction
(trade flows cannot be negative), whereas larger trade flows can vary upwards
or downwards. Smaller regions that are farther apart being more likely to
record flows that are near or at zero, where the log specification is
undefined. The bias is thus a greater problem when considering smaller, more
distant geographic aggregations. Silva and Tenreyro (2006) suggest dealing with
heteroskedasticity by estimating (4) in its non-linear form using
pseudo-maximum likelihood estimation. This approach has the added benefit of
incorporating zero-valued flows as a matter of course. Among this class of
estimators, they find that Poisson pseudo maximum likelihood (PPML) often
yields the best results.Note Furthermore,
PPML estimation
has desirable properties that permit us to recover the multilateral resistance
terms directly from the fixed effects (Fally 2015). These properties are
important to accessing the model’s general equilibrium information, as
discussed in Appendix A.
5 Gravity model estimates
The
results presented in Table 2 replicate specifications used in the existing
literature, with trade aggregated to the province/state level and the effect of
distance on trade constrained to be the same across trade types (
) and distance classes (
). Estimating the model using all trade
[column (1)], including intraregional flows, produces a distance parameter of
-1.182, which is somewhat stronger
than the standard of -1 found in the literature (see Head and Mayer (2014)) and
a Canada-United States border parameter estimate of -0.626, which is much weaker than generally found: Anderson and van
Wincoop (2003) estimated a border coefficient border using 1993 data to be
-1.65. Column (2) repeats the same model but with intra-province/state flows
excluded. There are no qualitative differences in parameters (see Table 2) when
intraregional flows are excluded. Due to differences with the literature in the
underlying data, it is unclear what inferences should be drawn regarding the
initial border effect estimate.
The
distance estimates presented in columns (1) and (2) are constrained across
trade types. Because the STF benchmarks Canada’s domestic flows to intra-
and inter-provincial trade totals, it is expected that the effect of distance
on Canadian domestic trade to be weaker than cross-border or United States
domestic trade. Benchmarking has the effect of stretching flows by tracing the
trade in goods from where they are made all the way to where they are used,
rather than to a point along the logistics chain prior to a good’s final
destination, as is the case with the United States data. This stretching gives
the appearance that distance-related trade costs are lower in Canada. Columns
(3), (4) and (5) of Table 2 show gravity regressions for Canada, United States
and cross-border trade separately. The trade elasticity of distance for United
States domestic trade is -1.140, while for Canadian domestic trade it is
-0.773. Cross-border trade’s distance elasticity, at -0.96, is close to unity, as is often found in the international
trade literature.
Since
distance has a stronger estimated negative effect on United States trade than
in the full model [see Column (2)], there will be a tendency for internal
United States flows to be underestimated, biasing the border effect upwards
(i.e., towards zero). Of course, the opposite holds true for Canadian trade,
but because United States flows account for the vast majority of North
America’s domestic trade, their effect will dominate border estimates. These
differing distance parameter estimates suggest that the effect of distance
needs to be allowed to vary across trade flow types.
Table 2
Province-state regressions Table summary
This table displays the results of Province-state regressions All trade types, Cross-border (Canada-United States), Domestic United States and Domestic Canada (appearing as column headers).
Notes: All models utilize a Poisson-PML estimator and include fixed effects for origins and destinations. Columns (1) and (2) report parameter estimates with all trade types (cross-border and domestic) included in the estimation. Intra-regional (province or state) flows are included in the estimation for column (1) but excluded for column (2). Columns (3)–(5) report the model estimates for cross-border and United States and Canadian domestic trade, with intra-regional flows excluded. Source: Statistics Canada, authors' calculations.
The
fully specified version of Equation (4) is presented in Table 3. Given the
larger number of variables in the model, for ease of exposition we present the
border and distance estimates separately. The first table presents the border coefficients
from all regression models; the second presents the distance coefficients for
our preferred model. The full model allows the effect of distance to vary by
trade type (
) and distance (
) at the province/state level [columns (1) and
(2)] and the ER level of spatial aggregation [columns (3) and (4)]. Relaxing the
constraints addresses the error that results from differences in the
construction of the STF and CFS portions of the data, as well as
allowing for non-linearities in trade costs, which are expected to be
particularly pronounced at lower levels of geographic aggregation.
In
contrast to the results in Table 2, the province-state regressions with the
unconstrained distances yield a stronger Canada-United States border effect. The
border effect estimates with and without accounting for internal flows changes to
-1.435 and -1.555, respectively. Comparing Tables 2 and 3 show that constraining
the effect of distance across categories and trade types has a significant
influence on the border effect.
Table 3
Provincial and Economic Region border effect estimates across trade types, accounting for the non-linear effect of distance Table summary
This table displays the results of Provincial and Economic Region border effect estimates across trade types Province-State and Economic Region (appearing as column headers).
Notes: All models utilize a Poisson-PML estimator and include fixed effects for origins and destinations. The model also allows for the non-linear effect of distance on trade flows and for this effect above a minimum distance level d to vary by trade type: within Canada, Canada-United States, and within the United States. See Appendix Table 1 in the Appendix. Source: Statistics Canada, authors' calculations.
The
border effects estimated using data at the ER level are, on the other hand,
roughly the same in magnitude as the province/state level, but are estimated
with greater precision.Note The Canada-United States border effect is -1.568 with and -1.434 and
without intraregional flows. Assuming trade elasticity
of
, the
tariff equivalent for the former estimate is 30% and for the latter 27%. These
estimates are, broadly speaking, in line with the various estimates in the
literature.Note
The
economic region regressions are also able to simultaneously measure provincial
border effects of -0.576 and state
borders -0.387 when internal flows
are included. The provincial results are close to those found in Bemrose, Brown and Tweedle
(2017) using the Canadian data from the STF alone and the same level of
geographic aggregation.Note The
exclusion of intra-regional trade flows [see Table 3, Column (4)], raises the
provincial border effect in absolute terms. The state border estimates are
negative and significant as well, but these are likely an artefact of CFS
data and the level
of geographic aggregation (Hillberry and Hummels, 2008). Bemrose, Brown and Tweedle (2017),
using the Canadian equivalent of zip codes, find provincial border effects that
are not qualitatively different than those estimated in this paper.
Our
preferred estimates use ERs as the trading units and include intra-regional trade [Table 3, Column
(3)]. The provincial border effect is the closest among the specifications to
that estimated by Bemrose, Brown and Tweedle (2017) and the Canada-United States border
effect is estimated with the most precision.
The
distance coefficients for the preferred specification can be found in Table 4;
the results for the other specifications can be found in Appendix B. Over the
500-3000 KM range, all flows (both domestic and international) are around one
in absolute value, although the coefficients on United States domestic flows
(from the CFS data) are generally higher than the Canada and Canada-United States
flows (from the STF), likely reflecting differences in the source data. Second, there is
clear evidence of a non-linearity of the effect of distance on the value of
trade for Canadian domestic flows: the trade elasticities are high for very
short distance flows (0-50 KM), reflecting fixed costs, and drop off over the
50-500 km range, before rising again beyond 500 KM and gently declining over
longer distances. A similar, although more muted, pattern is evident for the
United States domestic flows. There is large drop in the effect of distance on
the value of trade for very long distance domestic flows (3000 km +), but not for
international flows. It is unclear the degree to which these differences
indicate data issues versus features of the economy.Note
Table 4
Distance parameter estimates for Economic Regions, including intra-regional flows Table summary
This table displays the results of Distance parameter estimates for Economic Regions. The information is grouped by Trade type (appearing as row headers), Kilometers, 0 to
50, 50 to 150, 150 to 500, 500 to 1000, 1000 to 3000 and 3000 and more, calculated using coefficient units of measure (appearing as column headers).
Notes: Reported are the distance parameters and significance levels for the model reported in column (3) in Table 3. The distance parameter estimates with standard errors for all four models presented in Table 4 are presented in Appendix Table 1 in the Appendix. Source: Statistics Canada, authors' calculations.
6 General equilibrium PPML
The
previous sectionexamined the
average bilateral, first-order, estimates of Canada-United States border costs.
But trade costs between two regions will change the opportunities for producers
and consumers in their other potential trading partners, who will adjust
accordingly. These general equilibrium, second order, adjustments will impact
the relationships between all other trading regions. In other words, changes in,
for example, costs at the Canada-United States border will also change the
patterns of intra and inter-provincial/state trade. Welfare implications of any
thinning or thickening of the border will depend not only on the bilateral
impact on the two trading regions, but also on how patterns of trade respond
across the continent.
The
impact of a change in border costs can be illustrated by examining
counterfactual scenarios. The most common counterfactuals explored in the
literature are either frictionless borders or autarchy. These extreme scenarios
can establish the total cost of the border or the benefits of liberalized trade.
But the methodology can also be used to explore more plausible changes in trade
costs. Two such plausible scenarios are discussed in Section 6.3 and the
results are discussed in detail in Brown, Dar-Brodeur and Dixon (2019).
6.1 Fixed
effects and multilateral resistances
Dekle, Eaton and Kortum (2008) show that, given data on output, expenditures and actual trade
flows, the economic impact of counterfactual changes can be computed by
recasting Equations (1) to (3) from levels to deviations from initial values
and solving the transformed system for the anticipated adjustments in border
costs. This method of calculating general equilibrium impacts is commonly
referred to in the literature as exact
hat algebra. Anderson, Larch and Yotov (2018) argue that another, equivalent,
approach is to exploit the fixed effects
and
, estimated in Section 4.5. In
principle they should correspond to the MRs, but in practice they could include
a variety of other importer/exporter-specific influences on bilateral trade. However,
Fally (2015) observes that when Equation (4) is estimated by Poisson pseudo-maximum likelihood (PPML), estimates of the MR
terms can be derived directly from the estimated fixed effects as follows:
and
For their derivation, Equations (8) and (9) rely on the
exclusion of an importer fixed effect (
), the normalization of the corresponding
IMR (
), and the fact that the sum of the outward equals
the sum of the inward fixed effects. Anderson, Larch and Yotov (2018) show that using MRs recovered from the fixed effects estimated by
PPML under actual and counterfactual values for trade
costs produce estimates for changes in trade and welfare that are equivalent to
the ‘exact hat’ results.
6.2 Trade
costs, output and expenditure
The
general equilibrium impact of trade costs on trade and welfare will depend on
the underlying model used to derive Equation (1). To establish a lower bound
for welfare estimates, this paper uses a version of the canonical Armington
endowment model used in Anderson and van Wincoop (2003). In this model, each
region has an endowment of its own distinct good that generates utility in a
CES function
that is identical across regions. Welfare changes from trade stem from
producers fetching a lower or higher price for their endowment of goods, and
consumers having more or less favourable access to a greater variety of goods.Note The first effect is captured by changes in producer prices, while the
second is measured by the changes in the consumer price index.
With CES
demand, the consumer price index is simply the inward multilateral resistance
term (
). Producer prices in the
Armington framework can be recovered from the aggregate CES demand for region
’s unique good. The demand for this good in region
is given by
where the parameter
reflects the geographic distribution of
comparative advantage and
is region
producers’ prices. The trade elasticity in
this model is
, or the consumers’
elasticity of substitution between regional varieties. Summing over all its
consumers (including in the region itself), the market clearing condition for
region
’s output is
.
Using Equation
(10) and solving for producer prices yields:
Arriving
at general equilibrium estimates for counterfactual trade costs involves
calculating how producers’ prices (
), output (
), and expenditures (
) change in response to shifting market
opportunities (as summarized by changes in
). Note that in the endowment model, region
’s volume of goods remain unchanged, i.e.,
, where the superscript
denotes counterfactual values. Following the
literature, the model’s counterfactuals are derived assuming constant bilateral
trade balances, or
. Finally, welfare (
) implications of trade policy changes in this
model can be summarized by changes in the value of region
’s expenditures, deflated by the region’s
consumer price index:
Anderson, Larch and Yotov (2018) propose an algorithm for calculating counterfactual trade,
prices, output and expenditures after a policy change that exploits the MRs
estimated by the fixed effects. They characterize their method as
‘estibration’, combining the advantages of PPML estimation and calibration. The
algorithm consists of four steps:
Estimate fixed effects with PPML
and use them to construct baseline indexes,
,
and
according to Equations (8), (9) and (11),
where the iteration counter
.
Impose counterfactual trade
costs,
, re-estimate Equation (5) and
use the fixed effects to calculate “conditional” general equilibrium (GE)
indexes,
,
and
in the first iteration.
Use the change in producer prices
(
) and MRs to update the values of bilateral
trade flows according to:
Note that all the ratios to the
right of the trade cost terms can be expressed in terms of changes in fixed
effects.
Using
, re-estimate the fixed effects.
Iterate this estimation for
substituting the appropriate k-indexed terms
into Equation (13) for each iteration until all regions’ producer prices change
by less than some predetermined tolerance level, or
for all
.
The
first step, computing estimates of the multilateral resistances, is achieved in
this paper by using the fixed effect estimates from Section 3 along with the
predicted expenditures/output, in Equations (8) and (9). The second step
involves generating counterfactual trade costs. The assumptions involved in
generating our counterfactual scenarios (one in which the border is removed,
and another where a revised Canada-United States trade agreement is sun-setted
without replacement) are discussed in section 6.3.
6.3 Counterfactual
scenarios: an illustration
To
illustrate the ‘estibration’ methodology described above, we consider two
scenarios for changing border costs. The first considers a world in which the
cost of trading between Canada and the United States is assumed to be
equivalent to trading across provincial borders. This amounts to reducing the estimated Canada-United States border effect
from a 30% to a 10% tariff equivalent. The second scenario is one in which
Canada and the United States withdraw altogether from a preferential trading
agreement. In this case, tariffs would return to their Most-Favoured Nation
(MFN) levels as the bilateral trading relationship would be governed by World Trade Organization
rules, plus any additional non-tariff trade costs, such as heightened trade
policy uncertainty for exporters, who face a less predictable trading
environment. We use an approximation of the effect NAFTA had on reducing trade costs
between the two countries beyond the explicit reduction in tariffs. This
amounts to increasing trade costs by six percentage points to 36%.Note
Aggregate
general equilibrium impacts are presented in Table 5. The effect of changing
border costs is significant; a reduction increases trade from Canada to the United
States by 82%, and from the United States to Canada by almost 72%. This comes
at the expense of internal trade in Canada, both inter- or intra-provincial,
falling by about half. The much larger United States economy, however, gets a
boost in domestic trade. Welfare (total expenditures on domestic and imported
goods) increases in both Canada (11.4%) and the United States (0.8%).
On the
other hand, an increase in border costs reduces trade from Canada to the United
States by almost a quarter, and from United States to Canada by 18%. There is a
substitution towards internal trade in Canada, which rises by around 10%.
Domestic trade in the United States rises slightly as well, by around 1%.
Overall welfare declines by almost 2% in Canada and -0.2% in the United States.
Table 5
General equilibrium impacts of changing Canada-United States trade costs on exports and expenditures, 2012 Table summary
This table displays the results of General equilibrium impacts of changing Canada-United States trade costs on exports and expenditures Cross-border
exports, Domestic
Canadian exports, Domestic
United States exports, Total
expenditures, Canada to United States, United States to Canada, Inter-provincial, Intra-provincial, Inter-state, Intra-state, Canada and United States, calculated using percent change units of measure (appearing as column headers).
Note: Trade costs are reduced from 30% to 10% in the first scenario. In the second scenario, MFN tariffs and non-tariff barriers increase trade costs from 30% to 36%. Source: Statistics Canada, Surface Transportation File (STF) and the Bureau of Transportation Statistics, Commodity Flow Survey (CFS).
7 Conclusion
The world economy has become increasingly integrated since the Second
World War. It has been knit together by flows of goods and services
facilitated, in part, by falling trade costs associated with administrative
borders. Some of these costs take the form of explicit tariffs and quotas
levied on imports. Others consist of difficult-to-enumerate and quantify
non-tariff barriers, which are a diverse set of frictions ranging from red tape
and delay at the border to regulatory differences across jurisdictions.
Canada and the United States share one of the most important trading
relationships in the world. Over the past thirty years, this relationship has
developed under the auspices of an agreement that ultimately became NAFTA. The uncertainty generated by the 2018 renegotiation of that agreement
has highlighted the need to understand the impact of a changing Canada-United
States border on firms and consumers within the two countries. This paper uses
the gravity model framework on data from a combination of Canada’s Surface
Transportation File and the United States’ 2012 Commodity Flow Survey to
quantify indirectly the cost of the border on bilateral trade. It also shows how to use these results
in combination with the GEPPML methodology to generate general equilibrium
estimates of cross-border and domestic trade and welfare resulting from
changing border costs.
8 Appendix
Appendix
Table 1 presents the full set of estimates of Equation (4) for trade measured
at province/state and ER levels of aggregation. The province-state level regressions constrain
the effect of distance to be the same below 150 kilometres. As Table 1 in
section 3.3 shows, most of these flows are still intra-province/state and so
costs imposed by distances 0 to 150 kilometres is the minimum distance at the
province/state regressions level of aggregation. On the other hand, the ER level regressions allow for a
more detailed specification at shorter distances. The lowest distances, ranging
from 0 to 50 kilometres correspond to the network length travelled exclusively
by goods within ERs; the 50 to 150 kilometre range captures the distance covered by flows
outside the regions, but still within the United States or Canada. For network
distances above 150 kilometres, the effect of distance is allows to vary
by distance class and trade type.
The
spline captures the non-linearity of trade costs, at least for Canada and
Canada-United States flows. These flows are captured in more detail by the STF
portion of the data
than is available for United States flows through the CFS. For the within Canada flows,
the effect of distance is initially high, dropping over the 50 to 500
kilometres range, before rising above one in absolute value for distances up to
1,000 kilometres. The effect of
distance for all flows is roughly comparable for all three types of flows over
the middle distances. But for flows longer than 2,000 kilometres, the cost of distance drops for Canada and United
States flows and is actually positive for United States flows. By contrast, the
impact of distance for Canada-United States flows stays consistently high for
all levels of the spline.
The drop
in trade costs at longer distances is most likely due to how the Alchian-Allen
effect manifests in models using iceberg transportation costs. Goods that are
worth shipping very long distances are typically of much higher value than
shorter distance flows, creating the impression that less “ice is melting” over
these distances. It does not seem to be the case for Canada-United States
flows, however. The source of the discrepancy is between long distance trade
costs for intra- versus international flows. This pattern is consistent with
higher transport rates over these longer distances resulting from a lack of
cabotage rights for Canadian trucking firms. It is, however, beyond the scope
of this paper to identify this effect.
Appendix Table 1
Province-State and Economic Region Regressions with Spline Distances Table summary
This table displays the results of Province-State and Economic Region Regressions with Spline Distances Province-State and Economic Region (appearing as column headers).
Notes: All models utilize a Poisson-PML estimator and include fixed effects for origins and destinations. The model also allows for the non-linear effect of distance on trade flows and for this effect above a minimum distance level d to vary by trade type, within Canada, Canada-United States and within the United States. Source: Statistics Canada, authors' calculations.
References
Alchian, A. and W. Allen (1977). Exchange and production: competition,
coordination, and control. SWC-Economics Series. Belmont, California: Wadsworth Pub. Co.
Anderson, J. E., M. Larch, and Y. V. Yotov
(2018). GEPPML: General equilibrium analysis with PPML. The World Economy 41(10), 2750
2782.
Anderson, J. E. and E. van Wincoop (2003).
Gravity with Gravitas: A Solution to the Border Puzzle. American Economic Review 93(1), 170
192.
Anderson, J. E. and E. van Wincoop (2004).
Trade Costs. Journal of economic
Literature 42(3), 691
751.
Anderson, J. E. and Y. V. Yotov (2010). The Changing Incidence of Geography. American Economic Review 100(5), 2157
2186.
Behrens, K. and W. M. Brown (2018).
Transport costs, trade, and geographic concentration: Evidence from Canada. In
B. A. Blonigan and W. W. Wilson (Eds.), Handbook
of International Trade and Transportation, Chapter 6, pp. 188
235. Cheltenham, United Kingdom. Edward Elgar
Publishing Ltd.
Bemrose, R. K., W. M. Brown, and J. Tweedle
(2017). Going the Distance: Estimating the Effect of Provincial Borders on
Trade when Geography Matters. Analytical Studies Branch Research Paper Series, no. 394. Statistics Canada Catalogue no. 11F0019M. Ottawa: Statistics Canada.
Brown, M., A. Dar-Brodeur and J. Dixon.
2019. The Effect of Changing Canada-United States Border Costs on North
American Trade Patterns and Expenditures. Economic Insights, no. 096.
Statistics Canada Catalogue no. 11-626-X. Ottawa: Statistics Canada.
Costinot, A. and A. Rodriguez-Clare (2013).
Trade theory with numbers: Quantifying the consequences of globalization.
NBER Working Paper Series, no. 18896. Cambridge, Massachusetts: National Bureau of Economic Research.
Coughlin, C. C. and D. Novy (2016).
Estimating border effects: The impact of spatial aggregation. FRB St. Louis Working Paper, no. 2016-006A. St. Louis, Missouri: Federal Reserve Bank of St. Louis.
Dekle, R., J. Eaton, and S. Kortum (2008).
Global rebalancing with gravity: measuring the burden of adjustment. IMF Staff Papers 55(3), 511
540.
Fally, T. (2015). Structural gravity and
fixed effects. Journal of International
Economics 97(1), 76
85.
Head, K. and T. Mayer (2009). Illusory
border effects: Distance mismeasurement inflates estimates of home bias in
trade. In P. van Bergeijk and S. Brakma (Eds.), The Gravity Model in International Trade: Advances and Applications,
pp. 165
192. Cambridge: Cambridge
University Press.
Head, K. and T. Mayer (2014). Gravity
Equations: Workhorse, Toolkit, and Cookbook. Handbook of International Economics, volume 4 chapter 3. p. 131-195. Oxford, United Kingdom and Amsterdam: Elsevier.
Hillberry, R. and D. Hummels (2008). Trade
responses to geographic frictions: A decomposition using micro-data. European Economic Review 52(3), 527
550.
McCallum, J. (1995). National Borders
Matter: Canada-U.S. Regional Trade Patterns. American Economic Review 85(3), 615
623.
Silva, J. M. C. S. and S. Tenreyro (2006). The Log of Gravity. The Review
of Economics and Statistics 88(4), 641
658.
More information
ISSN: 2371-3429
Note of appreciation
Canada owes the success of its statistical system to a long-standing partnership between Statistics Canada, the citizens of Canada, its businesses, governments and other institutions. Accurate and timely statistical information could not be produced without their continued co-operation and goodwill.
Standards of service to the public
Statistics Canada is committed to serving its clients in a prompt, reliable and courteous manner. To this end, the Agency has developed standards of service which its employees observe in serving its clients.
Copyright
Published by authority of the Minister responsible for Statistics Canada.