
Analytical Studies: Methods and References
Linking the 2006 Census of Population to the Canadian Mortality Database: Descriptive and Validation Study

Archived Content
Information identified as archived is provided for reference, research or recordkeeping purposes. It is not subject to the Government of Canada Web Standards and has not been altered or updated since it was archived. Please "contact us" to request a format other than those available.
by Mohan B. Kumar and Rose Evra
Social and Aboriginal Statistics Division, Statistics Canada
Skip to text
Text begins
Acknowledgements
The authors would like to thank Michael Tjepkema and Lauren Pinault, Health Analysis Division, for their invaluable assistance and advice during analyses and validation, and for reading and commenting on a preliminary version of this article. They would also like to thank Émilie Mayer and Martin Lessard for support and advice during record linkage and Lenka Mach for advice on the estimation of mortality rates.
Abstract
The Canadian Mortality Database (CMDB) lacks subpopulation identifiers to examine mortality rates and disparities among groups such as First Nations, Métis, Inuit and members of visible minority groups. Linkage between the CMDB and the Census of Population is an approach to circumvent this limitation. This report describes a linkage between the CMDB (2006 to 2011) and the 2006 Census of Population, which was carried out using hierarchical deterministic exact matching, with a focus on methodology and validation. Overall, 1.2 million of the eligible 1.4 million CMDB records were linked to census records, yielding a linkage rate of 89%. However, linkage rates varied by demographic and other characteristics, notably by age group.
The report also describes the creation of a 2006 Census–CMDB cohort made up of non-institutionalized residents of Canada who completed the census long-form questionnaire (Form 2B or Form 2D). Cohort characteristics were similar to previously published estimates and to characteristics of the overall non-institutionalized population. External validity assessment comparing the survival of cohort members to survival rates using official life tables indicated similar patterns among younger ages. However, because the cohort excluded institutionalized residents, survival was higher in the cohort than in the life table population. Furthermore, mortality rates for children and teenagers living inside and outside of Inuit Nunangat were compared to previously published estimates using a geographic approach. The two sets of estimates were similar for Inuit; however, estimates of the cohort were lower than published estimates of non-Aboriginal children and teenagers.
The linkage of the 2006 Census and the CMDB offers several opportunities to examine mortality rates, as well as trends and patterns in the total Canadian population and important subpopulations. These studies could be undertaken to explore disparities between these groups and the general population, which can then inform policy making and future research.
Note: This dataset will be replaced with the updated 2006 Canadian Census Health and Environment Cohort (CanCHEC), which will be part of a series of census linked datasets that are constructed using a similar methodology. Together, these datasets, which will be updated periodically, will allow for the ongoing measurement of mortality disparities and analysis of trends over time. The CanCHEC datasets will be available in Statistics Canada’s Research Data Centres.
Keywords: Record linkage, hierarchical deterministic exact matching, validation, mortality, subpopulation identifiers
1 Introduction
The Canadian Mortality Database (CMDB) is an administrative database that collects information on cause of death from all provincial and territorial vital statistics registries in Canada. It has previously been used to estimate mortality rates and disparities among specific groups such as First Nations and Métis (Park et al. 2015; Tjepkema et al. 2009; Tjepkema et al. 2010). These estimates were achieved when the first nationally representative population-based cohort in Canada was created by linking CMDB records to the 1991 Census of Population (Wilkins, Tjepkema et al. 2008). This linkage identified individuals who reported First Nations or Métis ancestry, registered Indian status or membership in an Indian band or First Nation. Other studies using the CMDB have employed geography-based approaches to estimate mortality rates among Inuit and First Nations children and teenagers (Oliver, Peters and Kohen 2012; Peters, Oliver and Kohen 2013). These studies identified significant disparities between Aboriginal and non-Aboriginal subpopulations regarding mortality from all causes and many specific causes of death.
There is a need to update these mortality rates using a new cohort and to examine if disparities between these subpopulations also exist in the new cohort. In addition, the newly created cohort could be used to examine disparities in other subpopulations, specifically visible minorities (several researchers have expressed concern about the lack of data and research on the association between visible minority status and health) (Khan et al. 2015). Furthermore, such a study could also benefit from changes to the collection and management of records from the Census of Population. For example, electronic names of respondents were made available for the first time in the 2006 Census (Statistics Canada 2010b). In addition, individuals have been asked since 1996 if they self-identify as an Aboriginal person and if they have Aboriginal ancestry. These improvements and changes simplify and, potentially, improve record linkage and analyses.
Record linkage, the process of linking or matching records between databases, is often used to overcome data limitations and to create datasets for research (Rotermann et al. 2015). One such record linkage method is the hierarchical deterministic exact matching, which involves matching different combinations of person-level information in the datasets being linked. Person-level information may include name, sex, date of birth, postal code of residence, etc.
This study describes a record linkage between the 2006 Census records and the CMDB for 2006 to 2011 using hierarchical deterministic exact matching. It also describes the creation of the 2006 Census–CMDB cohort for follow-up to estimate mortality rates in Canada.Note 1 Furthermore, this paper also presents results from the validation of this record linkage. Through the validation, the study attempts to address the following questions: (1) Is the study cohort representative of the general, non-institutionalized population in terms of key socio-demographic characteristics? (2) Are the linked deaths representative of all deaths in the study period? (3) How do the overall death rates correspond with expected and previously estimated rates for the overall population and specific subpopulations of interest?
2 Data
2.1 2006 Census of Population
The 2006 Census of Population was administered with the short- and long-form questionnaires. One in five households received the long-form questionnaire, which asked questions about education, ethnicity, Aboriginal identity, mobility, income, employment, and more, in addition to basic demographic information. The other households received the short-form questionnaire to collect basic demographic information. Households were asked to complete the questionnaire for themselves and their household members online or by mail by May 16, 2006 (Census Day) (Statistics Canada 2010a). In Nunavut, the Northwest Territories (excluding Yellowknife), the Yukon Territory (excluding Whitehorse) and other Indian reserves and settlements, all households were asked to complete the census long-form questionnaire. Twenty-two Indian reserves were either incompletely enumerated or not enumerated at all in the 2006 Census.
The census represents 95% to 97% of the population in the provinces and 93% to 94% of the population in the territories (Statistics Canada 2010b). Undercoverage was 4% and overcoverage was 2%. Net undercoverage was higher for men, young adults, and single persons (Statistics Canada 2010b).
2.2 Canadian Mortality Database
The CMDB is an administrative database that aggregates demographic and cause of death information annually from all provincial and territorial vital statistics registries for all deaths in Canada (Statistics Canada n.d.). Some undercoverage, while minimal, exists in the database because the database does not include deaths of Canadians (1) who died outside of Canada, with the exception of United States; (2) who served as members of the Canadian military, or (3) whose bodies were unidentified. Minimal overcoverage is also expected since deaths of non-residents, while excluded from most tabulations, are registered (Statistics Canada n.d.).
For the purpose of record linkage, CMDB data were restricted to residents of Canada who died between 2006 and 2011 (1.4 million records). This is because the census pertains only to Canadian residents who were enumerated in 2006, and at the time of this record linkage, 2011 was the latest year of available CMDB records. While 2006 deaths before Census Day and deaths of those born after Census Day were retained for record linkage and data quality assessment, any links to these were removed from the analytical file after record linkage.
2.3 Amalgamated Mortality Database
The Amalgamated Mortality Database (AMDB) contains linkage keys from a previous linkage between the CMDB, records of the deceased as per tax files, the Dependent Register and the linkage control file (the latter two contain nominal and geographic information on the deceased) (Mayer 2016). This dataset was employed to retrieve names, dates of birth and postal codes from tax records for the years 2005 to 2007.
3 Methods
3.1 Preprocessing and assessment of datasets
Data from the different databases were preprocessed to improve the quality of linkage variables. From the CMDB file, all cancelled records (death registrations originally submitted by a province or territory, but subsequently cancelled) were removed. Names were standardized and formatted to match formats in the census data and special characters were removed. A preprocessed version of the 2006 Census dataset, which was linked to the Immigrant Landing File (Sanmartin et al. 2016), was used with minimal additional processing. This contained 30.7 million records collected with the census short- and long-form questionnaire. Non-imputed date of birth was used to achieve optimal matches based on raw data and to prevent linkage errors.
The linking variables from the two datasets (name, date of birth, sex and postal code) were evaluated for linkage by examining availability and frequency distributions.
3.2 Record linkage
Hierarchical deterministic exact matching was used to link the datasets using name, sex, date of birth and postal code in 20 waves (Figure 1 and Table 1). In this method, records from the two datasets are linked by matching linking variables, or different combinations and versions of linking variables. The criteria for matching was varied or stringency was changed in each wave. For example, in the first wave of this record linkage, records in the two datasets had to match exactly on all four linkage variables. In the next two waves, the records had to match on three linkage variables (Table 1). CMDB records linked in a wave were removed from the available records for linking in subsequent waves. The hierarchical deterministic exact matching method was chosen over probabilistic methods because it was deemed less time consuming and more intuitive.
MixMatch® software (version 1.3) was used to pair names in a way that allowed some discrepancies and nicknames. In waves 17 through 20, names, dates of birth and postal codes from 2005 to 2007 tax records were used for matching.
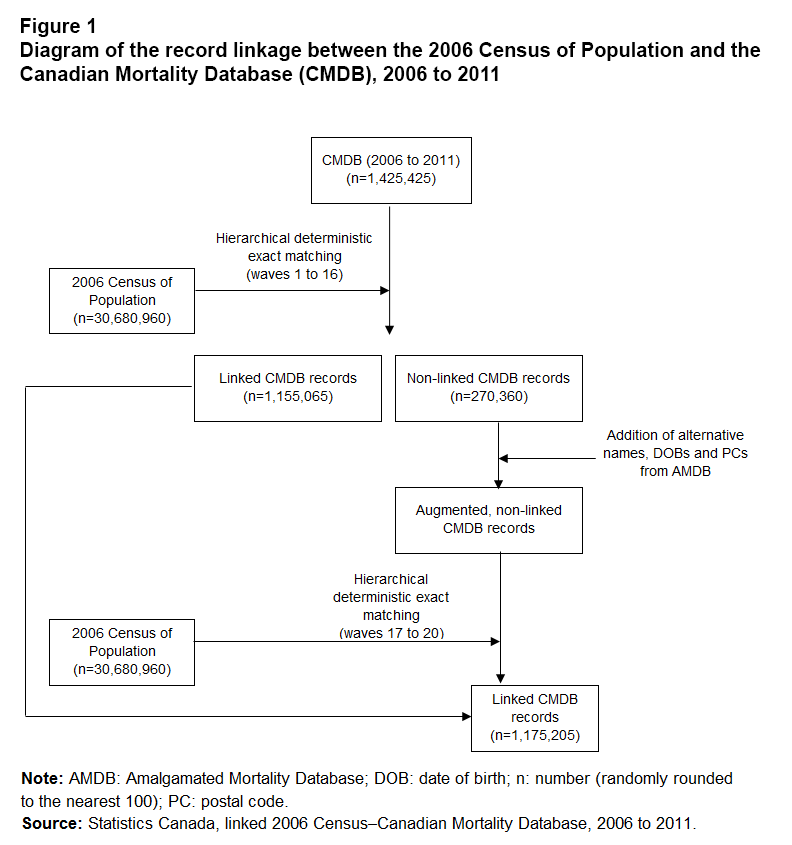
Description for Figure 1
The title of Figure 1 is “Diagram of the record linkage between the 2006 Census of Population and the Canadian Mortality Database (CMDB), 2006 to 2011.”
This diagram first presents the number of records in the CMDB from 2006 to 2011 (n=1,425,425). The CMDB was linked to the 2006 Census of Population (n=30,680,960) with hierarchical deterministic exact matching, in 16 waves (waves 1 to 16). This matching produced linked CMDB records (n=1,155,065) and non-linked CMDB records (n=270,360). Alternative names, dates of birth (DOBs) and postal codes (PCs) from the Amalgamated Mortality Database (AMDB) were added to the non-linked CMDB records. The resulting augmented, non-linked CMDB records were linked to the 2006 Census of Population (n=30,680,960) with hierarchical deterministic exact matching, in four waves (waves 17 to 20). With this second matching the number of linked CMDB records increased (n=1,175,205).
The note is as follows: AMDB: Amalgamated Mortality Database; DOB: date of birth; n: number (randomly rounded to the nearest 100); PC: postal code.
The source is as follows: Statistics Canada, linked 2006 Census–Canadian Mortality Database, 2006 to 2011.
| Wave | Linkage variables | Cumulative percentage linked | Weighted false positive rate |
|---|---|---|---|
| percent | |||
| 1 | Name + DOB + Sex + PC | 23.3 | 0.0 |
| 2 | Name + DOB + Sex | 34.7 | 0.0 |
| 3 | Name + DOB + PC | 34.8 | 0.0 |
| 4 | Last name (exact) + first name (MM) + DOB + Sex + PC | 59.1 | 0.0 |
| 5 | Name + DOB + PC3 or PC1 | 59.2 | 0.0 |
| 6 | Name + YOB/MOB + Sex + PC3 | 60.8 | 2.7 |
| 7 | Name + YOB + Sex + PC | 61.3 | 0.0 |
| 8 | Name (MM) + DOB + Sex + PC | 68.2 | 0.7 |
| 9 | Name (MM) + DOB + Sex + PC1 | 80.8 | 0.7 |
| 10 | Name (MM) + DOB + PC3 | 81.1 | 0.0 |
| 11 | Name + Sex + PC | 82.0 | 14.0 |
| 12 | Name (MM) + DOB (at least 5 common digits) + PC + Sex | 84.9 | 5.6 |
| 13 | Name (MM) + YOB/MOB + Sex +PC3 | 85.2 | 7.6 |
| 14 | Last name and first name + DOB (allowing one digit difference) + Sex | 85.7 | 6.4 |
| 15 | Name (MM) + DOB + Sex | 87.0 | 0.4 |
| 16 | Father’s or mother’s surname included in name + DOB + PC | 86.8 | 12.7 |
| 17 | Tax name + Tax DOB + Tax PC + Sex | 88.0 | 4.4 |
| 18 | Tax name + Tax DOB + Sex | 88.3 | 0.8 |
| 19 | Tax name (MM) + Tax DOB + Tax PC + Sex | 88.4 | 0.8 |
| 20 | Tax name (MM) + Tax PC3 + Tax DOB | 88.6 | 0.8 |
| Note ...: not applicable | Total | 88.6 | 0.7 |
|
... not applicable Notes: DOB: date of birth; MM: matched using MixMatch (version 1.3); MOB: month of birth; PC: postal code; PC1: first character of the postal code; PC3: first three characters of the postal code; Tax PC: postal code from 2005-to-2007 tax records; Tax DOB: date of birth from 2005-to-2007 tax records (most recent, initial and two other dates); Tax name: names from 2005-to-2007 tax records (most recent, initial and two other names;) YOB: year of birth. Source: Statistics Canada, linked 2006 Census–Canadian Mortality Database (CMDB), 2006 to 2011. |
|||
3.3 Clerical review
Clerical or manual review was undertaken by two independent reviewers who were not involved in the original record linkage. Depending on the wave, 5% to 15% of linked pairs were randomly selected for review. Pairs in the first four waves were expected to be of higher quality because the matching required higher stringency, while pairs in the later waves were expected to be of lower quality. Sample sizes were established to reflect this expectation. Overall, approximately 3,600 pairs were selected for review: a 5% sample from waves 1 to 4, a 10% sample from waves 5 to 11, and a 15% sample waves from 12 to 20.
Pairs were classified as “good” or “bad” links by comparing the name, date of birth, sex and postal code information from the census, CMDB and AMDB files. Disagreements between reviewers were resolved by a third reviewer. False positive rates were derived as the proportion of the weighted number of false positive links to the total weighted number of links in the sample.
4 Validation of record linkage
4.1 Analytical dataset
To validate the record linkage, an analytical dataset was generated by merging the linkage keys dataset (containing linking variables that correspond to those in the census dissemination and the CMDB files) with the in-scope CMDB records. In-scope records included deaths that occurred between May 16, 2006, and December 31, 2011. Deaths of individuals who were born after May 16, 2006, were excluded. The resulting dataset was then merged with the 2006 Census dissemination dataset.
These merges resulted in an analytical file with 32 million census records that included 1.2 million records with mortality information. This dataset excluded 10,700 duplicates. In addition, it excluded 100 deaths from 2011. These deaths had been part of the original dataset used for record linkage, but were subsequently removed from the CMDB. For validation and analysis, only records of long-form census questionnaires of individuals not living in institutions were retained. This dataset contained 6.5 million records.
Institutions whose residents' records were excluded from the analytical file included the following: hospitals and related institutions; facilities for the disabled; special care institutions (nursing homes, residences for senior citizens, chronic and long-term care and related institutions); establishments for children and minors; homes and treatment centres for children with psychiatric disorders or developmental disabilities; establishments for delinquents and young offenders; penal and correctional institutions; jails; police lock-up facilities; shelters for persons lacking a fixed address; other shelters and lodging with assistance; and shelters for abused women and children.
4.2 Content of the analytical file
The analytical file contained socio-economic and demographic variables from the census, including education, income, visible minority status, Aboriginal identity, place of residence, languages, mobility, marital status, and living arrangements. It also contained cause of death, place of death, date of death, neighbourhood income quintiles and more from the CMDB.
5 Internal validation
5.1 Cohort characteristics
Socio-economic and demographic characteristics of First Nations, Métis, Inuit, members of visible minority groups and non-Aboriginal groups in the cohort were examined in light of expected patterns based on previous findings and previous estimates. The characteristics examined included age (average and median), sex, education (less than a high school education), marital status, employment and adjusted after-tax income quintiles. For education and marital status, estimates were derived for people 25 years of age or older. For employment status, estimates were computed for people from 25 to 54 years of age.
5.2 Linkage rate by different socio-economic and demographic characteristics
The linkage rate was defined as the proportion of linked records to all in-scope CMDB records. For internal validation, linkage rates were computed by several socio-economic and demographic characteristics available in the CMDB. These included age group, year of death, sex, place of death, neighbourhood income quintile and cause of death. In a secondary analysis, proportions of deaths were examined by linkage status (linked / not linked), socio-economic and demographic characteristics, and cause of death for all in-scope records.
5.3 Mortality rates by different socio-economic and demographic characteristics
Mortality rates in the cohort were examined by different socio-economic and demographic characteristics to see if patterns emerged that were expected given previous literature. The study period for this analysis was May 16, 2006 (Census Day), to December 31, 2011 (end of study period), a total of 5.6 years.
Weighted age-standardized mortality rates (ASMRs) and their 95% confidence intervals were estimated by implementing PROC RATIO (Gregg et al. 2014; Reis 2007; Schenker et al. 2011) in SAS-callable SUDAAN (version 11.0.1). Briefly, ASMRs were calculated using age- and sex-specific mortality rates in 5-year age groups (based on the baseline age) (Tjepkema et al. 2009; Wilkins, Tjepkema et al. 2008), where the reference population for age standardization was the total 2006 Aboriginal population. The Aboriginal population was used as the reference population because age standardization with the total population would give undue influence to the older ages (Wilkins, Tjepkema et al. 2008). In this procedure, sampling design was specified using “with replacement” for “sampling,” long-form and short-form area stratification, and household ID variables for the nest statement.
The numerator for ASMR estimations was the number of cohort members who died of any cause during the follow-up period, and the denominator was the total person-years at risk. For each member of the cohort, person-years of follow-up were calculated as the number of days from the beginning of the study period to the date of death or to the end of the study, divided by 365.25. Variance was calculated using Taylor series linearization. Unweighted estimates and variances were also calculated to be compared with those generated using methods outlined previously (Carriere and Roos 1997) and used by Tjepkema et al. (2009).
Throughout the article, weighted estimates are presented since they take into account the sampling strategy and the variation in weights for individuals in Nunavut, the Northwest Territories (excluding Yellowknife), the Yukon Territory (excluding Whitehorse), and other Indian reserves and settlements, and other geographic areas. Estimates are presented as number of deaths per 100,000 person-years at risk.
ASMRs were compared across the following socio-demographic characteristics: marital status, immigrant status, highest level of education, employment status, income quintiles, Aboriginal identity and visible minority status. Income quintiles were derived using after-tax income adjusted for household size. Rate ratios (RRs) were calculated as the ratio of ASMR in a specific subgroup over ASMR in the reference group.
6 External validation
6.1 Comparison of survival proportions and mortality rates in the cohort to external sources
The survival proportions were computed for the cohort and compared to those from official Statistics Canada life tables. For each year of age (since Census Day) for the cohort, the proportion of initial cohort surviving the duration of follow-up was calculated as the weighted number of people who died in the 5.6 years of follow-up over the total weighted number of people of that age.
The following assumptions were made: (1) those cohort members who were not linked to a mortality record were presumed to be alive for the entire duration of follow-up, and (2) there was no immigration or emigration, or that the net effect of immigration and emigration was relatively insignificant. For this analysis, people older than 95 years of age were excluded because of the small number of deaths in this age group which is expected to be related to the small size of this subpopulation.
The cohort survival proportions were compared to the proportion of the total population expected to survive 5.6 years, by each year of age, using the 2006–2011 official Statistics Canada life tables (average of number of survivors by age from the 2006–2008, 2007–2009, 2008–2010 and 2009–2011 life tables) (Statistics Canada 2016). The percentage of individuals surviving 5.6 years was computed for each year of age using the formula . The survival curves of the cohort and life tables were compared separately for each sex.
In a separate analysis, all-cause mortality rates among children and teenagers (1 to 19 years of age) in the cohort inside and outside of Inuit Nunangat were compared with previously published estimates for the period from 2004 to 2008 by Oliver, Peters and Kohen (2012).
7 Results
7.1 Linkage results
The overall linkage rate, calculated as the number of in-scope CMDB records that were successfully linked to a census record, was 89% (Table 1). That is, of the 1.4 million CMDB deaths that occurred between 2006 and 2011, 1.2 million were linked to a census record. Linkage rates varied by wave. The first four waves, which had the highest stringency, accounted for approximately 60% of all links (Table 1).
7.2 Clerical review
Approximately 3,600 links underwent clerical review. Almost all pairs (98% weighted) were classified as “good” links, while less than 400 pairs were classified as “bad” links. Disagreements between reviewers, which arose in the case of less than two percent (1.7% weighted) of links, were resolved by a third reviewer. In the end, 0.7% of all links (weighted) were deemed to be “bad” links. However, this percentage varied by wave: the first four waves had no false positives, while two waves, 11 and 16, had false positive rates of 14% and 13%, respectively. Still, wave 11 contributed only 1% and wave 16 only 0.1% of links. As a result, links from these waves were retained in the final analysis file along with those from other waves.
8 Cohort characteristics
8.1 Characteristics by Aboriginal identity and visible minority status
There were a total of 6.5 million individuals in the cohort. In the census long-form questionnaire, individuals identified themselves as follows: 386,200 as First Nations, 90,400 as Métis, 42,400 as Inuit and 979,200 as a member of a visible minority group (numbers were all rounded to the nearest 100). The median ages were 24 years for First Nations, 29 years for Métis, 21 years for Inuit, 33 years for members of a visible minority and 39 years for non-Aboriginal identity groups (Table 2).
| Characteristic | Weighted estimates | ||||
|---|---|---|---|---|---|
| First Nations | Métis | Inuit | Visible minorities | Non-Aboriginal | |
| unweighted number | |||||
| NumberTable 2 Note 1 | 386,200 | 90,400 | 42,400 | 979,200 | 5,939,800 |
| average | |||||
| Average age | 27.9 | 30.9 | 25.3 | 32.9 | 38.6 |
| median | |||||
| Median age | 23.9 | 28.5 | 20.5 | 31.6 | 38.7 |
| percent | |||||
| Female | 51.6 | 50.4 | 50.4 | 51.4 | 50.9 |
| Less than high school education (25 years of age and older) | 41.2 | 29.3 | 53.2 | 16.8 | 20.1 |
| Marital status (25 years of age and older) | |||||
| Divorced | 9.3 | 11.8 | 4.4 | 5.8 | 9.6 |
| Legally married (and not separated) | 36.7 | 47.2 | 40.4 | 66.4 | 57.8 |
| Separated, but still legally married | 5.9 | 5.6 | 3.2 | 3.4 | 3.5 |
| Never legally married (single) | 42.8 | 31.2 | 46.6 | 20.0 | 22.4 |
| Widowed | 5.3 | 4.2 | 5.4 | 4.5 | 6.8 |
| Employed (25 to 54 years of age) | 59.9 | 74.0 | 60.8 | 74.8 | 81.2 |
| Household income quintile | |||||
| Quintile 1 (lowest) | 48.3 | 26.4 | 33.7 | 27.2 | 16.8 |
| Quintile 2 | 21.5 | 22.4 | 26.7 | 22.9 | 20.0 |
| Quintile 3 | 13.7 | 19.6 | 17.9 | 19.4 | 20.8 |
| Quintile 4 | 9.9 | 18.0 | 13.0 | 16.4 | 21.1 |
| Quintile 5 (highest) | 6.5 | 13.6 | 8.7 | 14.1 | 21.3 |
| number | |||||
| Number of deathsTable 2 Note 2 | 17,130 | 7,940 | 1,295 | 60,315 | 975,160 |
|
|||||
There was an approximately equal male-to-female distribution in all groups. However, while 20% of non-Aboriginal members reported less than a high school education, 41% of First Nations individuals, 29% of Métis and 53% of Inuit reported the same. First Nations and Inuit adults, 25 years of age and older, were less likely to be married than their non-Aboriginal and Métis counterparts. This pattern also emerged for percentage of employed among individuals 25 to 54 years of age: First Nations and Inuit adults were less likely to be employed than non-Aboriginal and Métis adults. First Nations, Métis and Inuit were more likely to be in the lowest household income quintile than non-Aboriginal people (Table 2).
8.2 Deaths and person-years at risk
In the 5.6 years of follow-up from Census Day to the end of the study period, the weighted deaths were 17,130 among First Nations, 7,940 among Métis, 1,295 among Inuit and 60,315 among visible minority groups. In comparison, there were 975,160 non-Aboriginal deaths (Table 2). Each of these groups contributed 3.9, 2.2, 0.3, 28.4 and 166.5 million person-years at risk, respectively (data not shown).
9 Validation
9.1 Internal validity
To assess internal validity and detect evidence of bias, socio-economic and demographic characteristics were used to compare linkage rates, proportions of deaths by linkage status and mortality rates.
The linkage rates were compared across years of death to see if they changed over time. The lowest linkage rate (87%) was in 2006 (Table 3). From 2007 to 2011, linkage rates then declined slightly from 2007 (89%) to 2011 (88%). However, it should be noted that no dramatic decreases in linkage rates were seen after 2007, even for the later years.
Among the different age groups, people 25 to 44 years of age had the lowest linkage rate, while people 65 to 84 years of age had the highest (Table 3). This may be connected to census undercoverage since linkage rates were lower among age groups with lower coverage rates (Table 4). Linkage rates by sex were comparable, at 88% for males and 89% for females. Linkage rates increased slightly with increasing income quintiles, from 87% to 90%. Married individuals had the highest linkage rate (93%), while single (never married) individuals had the lowest (82%). Single males were less likely to link (79%) than single females (86%). This pattern was also evident among divorced adults (80% of males and 87% of females) (data not shown). Linkage rates were not notably different for other marital status categories. When linkage rates were compared by province and territory, they were lowest for the Northwest Territories and the Yukon Territory (82% versus 86% to 91% for other jurisdictions).
Linkage rates were fairly similar (87% to 91%) across broad causes of death (communicable diseases; maternal, perinatal and nutritional conditions; and non-communicable diseases), except for unintentional and intentional injuries (82% and 78%, respectively). This pattern was particularly evident among deaths of people 20 to 35 years of age.
When proportions of deaths were compared among in-scope mortality records by linkage status, people in younger age groups (from 15 to 44 years of age) were 2 to 3 times more represented among people who were not linked than among people who were linked (Table 5). No notable differences by sex, province of death or neighbourhood income quintiles were evident.
Some causes of death were differentially represented in the linked and non-linked groups, while others were not (data not shown). The former included malignant neoplasms and cancers (higher among linked), as well as intentional and unintentional injuries (lower among linked).
9.2 Mortality rate patterns
All-cause ASMRs were compared by different socio-economic and demographic characteristics, including, sex, marital status, immigrant status, level of education, labour force status and income quintiles.
Among adults of both sexes aged 25 years and older, people who were divorced, separated or never married had an approximately 38% to 54% higher risk of death (RR = 1.38 to 1.54) compared to people who were married (Table 6). Widowed adults had approximately twice the mortality rate as married adults. Non-immigrants had an approximately 40% higher mortality rate compared to immigrants of both sexes (RR = 1.46 for females and 1.43 for males). In addition, with increasing level of education, a decreasing mortality rate was seen for both sexes: individuals with less than a high school level of education were nearly twice as likely to die as those with a Bachelor’s degree. Unemployed individuals, 25 to 54 years of age had approximately twice the risk of dying compared to employed individuals; however, individuals not in the labour force had three times the risk of dying compared to employed individuals. The risk appeared to be different for males and females, at nearly four times highr among men not in the labour force, and approximately three times higher among women not in the labour force (RR = 3.88 for males and 2.80 for females). For both sexes, mortality rates decreased with increasing income quintiles. Individuals in top quintile (top 20th percentile) had half the risk of the bottom quintile (bottom 20th percentile).
| Characteristic | Linkage rate |
|---|---|
| percent | |
| Year of death | |
| 2006 | 87 |
| 2007 | 89 |
| 2008 | 89 |
| 2009 | 89 |
| 2010 | 89 |
| 2011 | 88 |
| Sex | |
| Males | 88 |
| Females | 89 |
| Age group (years)Table 3 Note 1 | |
| 0 to 4 | 75 |
| 5 to 14 | 85 |
| 15 to 24 | 78 |
| 25 to 44 | 73 |
| 45 to 64 | 86 |
| 65 to 84 | 91 |
| 85 and older | 89 |
| Neighbourhood household income quintile | |
| Quintile 1 (lowest) | 87 |
| Quintile 2 | 89 |
| Quintile 3 | 90 |
| Quintile 4 | 90 |
| Quintile 5 (highest) | 90 |
| Missing income quintile | 67 |
| Marital status | |
| Single (never married) | 82 |
| Married/common-law relationship | 93 |
| Widowed | 88 |
| Divorced | 83 |
| Separated | 83 |
| Missing | 84 |
| Cause of death | |
| Communicable, maternal, perinatal, and nutritional conditions | 87 |
| Non-communicable diseases | 89 |
| Non-communicable diseases—Malignant neoplasms | 91 |
| Non-communicable diseases—Neuropsychiatric conditions | 88 |
| Unintentional injuries | 82 |
| Intentional injuries | 78 |
| Other | 87 |
| Region of death | |
| Newfoundland and Labrador | 90 |
| Prince Edward Island | 90 |
| Nova Scotia | 90 |
| New Brunswick | 91 |
| Quebec | 90 |
| Ontario | 88 |
| Manitoba | 90 |
| Saskatchewan | 90 |
| Alberta | 86 |
| British Columbia | 87 |
| Yukon Territory | 82 |
| Northwest Territories | 82 |
| Nunavut | 84 |
| United States of America | 85 |
|
|
| Census undercoverage rate | Linkage rateTable 4 Note 1 | |||||
|---|---|---|---|---|---|---|
| Both sexes | Male | Female | Both sexes | Male | Female | |
| percent | ||||||
| Total (all ages) | 2.7 | 3.9 | 1.5 | 89 | 88 | 89 |
| Age group (years) | ||||||
| 0 to 4 | 2.7 | 2.9 | 2.5 | 79 | 80 | 77 |
| 5 to 14 | 0.9 | 0.8 | 0.9 | 85 | 85 | 84 |
| 15 to 17 | -0.8 | -0.5 | -1.1 | 82 | 83 | 82 |
| 18 to 19 | 6.2 | 7.8 | 4.5 | 77 | 77 | 76 |
| 20 to 24 | 7.6 | 9.5 | 5.7 | 70 | 70 | 72 |
| 25 to 34 | 8.0 | 9.9 | 6.1 | 71 | 69 | 74 |
| 35 to 44 | 4.3 | 6.7 | 1.9 | 77 | 74 | 81 |
| 45 to 54 | 1.5 | 3.0 | 0.0 | 84 | 82 | 88 |
| 55 to 64 | -0.3 | 0.8 | -1.4 | 89 | 88 | 91 |
| 65 and older | -1.4 | -1.7 | -1.1 | 90 | 91 | 89 |
|
||||||
| Deaths linked | Deaths not linked | Deaths linked and not linked | |||
|---|---|---|---|---|---|
| numberTable 5 Note 1 | percent | numberTable 5 Note 1 | percent | percentTable 5 Note 2 | |
| Total | 1,176,855 | 100.0 | 151,630 | 100.0 | 1.0 |
| Age group (years) | |||||
| Under 15 | 4,710 | 0.4 | 985 | 0.6 | 0.6 |
| 15 to 24 | 10,355 | 0.9 | 3,580 | 2.4 | 0.4 |
| 25 to 44 | 43,270 | 3.7 | 14,455 | 9.5 | 0.4 |
| 45 to 64 | 229,705 | 19.5 | 34,685 | 22.9 | 0.9 |
| 65 and over | 888,785 | 75.5 | 97,860 | 64.5 | 1.2 |
| Missing age | 30 | 0.0 | 65 | 0.0 | Note ...: not applicable |
| Sex | |||||
| Female | 591,335 | 50.2 | 78,005 | 51.4 | 1.0 |
| Male | 585,515 | 49.8 | 73,620 | 48.6 | 1.0 |
| Province/territory | |||||
| Newfoundland and Labrador | 22,585 | 1.9 | 2,430 | 1.6 | 1.2 |
| Prince Edward Island | 5,940 | 0.5 | 630 | 0.4 | 1.2 |
| Nova Scotia | 42,085 | 3.6 | 4,490 | 3.0 | 1.2 |
| New Brunswick | 32,295 | 2.7 | 3,325 | 2.2 | 1.3 |
| Quebec | 287,675 | 24.4 | 32,710 | 21.6 | 1.1 |
| Ontario | 434,960 | 37.0 | 57,695 | 38.1 | 1.0 |
| Manitoba | 50,405 | 4.3 | 5,435 | 3.6 | 1.2 |
| Saskatchewan | 45,775 | 3.9 | 5,125 | 3.4 | 1.2 |
| Alberta | 98,855 | 8.4 | 16,220 | 10.7 | 0.8 |
| British Columbia | 153,530 | 13.0 | 23,005 | 15.2 | 0.9 |
| Yukon Territory | 840 | 0.1 | 190 | 0.1 | 0.6 |
| Northwest Territories | 805 | 0.1 | 175 | 0.1 | 0.6 |
| Nunavut | 505 | 0.0 | 95 | 0.1 | 0.7 |
| Out of country | 600 | 0.1 | 110 | 0.1 | 0.5 |
| Neighbourhood income quintile | |||||
| Quintile 1 (lowest) | 275,240 | 23.4 | 40,740 | 26.9 | 0.9 |
| Quintile 2 | 249,630 | 21.2 | 30,280 | 20.0 | 1.1 |
| Quintile 3 | 222,685 | 18.9 | 25,795 | 17.0 | 1.1 |
| Quintile 4 | 209,420 | 17.8 | 24,150 | 15.9 | 1.1 |
| Quintile 5 (highest) | 192,265 | 16.3 | 21,310 | 14.1 | 1.2 |
| Missing income quintile | 27,610 | 2.3 | 9,360 | 6.2 | 0.4 |
| Cause of death | |||||
| Infectious and parasitic diseases | 24,340 | 2.1 | 4,075 | 2.7 | 0.8 |
| Respiratory infections | 27,000 | 2.3 | 3,710 | 2.4 | 0.9 |
| Maternal conditions | 100 | 0.0 | 50 | 0.0 | 0.3 |
| Conditions arising during the perinatal period | 40 | 0.0 | 25 | 0.0 | 0.2 |
| Nutritional deficiencies | 2,765 | 0.2 | 365 | 0.2 | 1.0 |
| Malignant neoplasms | 362,970 | 30.8 | 35,730 | 23.6 | 1.3 |
| Other neoplasms | 7,195 | 0.6 | 720 | 0.5 | 1.3 |
| Diabetes mellitus | 35,625 | 3.0 | 4,980 | 3.3 | 0.9 |
| Endocrine disorders | 14,450 | 1.2 | 1,735 | 1.1 | 1.1 |
| Neuropsychiatric conditions | 115,515 | 9.8 | 16,270 | 10.7 | 0.9 |
| Sense organ diseases | 40 | 0.0 | 10 | 0.0 | 0.7 |
| Cardiovascular diseases | 342,630 | 29.1 | 43,335 | 28.6 | 1.0 |
| Respiratory diseases | 76,675 | 6.5 | 8,925 | 5.9 | 1.1 |
| Digestive diseases | 47,080 | 4.0 | 6,835 | 4.5 | 0.9 |
| Genitourinary diseases | 26,625 | 2.3 | 3,270 | 2.2 | 1.0 |
| Skin diseases | 1,810 | 0.2 | 240 | 0.2 | 1.0 |
| Musculoskeletal diseases | 7,790 | 0.7 | 905 | 0.6 | 1.1 |
| Congenital anomalies | 2,310 | 0.2 | 310 | 0.2 | 1.0 |
| Oral conditions | 110 | 0.0 | 25 | 0.0 | 0.6 |
| Unintentional injuries | 48,870 | 4.2 | 10,835 | 7.1 | 0.6 |
| Intentional injuries | 18,835 | 1.6 | 5,595 | 3.7 | 0.4 |
| Missing cause of death | 14,075 | 1.2 | 3,670 | 2.4 | 0.5 |
... not applicable
Source: Statistics Canada, linked 2006 Census–Canadian Mortality Database, 2006 to 2011. |
|||||
| Characteristics | Non-institutionalized population | |||||||||||
|---|---|---|---|---|---|---|---|---|---|---|---|---|
| Female | Male | Female | Male | |||||||||
| ASMRTable 6 Note 2 | 95% CI | ASMRTable 6 Note 2 | 95% CI | RRTable 6 Note 3 | 95% CI | RRTable 6 Note 3 | 95% CI | |||||
| From | To | From | To | From | To | From | To | |||||
| rate | rate ratio | |||||||||||
| Marital status (25 years of age and older) | ||||||||||||
| Legally married (and not separated)Table 6 Note 1 | 324.4 | 320.2 | 328.5 | 508.0 | 503.3 | 512.7 | 1.00 | 1.00 | 1.00 | 1.00 | 1.00 | 1.00 |
| Divorced | 449.7 | 437.8 | 461.5 | 743.4 | 723.4 | 763.5 | 1.39 | 1.37 | 1.40 | 1.46 | 1.44 | 1.49 |
| Separated, but still legally married | 446.4 | 421.0 | 471.7 | 743.8 | 715.7 | 772.0 | 1.38 | 1.31 | 1.44 | 1.46 | 1.42 | 1.51 |
| Never legally married | 468.4 | 456.4 | 480.4 | 784.3 | 768.1 | 800.4 | 1.44 | 1.43 | 1.46 | 1.54 | 1.53 | 1.56 |
| Widowed | 713.2 | 628.8 | 797.7 | 1,013.2 | 893.9 | 1,132.6 | 2.20 | 1.96 | 2.43 | 1.99 | 1.78 | 2.21 |
| Immigration status | ||||||||||||
| Immigrant | 219.3 | 215.3 | 223.2 | 350.2 | 344.6 | 355.8 | 1.00 | 1.00 | 1.00 | 1.00 | 1.00 | 1.00 |
| Non-immigrantTable 6 Note 1 | 320.1 | 317.2 | 323.0 | 500.1 | 496.2 | 504.0 | 1.46 | 1.47 | 1.45 | 1.43 | 1.44 | 1.42 |
| Education level | ||||||||||||
| Less than high school | 516.5 | 507.2 | 525.9 | 786.1 | 775.2 | 796.9 | 1.90 | 1.92 | 1.87 | 1.97 | 1.99 | 1.95 |
| High school | 388.9 | 382.7 | 395.1 | 611.9 | 602.3 | 621.5 | 1.43 | 1.45 | 1.40 | 1.53 | 1.55 | 1.52 |
| Postsecondary education below bachelor's degree | 342.6 | 337.3 | 348.0 | 570.8 | 563.8 | 577.7 | 1.26 | 1.28 | 1.24 | 1.43 | 1.45 | 1.41 |
| Bachelor's degreeTable 6 Note 1 | 272.4 | 263.6 | 281.3 | 399.5 | 389.2 | 409.7 | 1.00 | 1.00 | 1.00 | 1.00 | 1.00 | 1.00 |
| Higher than bachelor's degree | 247.2 | 232.5 | 261.9 | 355.0 | 342.3 | 367.8 | 0.91 | 0.88 | 0.93 | 0.89 | 0.88 | 0.90 |
| Labour force status (25 to 54 years of age) | ||||||||||||
| EmployedTable 6 Note 1 | 82.7 | 80.2 | 85.2 | 134.4 | 131.3 | 137.4 | 1.00 | 1.00 | 1.00 | 1.00 | 1.00 | 1.00 |
| Not in labour force | 231.9 | 223.4 | 240.3 | 521.6 | 502.7 | 540.5 | 2.80 | 2.79 | 2.82 | 3.88 | 3.83 | 3.93 |
| Unemployed | 140.2 | 127.5 | 152.9 | 269.1 | 252.3 | 285.9 | 1.69 | 1.59 | 1.79 | 2.00 | 1.92 | 2.08 |
| Income quintile | ||||||||||||
| Quintile 1 (lowest) | 301.7 | 296.4 | 307.0 | 481.1 | 473.4 | 488.7 | 1.95 | 1.96 | 1.94 | 2.07 | 2.08 | 2.06 |
| Quintile 2 | 228.4 | 224.2 | 232.5 | 379.7 | 373.9 | 385.5 | 1.47 | 1.48 | 1.47 | 1.63 | 1.64 | 1.63 |
| Quintile 3 | 199.9 | 196.2 | 203.7 | 324.4 | 319.3 | 329.5 | 1.29 | 1.30 | 1.29 | 1.40 | 1.40 | 1.39 |
| Quintile 4 | 181.3 | 177.7 | 185.0 | 281.1 | 276.4 | 285.8 | 1.17 | 1.17 | 1.17 | 1.21 | 1.21 | 1.21 |
| Quintile 5Table 6 Note 1 (highest) | 154.9 | 151.3 | 158.4 | 232.4 | 228.1 | 236.8 | 1.00 | 1.00 | 1.00 | 1.00 | 1.00 | 1.00 |
| Aboriginal identity | ||||||||||||
| First Nations | 412.3 | 394.2 | 430.4 | 584.9 | 562.8 | 606.9 | 2.01 | 1.94 | 2.08 | 1.82 | 1.76 | 1.87 |
| Métis | 294.4 | 270.0 | 318.9 | 439.0 | 407.0 | 471.0 | 1.44 | 1.33 | 1.54 | 1.36 | 1.27 | 1.45 |
| Inuit | 480.9 | 418.2 | 543.5 | 754.1 | 677.7 | 830.6 | 2.35 | 2.06 | 2.63 | 2.34 | 2.12 | 2.56 |
| Multiple Aboriginal identity responses | 407.4 | 211.5 | 603.3 | 388.6 | 190.9 | 586.4 | 1.99 | 1.04 | 2.92 | 1.21 | 0.60 | 1.81 |
| Identitiy responses not included elsewhere | 285.2 | 220.6 | 349.8 | 378.8 | 272.7 | 484.9 | 1.39 | 1.09 | 1.69 | 1.18 | 0.85 | 1.50 |
| Non-AboriginalTable 6 Note 1 | 204.9 | 203.2 | 206.6 | 321.8 | 319.4 | 324.1 | 1.00 | 1.00 | 1.00 | 1.00 | 1.00 | 1.00 |
| Member of visible minority group (excluding Aboriginal people) | ||||||||||||
| Yes | 127.9 | 123.9 | 131.8 | 193.7 | 188.4 | 199.1 | 0.59 | 0.58 | 0.61 | 0.57 | 0.56 | 0.58 |
| NoTable 6 Note 1 | 215.1 | 213.2 | 217.0 | 338.7 | 336.1 | 341.2 | 1.00 | 1.00 | 1.00 | 1.00 | 1.00 | 1.00 |
Source: Statistics Canada, linked 2006 Census–Canadian Mortality Database, 2006 to 2011. |
||||||||||||
First Nations people, Métis and Inuit were at a higher risk of death in the follow-up period than non-Aboriginal people. However, the highest mortality rates were seen among First Nations people and Inuit, who were 1.82 to 2.35 times more likely to die than non-Aboriginal individuals (Table 6). Members of a visible minority group had a 40% lower risk of death compared to other groups (excluding Aboriginal people).
9.3 External validity
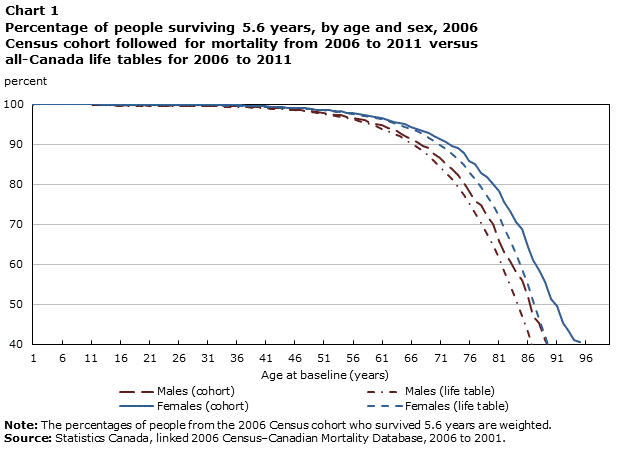
The percentage of cohort members surviving the 5.6 years of follow-up was compared to the percentage of people surviving 5.6 years based on the official life tables published by Statistics Canada for the 2006-to-2011 period. The curves of the entire male and female 2006 populations were similar to those derived using the life tables (data not shown). When the non-institutional cohort enumerated on long-form questionnaires (Form 2B or Form 2D) was compared to the life table data, the survival curves were similar in both sexes at the younger ages. However, the cohort survival curves shifted to the right with increasing age. This was particularly notable for females, suggesting better survival based on the cohort numbers than based on the life tables (Chart 1).
Data table for Chart 1
| Age at baseline (years) | Males (cohort) | Males (life table) | Females (cohort) | Females (life table) |
|---|---|---|---|---|
| percent | ||||
| 0 | 99.9 | 99.4 | 99.9 | 99.5 |
| 1 | 99.9 | 99.9 | 99.9 | 99.9 |
| 2 | 99.9 | 99.9 | 100.0 | 99.9 |
| 3 | 99.9 | 99.9 | 100.0 | 99.9 |
| 4 | 99.9 | 99.9 | 99.9 | 99.9 |
| 5 | 100.0 | 99.9 | 100.0 | 100.0 |
| 6 | 99.9 | 99.9 | 99.9 | 100.0 |
| 7 | 100.0 | 99.9 | 100.0 | 100.0 |
| 8 | 99.9 | 99.9 | 100.0 | 100.0 |
| 9 | 99.9 | 99.9 | 99.9 | 99.9 |
| 10 | 99.9 | 99.9 | 100.0 | 99.9 |
| 11 | 99.9 | 99.9 | 99.9 | 99.9 |
| 12 | 99.8 | 99.8 | 99.9 | 99.9 |
| 13 | 99.8 | 99.8 | 99.9 | 99.9 |
| 14 | 99.8 | 99.7 | 99.9 | 99.9 |
| 15 | 99.7 | 99.7 | 99.9 | 99.9 |
| 16 | 99.7 | 99.6 | 99.9 | 99.8 |
| 17 | 99.7 | 99.6 | 99.8 | 99.8 |
| 18 | 99.6 | 99.6 | 99.8 | 99.8 |
| 19 | 99.6 | 99.6 | 99.9 | 99.8 |
| 20 | 99.7 | 99.5 | 99.8 | 99.8 |
| 21 | 99.6 | 99.6 | 99.9 | 99.8 |
| 22 | 99.6 | 99.6 | 99.8 | 99.8 |
| 23 | 99.7 | 99.6 | 99.9 | 99.8 |
| 24 | 99.6 | 99.6 | 99.8 | 99.8 |
| 25 | 99.7 | 99.6 | 99.9 | 99.8 |
| 26 | 99.6 | 99.6 | 99.8 | 99.8 |
| 27 | 99.6 | 99.6 | 99.8 | 99.8 |
| 28 | 99.6 | 99.6 | 99.8 | 99.8 |
| 29 | 99.6 | 99.5 | 99.8 | 99.8 |
| 30 | 99.6 | 99.5 | 99.8 | 99.7 |
| 31 | 99.6 | 99.5 | 99.7 | 99.7 |
| 32 | 99.6 | 99.4 | 99.8 | 99.7 |
| 33 | 99.5 | 99.4 | 99.8 | 99.7 |
| 34 | 99.5 | 99.4 | 99.7 | 99.6 |
| 35 | 99.4 | 99.3 | 99.7 | 99.6 |
| 36 | 99.4 | 99.3 | 99.7 | 99.6 |
| 37 | 99.5 | 99.2 | 99.7 | 99.5 |
| 38 | 99.3 | 99.2 | 99.6 | 99.5 |
| 39 | 99.3 | 99.1 | 99.6 | 99.4 |
| 40 | 99.3 | 99.1 | 99.5 | 99.4 |
| 41 | 99.2 | 99.0 | 99.4 | 99.3 |
| 42 | 99.1 | 98.9 | 99.3 | 99.3 |
| 43 | 98.9 | 98.8 | 99.3 | 99.2 |
| 44 | 99.0 | 98.7 | 99.3 | 99.1 |
| 45 | 98.8 | 98.6 | 99.1 | 99.1 |
| 46 | 98.6 | 98.5 | 99.1 | 99.0 |
| 47 | 98.5 | 98.3 | 99.0 | 98.9 |
| 48 | 98.3 | 98.2 | 99.0 | 98.8 |
| 49 | 98.2 | 98.0 | 98.7 | 98.7 |
| 50 | 97.9 | 97.8 | 98.6 | 98.6 |
| 51 | 97.8 | 97.6 | 98.6 | 98.5 |
| 52 | 97.6 | 97.4 | 98.5 | 98.3 |
| 53 | 97.3 | 97.1 | 98.2 | 98.2 |
| 54 | 97.2 | 96.8 | 98.3 | 98.0 |
| 55 | 96.9 | 96.5 | 97.8 | 97.8 |
| 56 | 96.6 | 96.2 | 97.7 | 97.6 |
| 57 | 96.2 | 95.8 | 97.6 | 97.4 |
| 58 | 95.9 | 95.4 | 97.4 | 97.1 |
| 59 | 95.4 | 94.9 | 97.0 | 96.8 |
| 60 | 95.0 | 94.4 | 96.7 | 96.5 |
| 61 | 94.8 | 93.9 | 96.5 | 96.2 |
| 62 | 94.0 | 93.3 | 96.0 | 95.8 |
| 63 | 93.7 | 92.6 | 95.6 | 95.4 |
| 64 | 92.7 | 91.9 | 95.3 | 94.9 |
| 65 | 92.1 | 91.1 | 95.0 | 94.4 |
| 66 | 91.3 | 90.2 | 94.4 | 93.8 |
| 67 | 90.5 | 89.3 | 93.8 | 93.2 |
| 68 | 89.6 | 88.2 | 93.2 | 92.4 |
| 69 | 89.0 | 87.0 | 92.9 | 91.6 |
| 70 | 87.4 | 85.8 | 92.1 | 90.8 |
| 71 | 86.6 | 84.4 | 91.4 | 89.8 |
| 72 | 84.9 | 82.8 | 90.5 | 88.7 |
| 73 | 83.8 | 81.2 | 89.6 | 87.5 |
| 74 | 82.3 | 79.4 | 89.0 | 86.2 |
| 75 | 80.3 | 77.4 | 87.8 | 84.7 |
| 76 | 78.2 | 75.2 | 85.9 | 83.1 |
| 77 | 75.8 | 72.9 | 85.1 | 81.3 |
| 78 | 74.8 | 70.3 | 82.7 | 79.3 |
| 79 | 72.1 | 67.6 | 81.7 | 77.1 |
| 80 | 69.9 | 64.7 | 80.0 | 74.7 |
| 81 | 65.6 | 61.5 | 78.3 | 72.0 |
| 82 | 63.1 | 58.2 | 75.6 | 69.1 |
| 83 | 60.9 | 54.6 | 73.4 | 66.0 |
| 84 | 58.1 | 50.9 | 70.6 | 62.5 |
| 85 | 55.9 | 47.0 | 68.7 | 58.8 |
| 86 | 51.7 | 42.9 | 64.2 | 54.9 |
| 87 | 46.9 | 38.8 | 61.0 | 50.7 |
| 88 | 45.4 | 34.6 | 58.5 | 46.4 |
| 89 | 40.9 | 30.6 | 55.4 | 42.0 |
| 90 | 37.9 | 26.7 | 51.2 | 37.6 |
| 91 | 35.6 | 23.1 | 49.6 | 33.3 |
| 92 | 36.1 | 19.8 | 45.3 | 29.1 |
| 93 | 35.2 | 16.8 | 43.6 | 25.2 |
| 94 | 31.2 | 14.2 | 40.9 | 21.6 |
| 95 | 31.7 | 11.9 | 40.6 | 18.4 |
|
Note: The percentages of people from the 2006 Census cohort who survived 5.6 years are weighted. Source: Statistics Canada, linked 2006 Census–Canadian Mortality Database, 2006 to 2011. |
||||
Mortality rates for children and teenagers inside and outside of Inuit Nunangat were compared to previously published estimates using a geography-based approach for the 2004-to-2008 period. In the 2006 Census–CMDB cohort, mortality rates for males outside and inside of Inuit Nunangat were 29 and 178 per 100,000 person-years, respectively. For females, the corresponding rates were 16 and 86 per 100,000 person-years, respectively. In comparison, Oliver, Peters and Kohen (2012) reported 42 and 245 per 100,000 person-years among males living outside and inside Inuit Nunangat, respectively. For females, the corresponding rates were 29 and 130 per 100,000 person-years, respectively.
9.4 Discussion
A linkage between the 2006 Census and CMDB records using hierarchical deterministic exact matching yielded a linkage rate of 89%. This is comparable to other linkages (Brennan and Lessard 2013; Houle et al. 1996; Rotermann et al. 2015; Wilkins, Tjepkema et al. 2008), including the linkage between the 2006 Census and the Discharge Abstract Database (hospitalization records) that resulted in a linkage rate of 80% (Rotermann et al. 2015). About 60% of the matches were achieved in the first four waves, which were deemed to have no false positives. Overall, the weighted false positive rate was estimated to be less than one percent (0.7%).
Linkage rates did not change considerably over the follow-up period, showing only minor decreases in the last year (2011). It was anticipated that linkage rates for deaths in the later years would be significantly lower since they pertain to individuals who were more likely to have changed last names because of changes in marital status or to have changed postal codes by moving. In reality, rates were only slightly lower for these years. This may be because the matching in waves 17 to 20 allowed for linkage with alternate names and postal codes from tax-filer data. This may have circumvented linkage failure from changes in postal codes or last names among individuals who died in 2010 and 2011. The linkage rate was lowest in 2006. The linkage rate was 76% for May deaths, but 89% for December deaths. This could be because those who died just after Census Day were less likely to have filled out the census, and thus, may not have been enumerated.
The cohort characteristics were consistent with expectations. For example, First Nations people, Métis and Inuit had a lower median age than the non-Aboriginal population, with Métis having a higher median age than First Nations people and Inuit. These findings are consistent with previously published median ages from the 2006 Census (Statistics Canada 2009). First Nations, Métis and Inuit adults were less likely to have completed high school education than non-Aboriginal adults. More than half of Inuit aged 25 years and older reported this level of education. These findings are similar to previous results from the 2006 Census (Statistics Canada 2008). As expected, higher proportions of First Nations people, Métis and Inuit were in the lowest household income quintile compared to non-Aboriginal people. First Nations people and Inuit were also less likely to be employed compared to Métis and non-Aboriginal people, which is consistent with previous findings.
Internal validity assessments indicated that linkage rates were lower for individuals aged 25 to 44 years. This may result from (1) higher undercoverage for those in the younger age groups in the census, and (2) greater mobility in this age group. This was also evident when the proportion of deaths were compared by linkage status among the in-scope mortality records. Mortality rates may be underestimated for some subpopulations of interest, such as First Nations, Métis, Inuit and visible minorities, given that they have a younger population structure.
Linkage rates were also slightly lower for individuals in the low income quintiles, individuals whose marital status was single, and males. Among the provinces and territories, deaths in Nunavut, the Northwest Territories and the Yukon Territory were least likely to be linked. This could be because of the higher undercoverage rates in these territories, which may be connected to the higher proportion of young adults in these jurisdictions who are expected to be more mobile. These findings suggest that some subpopulations and age groups may be underrepresented in the cohort.
Mortality rates were compared by several socio-economic and demographic characteristics and yielded patterns consistent with previous literature. Mortality rates were significantly higher among divorced, separated and single individuals when compared to married individuals. This is in line with findings in previous studies (Gove 1973; Sbarra, Hasselmo and Nojopranoto 2012; Sbarra 2015). Immigrants had a lower risk of death compared to non-immigrants, which is similar to results from other studies and may be attributable to the “healthy immigrant effect” (Kennedy, McDonald and Biddle 2006; Ng 2011; Vang et al. 2015). Level of education, which is associated with mortality rates (Tjepkema, Wilkins and Long 2012; Wilkins, Tjepkema et al. 2008), showed similar trends in the cohort: mortality rates decreased with increasing levels of education. Individuals who were unemployed or who were not in the labour force at the time of survey were more likely to die than those who were employed. Labour force status has been previously associated with higher mortality rates (Kim et al. 2015; Ministry of Health and University of Otago 2006; Tjepkema et al. 2010). In the cohort, individuals in the higher household income quintiles were less likely to die than those in the lowest or poorest income quintile. This also has been demonstrated in previous studies (Tjepkema, Wilkins and Long 2013; Wilkins, Tjepkema et al. 2008). First Nations people, Métis and Inuit had a higher mortality rate compared to non-Aboriginal people. Inuit, in particular, were 2.4 times more at risk of death compared to non-Aboriginal people. Similar disparities have been noted previously (Peters 2013; Tjepkema et al. 2009; Wilkins, Uppal et al. 2008). Members of visible minority groups were at a lower risk of death compared to the general population, similar to patterns described previously (Wilkins, Tjepkema et al. 2008).
As part of external validity assessments, mortality rates in the cohort were compared with those from other data sources and studies. When compared with life tables, the survival curves were similar for the younger ages. But, they were shifted to the right for older ages, particularly among females. This was expected because the cohort excluded institutionalized individuals, including those in nursing homes, senior residences, and chronic and long-term care facilities, who have higher mortality rates. Similar results were seen using a 1991 Census cohort (Wilkins, Tjepkema et al. 2008). Among individuals 65 years of age and older in the census cohort enumerated on the long-form questionnaire, and including institutional residents, women were more likely than men to be in “other hospitals and related institutions,” “special care (nursing homes, residences for senior citizens, and chronic and long-term care and related institutions)” and “religious establishments” (data not shown). Females were twice as likely to be in special care institutions as males (6.9% of females compared to 3.4% of males).
Mortality rates for children and teenagers were compared to previous estimates based on a geographic approach for the 2004-to-2008 period. Cohort estimates were lower than the published estimates. This may be because institutional residents were excluded from the current cohort. In addition, methodological differences including data sources and methods for calculating denominator person-years may explain some of the differences in the estimates. For example, in the previous study, person-years at risk were derived by aggregating the five years around the 2006 Census year (Oliver, Peters and Kohen 2012).
Overall, while the validity assessments suggest that mortality rates for some subpopulations and age groups may be underestimated, the mortality rates are broadly consistent with those of other studies.
9.5 Strengths and limitations
This study addresses some of the limitations of previous linkages by (1) circumventing the need for a “bridge link” by using electronic names in the census, and (2) including all age groups and subpopulations with identifiers in the 2006 Census, such as First Nations, Métis, Inuit and visible minorities. This is the first time that the 2006 Census has been linked to the CMDB and would allow for the inclusion of the younger population. This is particularly important because of the younger population structure and the high mortality rates of First Nations people, Métis and Inuit. The availability and use of census weights will make it possible to form generalizable estimates for the whole non-institutionalized population and certain subpopulations. The availability of the many socio-economic and demographic characteristics in the census will allow analysts to examine the role these characteristics may play in mortality rate disparities in the Aboriginal and visible minority groups compared with the non-Aboriginal population.
Approximately 10% of deaths were not linked to census records. There are several reasons for this, including linkage error, census undercoverage, and deaths of individuals who immigrated after Census Day. As a result of undercoverage, the following individuals were less likely to have been linked to mortality records: individuals from 18 to 34 years of age, who are single or separated, and whose mother tongue is not English or French (Statistics Canada 2010b), among other characteristics in the census. It is unknown how much of the non-linkage was the result of the underrepresentation of some groups in the census and how much was from linkage error. Immigration and emigration were expected to have led to some non-links. These factors were not accounted for in adjusting linkage rates and estimating mortality rates. The exclusion of institutional residents may have led to an underestimation of overall mortality rates, especially among the older age groups.
Many of the socio-economic and demographic characteristics were measured at baseline (Census Day) and may have changed over time.
10 Conclusion
The linkage of the 2006 Census and the CMDB offers several opportunities for studies to examine and update mortality rates, trends and patterns in the total Canadian population and important subpopulations. These studies could examine disparities between these populations and the total population, informing policy making and future research.
Going forward, this 2006 Census–CMDB linked data described here will be replaced with the updated 2006 Canadian Census Health and Environment Cohort (CanCHEC), which will be part of a series of census linked datasets that are constructed using a similar methodology. Together, these datasets, which will be updated periodically, will allow for the ongoing measurement of mortality disparities and analysis of trends over time. The CanCHEC datasets will be available in Statistics Canada’s Research Data Centres.
References
Brennan, J., and M. Lessard. "A Record Linkage Example: Linkage of the Citizenship and Immigration (CIC) Landing File to the T1FF." Statistics Canada Methodology Seminar. Ottawa, Ontario. April 9, 2013. Lecture.
Carriere, K.C., and L.L. Roos. 1997. "A method of comparison for standardized rates of low-incidence events." Medical Care 35 (1): 57–69.
Gove, W.R. 1973. "Sex, Marital Status, and Mortality." American Journal of Sociology 79 (1): 45–67.
Gregg, E.W., Y. Li, J. Wang, N.R. Burrows, M.K. Ali, D. Rolka, D.E. Williams, and L. Geiss. 2014. "Changes in diabetes-related complications in the United States, 1990-2010." The New England Journal of Medicine 370 (16): 1514–1523.
Houle, C., J.-M. Berthelot, P. David, C. Mustard, L. Roos, and M.C. Wolfson. 1996. Project on Matching Census 1986 Database and Manitoba Health Care Files: Private Households Component. Analytical Studies Branch Research Paper Series, no. 91. Statistics Canada Catalog no. 11F0019M. Ottawa: Statistics Canada.
Kennedy, S., J.T. McDonald, and N. Biddle. 2006. The Healthy Immigrant Effect and Immigrant Selection: Evidence from Four Countries. SEDAP Research Paper no. 164. Hamilton, Ontario: McMaster University. Available at: https://socialsciences.mcmaster.ca/sedap/p/sedap164.pdf (accessed November 30, 2017).
Khan, M., K. Kobayashi, S.M. Lee, and Z. Vang. 2015. "(In)Visible Minorities in Canadian Health Data and Research." Population Change and Lifecourse Strategic Knowledge Cluster Discussion Paper Series / Un Réseau stratégique de connaissances Changements de population et parcours de vie Document de travail. Volume 3, Issue 1, Article 5.
Kim, J.M., N.-H. Son, E.-C. Park, C.M. Nam, T.H. Kim, and W.-H. Cho. 2015. "The relationship between changes in employment status and mortality risk based on the Korea Labor and Income Panel Study (2003-2008)." Asia-Pacific Journal of Public Health 27 (2): NP 993–1001.
Mayer, É. 2016. Amalgamated Mortality DataBase (AMDB). Ottawa, Ontario: Household Survey and Methodology Division (HSMD), Statistics Canada. Unpublished Report.
Ministry of Health, and University of Otago. 2006. Decades of Disparity III. Ethnic and Socioeconomic Inequalities in Mortality, New Zealand 1981–1999. Wellington, New Zealand: Ministry of Health and University of Otago.
Available at: http://www.otago.ac.nz/wellington/otago024509.pdf (accessed October 24, 2016).
Ng, E. 2011. "The healthy immigrant effect and mortality rates." Health Reports 22 (4): 25–29. Statistics Canada Catalog no. 82-003-X.
Oliver, L., P. Peters, and D. Kohen. 2012. "Mortality rates among children and teenagers living in Inuit Nunangat, 1994 to 2008." Health Reports 23 (3): 17–22. Statistics Canada Catalog no. 82-003-X.
Park, J., M. Tjepkema, N. Goedhuis, and J. Pennock. 2015. "Avoidable mortality among First Nations adults in Canada: A cohort analysis." Health Reports 26 (8): 10–16. Statistics Canada Catalog no. 82-003-X.
Peters, P.A. 2013. "An age- and cause-decomposition of differences in life expectancy between residents of Inuit Nunangat and residents of the rest of Canada, 1989 to 2008." Health Reports 24 (12): 3–9. Statistics Canada Catalog no. 82-003-X.
Peters, P.A., L.N. Oliver, and D.E. Kohen. 2013. "Mortality among children and youth in high-percentage First Nations identity areas, 2000-2002 and 2005-2007." Rural and Remote Health 13 (3): 2424.
Reis, J. P. 2007. The influence of adiposity on mortality and cardiovascular risk. University of California San Diego. PhD disseration.
Rotermann, M., C. Sanmartin, R. Trudeau, and H. St-Jean. 2015. "Linking 2006 Census and hospital data in Canada." Health Reports 26 (10): 10–20. Statistics Canada Catalog no. 82-003-X.
Sanmartin, C., E. Ng, J. Brennan, S. McLeish, R. Trudeau, and D. Manuel. 2016. Linking the Canadian Immigrant Landing File to hospital Data: A New Data Source for Immigrant Health Research. Analytical Studies: Methods and References, no. 002. Statistics Canada Catalog no. 11-633-X. Ottawa: Statistics Canada.
Sbarra, D.A. 2015. "Divorce and health: current trends and future directions." Psychosomatic Medicine 77 (3): 227–236.
Sbarra, D.A., K. Hasselmo, and W. Nojopranoto. 2012. "Divorce and Death: A Case Study for Health Psychology." Social and Personality Psychology Compass 6 (12): 905–919.
Schenker, N., V.L. Parsons, K.A. Lochner, G. Wheatcroft, and E.R. Pamuk. 2011. "Estimating standard errors for life expectancies based on complex survey data with mortality follow-up: A case study using the National Health Interview Survey Linked Mortality Files." Statistics in Medicine 30 (11): 1302–1311.
Statistics Canada. n.d. Vital Statistics - Death Database (CVSD). Available at: http://www23.statcan.gc.ca/imdb/p2SV.pl?Function=getSurvey&SDDS=3233 (accessed October 18, 2016.)
Statistics Canada. 2008. Educational portrait of Canada, 2006 Census. Ottawa, Ontario: Statistics Canada. Available at: http://www12.statcan.ca/census-recensement/2006/as-sa/97-560/pdf/97-560-XIE2006001.pdf (accessed September 9, 2016).
Statistics Canada. 2009. Aboriginal Peoples in Canada in 2006: Inuit, Metis and First Nations, 2006 Census. Ottawa, Ontario: Statistics Canada. Available at: http://www12.statcan.ca/census-recensement/2006/as-sa/97-558/pdf/97-558-XIE2006001.pdf (accessed July 3, 2016).
Statistics Canada. 2010a. 2006 Census technical report: Sampling and weighting. Ottawa, Ontario: Statistics Canada. Available at: http://www12.statcan.gc.ca/census-recensement/2006/ref/rp-guides/rp/sw-ep/sw-ep_index-eng.cfm (accessed November 20, 2017).
Statistics Canada. 2010b. 2006 Census Technical Report: Coverage. Ottawa, Ontario: Statistics Canada. Available at: http://www12.statcan.gc.ca/census-recensement/2006/ref/rp-guides/rp/coverage-couverture/pdf/92-567-X2006001-eng.pdf (accessed November 9, 2016).
Statistics Canada. 2016. Table 053-0003. Elements of the life table, Canada, provinces and territories. Annual. CANSIM (database). Available at:
http://www5.statcan.gc.ca/cansim/a26?lang=eng&retrLang=eng&id=0530003&pattern=cpi&tabMode=dataTable&srchLan=-1&p1=1&p2=50 (accessed October 18, 2016).
Tjepkema, M., R. Wilkins, and A. Long. 2012. "Cause-specific mortality by education in Canada: a 16-year follow-up study." Health Reports 23 (3): 23–31. Statistics Canada Catalog no. 82-003-X.
Tjepkema, M., R. Wilkins, and A. Long. 2013. "Cause-specific mortality by income adequacy in Canada: A 16-year follow-up study." Health Reports 24 (7): 14–22. Statistics Canada Catalog no. 82-003-X.
Tjepkema, M., R. Wilkins, S. Senécal, É. Guimond, and C. Penney. 2009. "Mortality of Métis and registered Indian adults in Canada: an 11-year follow-up study." Health Reports 20 (4): 31–51. Statistics Canada Catalog no. 82-003-X.
Tjepkema, M., R. Wilkins, S. Senécal, É. Guimond, and C. Penney. 2010. "Mortality of urban Aboriginal adults in Canada, 1991–2001." Chronic Diseases in Canada 31(1): 4–21.
Vang, Z., J. Sigouin, A. Flenon, and A. Gagnon. 2015. "The healthy immigrant effect in Canada: A systematic review." Population Change and Lifecourse Strategic Knowledge Cluster Discussion Paper Series / Un Réseau stratégique de connaissances Changements de population et parcours de vie Document de travail. Volume 3, Issue 1, Article 4.
Wilkins, R., M. Tjepkema, C. Mustard, and R. Choinière. 2008. "The Canadian census mortality follow-up study, 1991 through 2001." Health Reports 19 (3): 25–43. Statistics Canada Catalog no. 82-003-X.
Wilkins, R., S. Uppal, P. Finès, S. Senécal, É. Guimond, and R. Dion. 2008. "Life expectancy in the Inuit-inhabited areas of Canada, 1989 to 2003." Health Reports 19 (1): 7–19. Statistics Canada Catalog no. 82-003-X.
- Date modified: