
The Business & Community Newsletter – August 2019

Archived Content
Information identified as archived is provided for reference, research or recordkeeping purposes. It is not subject to the Government of Canada Web Standards and has not been altered or updated since it was archived. Please "contact us" to request a format other than those available.

Feature article
Debt and financial distress among Canadian families
 This analysis uses data from the 2016 Survey of Financial Security to examine financial distress indicators for Canadian families. Three financial distress indicators are examined: the proportion of Canadian families who skipped or delayed a mortgage payment, the proportion who skipped or delayed a non-mortgage payment and the proportion who borrowed money through a payday loan. This paper also examines the factors associated with financial distress among Canadians, with a particular focus on their debt level.
- Among Canadian families with debt, in 2016, 11% skipped or delayed a non-mortgage payment, and, among those who had mortgage debt, 4% skipped or delayed a mortgage payment in the past year.
- About 4% of Canadian families with debt reported that at least one family member borrowed money through a payday loan in the past three years.
- Families in higher debt-to-asset categories were more likely to miss or delay payments or to use payday loans. For example, among families that had a debt-to-asset ratio above 0.50—meaning that the value of their debt amounted to more than 50% of their assets—16% missed or delayed a non-mortgage payment in the previous year, compared with 7% of families that had a debt-to-asset ratio of 0.25 or below.
- The debt-to-income ratio was not significantly associated with financial distress indicators, even after accounting for other factors.
- Other family characteristics were associated with financial distress indicators. For example, lone-parent families (8%) and "other" family types (6%) were more likely to have used payday loans than couples with no children (4%), after accounting for other factors.
To find out more, read the article Debt and financial distress among Canadian families.
Did you know…?
The transition from school to work: the NEET (not in employment, education or training) indicator for 20-24-year olds in Canada
As part of the Education Indicators in Canada, this fact sheet sheds light on young NEETs aged 20 to 24, both at the national and provincial/territorial levels. The transition from school to work: the NEET (not in employment , education or training) indicator for 20-24-year olds in Canada explores in-depth gender-based differences, the effect of these young Canadians' highest level of education, as well as the impact of immigration and aboriginal identity. It also gives international and interprovincial comparisons. In fact, the Canadian NEET rate among 20- to 24-year-olds has been one to five percentage points lower than the average rate for OECD countries over the past 20 years.
 Some highlights:
- Provincially, NEET rates ranged from 10% in Quebec and British Columbia to 17% in Newfoundland and Labrador in 2018/2019. Most provinces had rates comparable with the Canadian average of 12%. However, Nunavut and the Northwest Territories had significantly higher NEET rates than the national average, reflecting the more challenging labour markets and greater challenges in accessing post-secondary education in these regions compared with the rest of Canada.
- In Canada, in 2018/2019, women and men were represented in similar proportions among NEETs aged 20 to 24. However, among those in a NEET situation who are aged 20 to 24, women were 2.5 times more likely to be out of the labour market than unemployed, and men were twice as likely as women to be unemployed. Among young Canadians who were not in a NEET situation in 2018/2019, women were more likely to be in school than men, while men were more likely to be out of school and working.
- As has consistently been the case for the past two decades, Canadian women aged 20 to 24 had lower NEET rates (12%) than the average for women from Organization of Economic Co-operation and Development (OECD) countries (17%) in 2017, the most recent year for which comparable data are available.
Visit the new Consumer Price Index Portal today!
 Statistics Canada has unveiled the new Consumer Price Index (CPI) Portal. By centralizing all CPI data, products, publications, tools and program information into one convenient location, the portal offers users a new one-stop shop for all things CPI-related. The portal will also announce new features and updates to the CPI.
Visit the CPI Portal and explore its interactive data visualization tools today! Check out the latest CPI snapshot to see what's currently driving price changes. Or explore key CPI indicators and compare price changes for goods and services in the CPI basket, over time and by geography.
As part of the agency's modernization efforts, the new CPI Portal makes it easier for users to find, analyse and use a wide range of information and products on prices paid by Canadian consumers for food, shelter, transportation, healthcare and more!
Important note: The CPI portal will be updated regularly and expanded to include additional features. We welcome your feedback to help guide future development. Your valued input can be provided in the feedback form at the bottom of the portal webpage.
Study: Evolving Internet Use Among Canadian Seniors
 Based on data from the General Social Survey, the study showed that since 2016, Internet use rates among Canadians aged 15 to 64 have reached near-saturation (97.2%) levels. However, the diffusion of information and communications technology (ICT), including the Internet, has proceeded at a much slower pace among Canadians aged 65 and older. Given that Canada is an aging society, knowing about the factors associated with Internet use among seniors is crucial for ensuring their access to it.
Rates of Internet use differ across age groups within the senior population, with about 81% use among seniors aged 65 to 69, compared with 74% among those aged 70 to 74, 64% among those aged 75 to 79, and 49% among those aged 80 or older.
Education and income are also strong predictors of Internet use among seniors. In 2016, 89% of seniors with a university education were Internet users, compared with 46% of seniors without a high school diploma. For seniors with a household income between $60,000 and $79,999, the probability of Internet use was 73%, compared with 54% among seniors with incomes under $20,000 and 79% among seniors with incomes of $100,000 and over.
To access the full study, visit Evolving Internet Use Among Canadian Seniors in the Analytical Studies Branch Research Paper Series.
Regions by the numbers
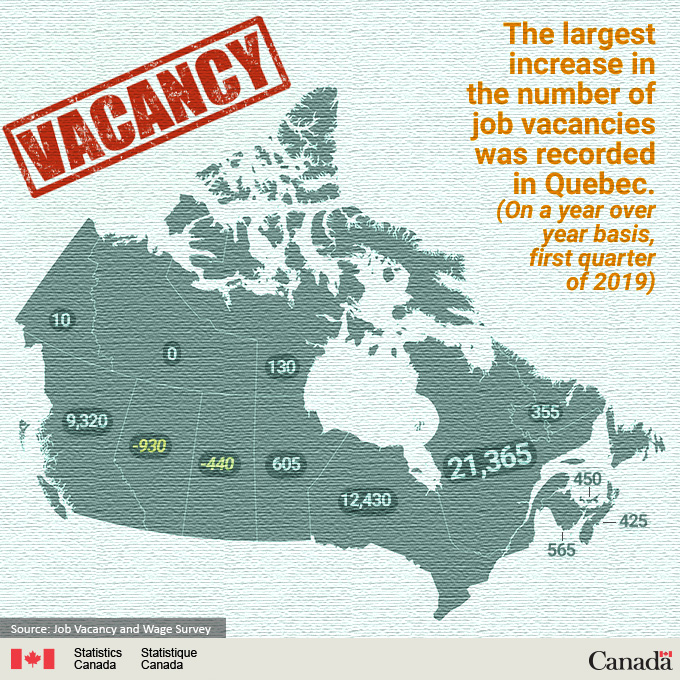
Description - Job vacancies
Vacancy
The largest increase in the number of job vacancies was recorded in Québec (On a year over year basis, first quarter of 2019)
Source: Job Vacancy and Wage Survey

Description - Property owners
1 in 4
In Ontario (in 2018), 23.3% of individual property owners were immigrants, compared with 23.1% in British Columbia, and 3.8% in Nova Scotia.
Source: Canadian Housing Statistics Program
Also worth reading
Results from the Survey on Maternal Health now available!
On June 24, Statistics Canada released the results of the new Survey on Maternal Health (SMH), providing important statistical data about recent mothers' pregnancy and postpartum mental health experiences.
The SMH, conducted by Statistics Canada, in partnership with Health Canada and the Public Health Agency of Canada, provides information about the pregnancy and postpartum experiences of biological mothers. Respondents were asked about their feelings and experiences in the time before and after the birth of their baby. Questions covered topics such as:
- feelings of post-partum depression and anxiety
- self-rated mental health
- use of mental health services
- social support
- cannabis and opioid use.
Statistics Canada developed this survey under the new Rapid Stats Survey program to provide timely, high-quality statistics on Canadians' pregnancy and postpartum experiences.
Why are the results important to Canadians?
Results from the Survey on Maternal Health will provide important data about the pregnancy and postpartum experiences of mothers in Canada. Reliable data on this topic support evidence-based decision making for Canadian families. This information will be used by researchers and policy makers to monitor maternal health and, ultimately, to improve the health and wellness of women and children.
Canada 4.0 – Canadian society, the economy and the digital transformation
Digital Conferences
 Statistics Canada is delighted to invite you to:
Gigs, superstars and the post job economy: The skills we need in Canada 4.0
When: Tuesday, September 10, 2019 from 1:30p.m. to 3:00p.m. Eastern Daylight Time, followed by a 30-minute question and answer discussion
Description: The digital transformation is changing the way we work. Advances in technology have made it increasingly attractive for firms to re-organize work into smaller projects or tasks or into projects which can be contracted out to increase flexibility and reduce costs. An emerging global labour market – where workers compete for tasks or "gigs" via digital platforms – is upending traditional economic measures, including employment, earnings and labour productivity.
This session will explore the extent and speed of these changes and the resulting challenges of developing labour market data to equip Canadian workers, businesses and students for a digital future.
Register for the English session.
Register for the French session.
Upcoming digital conferences
- September 26, 2019 – Platforms, AI, cloud computing and the changing nature of business in Canada
- October 24, 2019 – Take a tablet and call me in the morning: Healthcare in the digital age
- November 7, 2019 – Connected: The digital revolution and the well-being of Canadians
- November 28, 2019 – Canadata: Managing and governing our data reserves
- December 12, 2019 – A roadmap for Canada: Measuring our digital society and economy
For more information, please visit: Digital conferences.
You may also follow the discussion stream via Statistics Canada's Facebook page.
We sincerely hope you will join us in what will undoubtedly be a thought-provoking and fruitful discussion. Do not hesitate to share this email with partners, colleagues, staff or anyone who might be interested in participating in this event.
Statistics Canada Workshop Series 2019

Statistics Canada's Workshop Series provides you with direct access to extensive survey methodology and analysis expertise. Below you will find the workshop schedule for your region.
For workshop descriptions, please visit the Workshop series.
Understanding and Interpreting Data (2 Day)
- September 17-18, 2019 - Brandon, in English
- September 24-25, 2019 - Vancouver, in English
- October 1-2, 2019 - Regina, in English
- October 8-9, 2019 - Calgary, in English
- October 23-24, 2019 - Kelowna, in English
Turning Statistics into Stories (1 Day)
- August 22, 2019 - Whitehorse, in English
- September 19, 2019 - Brandon, in English
- September 25, 2019 - Montreal, in French
- September 26, 2019 - Vancouver, in English
- September 26, 2019 - Montreal, in English
- October 3, 2019 - Regina, in English
- October 10, 2019 - Calgary, in English
- October 24, 2019 - Kelowna, in English
- November 5, 2019 - Halifax, in English
- November 6,2019 - Halifax, in French
- November 7, 2019 - Moncton, in French
- November 8, 2019 - Moncton, in English
- November 13, 2019 - Toronto, in English
- November 21, 2019 - Ottawa, in English
- November 21, 2019 - Edmonton, in English
- December 12, 2019 - Victoria, in English
Introduction to the development and design of survey questionnaires (1 day)
- October 2, 2019 - Moncton, in French
- October 3, 2019 - Moncton, in English
How to use Census Data (1 Day)
- September 5, 2019 - Edmonton, in English
- October 3, 2019 - Toronto, in French
- October 9, 2019 - Halifax, in English
- October 10, 2019 - Halifax, in French
- October 10, 2019 - Toronto, in English
- November 5, 2019 - Ottawa, in English
- November 27, 2019 - Ottawa, in French
Introduction to Basic Statistics (1 Day)
- September 16, 2019 - Toronto, in French
- October 10, 2019 - Ottawa, in French
- October 16, 2019 - Quebec, in French
- October 17, 2019 - Quebec, in English
- October 21, 2019 - Toronto, in English
- November 14, 2019 - Ottawa, in English
- December 11, 2019 - Victoria, in English
Introduction to Survey Methods (2 Days)
- October 23-24, 2019 - Halifax, in French
- October 30-31, 2019 - Halifax, in English
Survey from Start to Finish (3 Days)
- September 17-19, 2019 - Toronto, in French
- October 22-24, 2019 - Toronto, in English
- December 17-19, 2019 - Ottawa, in English
Statistics Canada's Supply-Use Framework (2 Days)
- September 30-October 1, 2019 - Toronto, in English
- October 8-9, 2019 - Toronto, in French
- November 25-26, 2019 - Ottawa, in English
- November 28-29, 2019 - Ottawa, in French
Understanding Demographic Data (1 Day)
- September 4, 2019 - Edmonton, in English
- November 5, 2019 - Vancouver, in English
- December 10, 2019 - Victoria, in English
Developing Satisfaction Surveys (2 Days)
- November 6-7, 2019 - Vancouver, in English
Survey Sampling and Questionnaire Design (2 Days)
- November 19-20, 2019 - Edmonton, in English
A Presentation Series from Statistics Canada About the Economy, Environment and Society
 Statistics Canada engages regularly with Canadians to discuss statistical findings about the country's economy, society and environment. Events are held in various cities throughout the year to discuss the use of statistics in many fields. These events provide Statistics Canada with an opportunity to promote the role of official statistics and better understand data users' needs.
Check out online access to the presentations from the events below.
Atlantic Canada at Work: Evolving Opportunities
This presentation explores the evolving labour market in Atlantic Canada, and how it has been - and continues to be - influenced by socio-demographic factors, such as fertility, immigration and interprovincial migration. It examines the current labour market situation within the Atlantic region, as well as existing opportunities and future directions. Strategies being undertaken by Statistics Canada to provide more local and granular labour market information, and emerging issues of interest, such as the digital economy, are also presented.
- Toronto – A data Story on Ethnocultural Diversity and Inclusion in Canada
- Vancouver – A data Story on Ethnocultural Diversity and Inclusion in Canada
- Montréal – A data story on Ethnocultural Diversity and Inclusion in Canada
These presentations on Ethnocultural Diversity and Inclusion in Canada shows an overview of the evolution of ethnic, cultural, religious and linguistic diversity and its measurement in Canada, with a focus on the country's largest metropolitan areas: Toronto. Vancouver and Montreal. It also outlines the inherent challenges and opportunities embedded in the measurement of diversity and highlights some of the very real socio-economic disparities observed on the road to inclusiveness and integration.
Infographics
What matters to Canadian youth?
 At the 2019 Youth Summit in Ottawa, we asked the Prime Minister's Youth Council to provide feedback on what they would like to know about their generation. We compiled data on the topics of most interest. The data, which are from the Statistics Canada presentation entitled "A Portrait of Canadian Youth: March 2019 Updates" provide information on the diversity of youth, their technology use, their social engagement, and their levels of education. Check out What matters to Canadian youth.
Maternal Mental Health in Canada
 This infographic Maternal Mental Health in Canada depicts the percentage of mothers reporting symptoms of post-partum depression or anxiety by province, as well as the percentage of mothers who were concerned about their mental health and with whom they spoke to about it. Self-rated mental health is also presented.
- Date modified: