
The Business & Community Newsletter – May 2016

Archived Content
Information identified as archived is provided for reference, research or recordkeeping purposes. It is not subject to the Government of Canada Web Standards and has not been altered or updated since it was archived. Please "contact us" to request a format other than those available.
The Census is coming… the Census is coming!
 You may have noticed that a lot of the information that we share with you every month comes from the Census. You may also know that Canada's next census is being conducted in May 2016. In fact, many of you may already have received your census packages in the mail, providing you with the information needed to complete the questionnaire online or on paper. Every person, young and old, must be included in the 2016 Census.
Completed questionnaires will provide valuable information that will be used by all levels of government to make decisions about your neighbourhood and community. Information obtained through the census is needed to plan services such as child care, schooling, family services, housing, public transportation and skills training for employment.
Five quirky facts about Canada you may not know
With three coastlines, six time zones, 10 provinces and three territories spread out over almost 10 million square kilometres, Canada is one of the most geographically diverse nations on earth. We also have one of the most diverse populations.
As Canadians prepare for the 2016 Census, it's worth looking back at some of the more interesting findings from the last census in 2011.
- Grey power is growing. The number of seniors 65 and over has jumped 14 per cent to nearly five million. In fact, Canada has more seniors than ever before. The fastest growing age group was people between 60 and 64, while the second fastest growing age group was those 100 and over, also known as centenarians (5,825). There are five female centenarians for every male one.
- Reduce, reuse and replace. Canadians seem to be boosting our population and having more babies. The number of children under four increased by 11 per cent between 2006 and 2011, the biggest increase in 50 years.
- There's something about that Prairie air. Saskatchewan had the highest fertility rate and the highest number of centenarians of any province.
- Land of the midnight sun shining bright. Nunavut was the most youthful territory or province, with 32.7 per cent of the population under 14. The population of Nunavut has also jumped 8.3 per cent since 2006. In addition, the three most common non-official languages and mother tongues in Nunavut were Inuktitut (67.8 per cent), Inuinnaqtun (0.9 per cent) and Tagalog (Pilipino, Filipino) (0.3 per cent).
- Newfoundland and Labrador really is paradise. The town of Paradise had a 40 per cent increase in population since 2006, rising to 17,695. Population density in Paradise is 605.2 people per square kilometre while in contrast, Newfoundland and Labrador as a whole measures 1.4 persons per square kilometre.
More information on the benefits of completing your census can be found online at www.census.gc.ca.
Feature articles
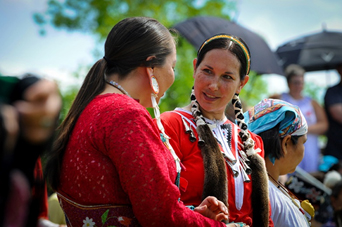
Study: Women in Canada: Visible minority women
 In this chapter of Women in Canada, titled Visible Minority Women, the demographic and socio-economic characteristics of visible minority women and girls are explored. Topics include the growth of the visible minority population in Canada and its relationship to immigration, living arrangements, education, labour force participation and employment, social participation, and health. Where it is relevant and feasible, analyses compare both the total visible minority population and specific visible minority groups with the population not belonging to a visible minority group.
Women in Canada: Women and health
Women in Canada: A Gender-based Statistical Report – The health of girls and women in Canada presents a life course perspective of the physical, mental and social health of girls and women in Canada. It is intended to provide a summary of various aspects of women's health, based on available recent survey and administrative data, as well as findings from published research papers and reports. It begins with a general overview of female health in Canada, followed by four sections that describe female health in childhood, in adolescence, in adulthood, and at older ages. Each of these sections includes information on various health behaviours, disease and chronic conditions, and mental health. Sexual activity and reproduction are also examined, beginning in adolescence.
Health Indicators, 2016
 The Health Indicators publication includes over 80 indicators that measure the health of the Canadian population and the effectiveness of the health care system. It includes updated health-region level estimates on mortality and potential years of life lost, as well as population estimates and dependency ratio. Designed to provide comparable information at the health-region and provincial/territorial levels, these data are produced from a wide range of the most recently available sources.
Aboriginal Peoples Survey: Data tables, 2012
 The Aboriginal Peoples Survey is a national survey on the social and economic conditions of Aboriginal people (First Nations people living off reserve, Métis and Inuit) aged six and older. It is designed to identify the needs of Aboriginal people and covers topics such as education, employment, health, language, income, housing and mobility.
New data tables are available from the 2012 Aboriginal Peoples Survey. The 10 tables provide data on education, employment, and Aboriginal languages spoken and understood, by age group, sex and Aboriginal identity. Data are available at the national, provincial–territorial and Inuit region levels.
Study: Earnings of postsecondary graduates by detailed field of study, 2010
 Management sciences and quantitative methods graduates were the top earners among bachelor's degree holders in 2010. A new study, Earnings of postsecondary graduates by detailed field of study, 2010, also found that earnings varied considerably across specific fields of study within broader disciplinary categories.
Using data from the 2011 National Household Survey, the study examined 25- to 54-year-old men and women whose highest level of postsecondary study was completed in Canada. Only those with a college certificate, bachelor's degree or master's degree were examined. Annual wages and salaries among full-year, full-time paid employees who reported no self-employment income in 2010 were compared across detailed fields of study. Wages and salaries were age-adjusted so that all dollar figures represent predicted wages and salaries of graduates who were approximately at or near mid-career. All wages are expressed in 2010 dollars.
Numbers in focus
Every month we put a couple of interesting numbers in the spotlight!

Numbers in Focus - $94,525
Among women with a bachelor's degree, the fields associated with the highest earnings were management sciences and quantitative methods ($94,525), chemical engineering ($94,385), and mechanical engineering ($86,549).
Source: 2011 National Household Survey (NHS)
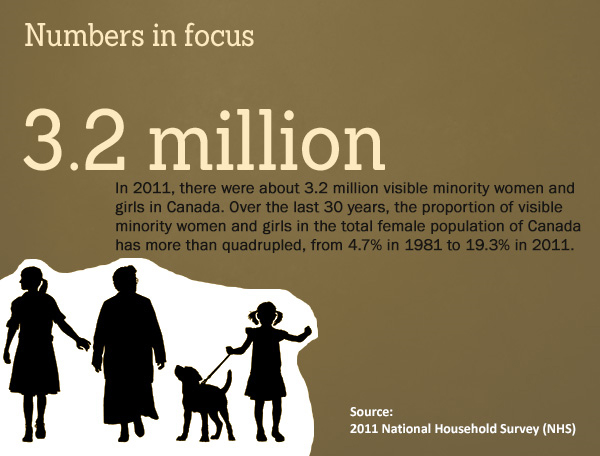
Numbers in Focus - 3.2 million
In 2011, there were about 3.2 million visible minority women and girls in Canada. Over the last 30 years, the proportion of visible minority women and girls in the total female population of Canada has more than quadrupled, from 4.7% in 1981 to 19.3% in 2011.
Source: 2011 National Household Survey (NHS)
Also worth a read
Canada at a Glance, 2016
 Canada at a Glance presents current statistics on Canadian demography, education, health and aging, justice, housing, income, labour market, household, economy, travel, finance, agriculture, foreign trade and environment. This booklet also includes important international comparisons, so that readers can see how Canada stacks up against its neighbours. Updated yearly, Canada at a Glance is a very useful reference for those who want quick access to current Canadian statistics.
What's new?
Statistical Information Service – Your Gateway to Statistics Canada!
 Do you need help accessing and using statistical data and defining your needs?
With friendly and knowledgeable staff in Halifax, Montréal, Ottawa, Toronto, Winnipeg, Edmonton and Vancouver, the Statistical Information Service (SIS) is your gateway for requests for Statistics Canada's statistical information.
SIS offers data users a complete range of high quality services. SIS assists data users by:
- providing help navigating our website and finding answers to simple data requests, technical and methodological questions;
- responding to complex requests requiring research, extraction or customization of data from multiple sources;
- producing customized data reports, analyses and maps;
- offering standard and customized workshops on a variety of topics and levels;
- engaging in many ongoing outreach initiatives such as free webinars, newsletters, presentations, information sessions, conferences and open houses.
For more details on SIS, please see the article Calling StatCan featured in the StatCan Blog.
You can contact us at 1-800-263-1136 or at STATCAN.infostats-infostats.STATCAN@canada.ca.
- Date modified: