
Economic impacts and recovery related to the pandemic

Archived Content
Information identified as archived is provided for reference, research or recordkeeping purposes. It is not subject to the Government of Canada Web Standards and has not been altered or updated since it was archived. Please "contact us" to request a format other than those available.
Key messages:
- Output is recovering as businesses reopen – but stark differences across sectors. Output in accommodation and food services in June was at 55% of its pre-pandemic level.
- Employment is recovering, but steep losses remain in certain highly impacted sectors. Youth, less educated workers, women, recent immigrants, and temporary employees have been hit harder.
- Prior to the pandemic, firm creation was on a upswing and the financial position of firms was improving. Closures rose dramatically during the shutdowns as employees left payrolls - 62,600 business closures were observed in May, 29% less than in April but still 59% higher than pre-COVID-19 levels observed in February.
- Structural challenges in heavily affected sectors - The retail sector rebounded quickly from storefront closures as companies developed or enhanced their on-line platforms.
- Digitalization will be a driver of structural change in the economy. The share of businesses with at least 10% of their workforce teleworking doubled from February to May 2020, from 16.6% to 32.6%.
- Unequal impacts on Canadian workers
- Business uncertainty in the recovery phase
- Structural challenges in heavily affected sectors
- Investing in resilience and growth
Unprecedented declines in output
Real gross domestic product

Description - Real gross domestic product
| Real gross domestic product | |
|---|---|
| 2007 | 0.6 |
| 1.0 | |
| 0.4 | |
| 0.1 | |
| 2008 | 0.1 |
| 0.4 | |
| 0.8 | |
| -1.2 | |
| 2009 | -2.3 |
| -1.1 | |
| 0.4 | |
| 1.2 | |
| 2010 | 1.2 |
| 0.5 | |
| 0.7 | |
| 1.1 | |
| 2011 | 0.8 |
| 0.2 | |
| 1.4 | |
| 0.8 | |
| 2012 | 0.1 |
| 0.3 | |
| 0.1 | |
| 0.2 | |
| 2013 | 0.9 |
| 0.6 | |
| 0.8 | |
| 1.1 | |
| 2014 | 0.2 |
| 0.9 | |
| 1.0 | |
| 0.7 | |
| 2015 | -0.5 |
| -0.3 | |
| 0.4 | |
| 0.1 | |
| 2016 | 0.5 |
| -0.5 | |
| 1.0 | |
| 0.6 | |
| 2017 | 1.2 |
| 1.2 | |
| 0.4 | |
| 0.4 | |
| 2018 | 0.5 |
| 0.4 | |
| 0.6 | |
| 0.2 | |
| 2019 | 0.3 |
| 0.8 | |
| 0.3 | |
| 0.1 | |
| 2020 | -2.1 |
| -11.5 | |
The 2008-2009 recession witnessed sharp reductions in business investement and trade. Annual GDP fell 2.9% in 2009. Economic growth rebounded sharply in 2010 and 2011, supported by investment and trade in energy. Economic strength in Western Canada supported the recovery. Oil price shock: Sharp contractions in investment spending. Alberta's economy contracted by 3.5% in 2015 and 3.6% in 2016. Job creation strengthens from mid-2016 to late 2017 as growth shifts towards Ontario, Quebec and British Columbia. Economic growth moderates in 2018 and 2019 as household spending and business investment slow. The COVID-19 pandemic: Severe declines in household spending, business investment and trade. Notes: Data available on CODR. Quarter over quarter percent changes derived and presented in the graph. Source: Statistics Canada, table 36-10-0104. |
|
As a purposeful, policy-based response to a health crisis, the COVID-19 restrictions brought about severe contractions in most industrial sectors, including in many service-based industries that typically support the economy during conventional downturns.
The road to recovery will involve major adaptations for businesses and households, which pose challenges for an equitable and resilient recovery.
Severe declines in most types of economic activity
During Q2, household spending fell by a record 13% as families faced heightened levels of job and income uncertainty.
Employment earnings fell by almost 9% in the second quarter. At the same time, household disposable income rose by almost 11%, because of the transfers and income supports provided by governments. Higher disposable income, coupled with lower spending, pushed the household savings rate to just over 28%, up from about 8% in the first quarter.
Many different aspects of the economy, from trade to investment to consumer spending, will need to rebound if the recovery is to be robust.
Strong retail numbers in May and June and housing numbers in July indicate consumers are opening their pocket books, but questions about the long term impact of the pandemic on mid and lower income households remain. The outlook on business investment remains weak and the outlook on trade is mixed, depending largely on developments in the U.S.
Historic declines in household spending, business investment, and international trade as the economy contracted by 11.5% in the second quarter

Description - Historic declines in household spending, business investment, and international trade as the economy contracted by 11.5% in the second quarter - Real GDP and selected components
| Q2 2020 | Q1 2020 | Q4 2019 | Q3 2019 | |
|---|---|---|---|---|
| Real gross domestic product at market prices | -11.5 | -2.1 | 0.1 | 0.3 |
| Household spending | -13.1 | -3.2 | 0.4 | 0.5 |
| Business investement | -16.2 | -0.6 | -0.7 | 1.7 |
| Exports | -18.4 | -2.2 | -1.1 | -0.1 |
| Imports | -22.6 | -2.6 | -0.8 | 0 |
| Notes: Data available on CODR. Quarter over quarter percent changes derived and presented in the graph. Source: statistics Canada, Table 36-10-0104-01. |
||||
Output is recovering as businesses reopen – but stark differences across sectors
Many consumer-facing services face major logistical challenges and adaptation costs, particularly those directly involved in tourism and hospitality.
Output in accommodation and food services in June was at 55% of its pre-pandemic level.
But, the recovery, especially in services, is very uneven, with many professional services rebounding quickly while other services struggle to recover.
Economic output continues to rebound as more businesses reopen

Description - Economic output continues to rebound as more businesses reopen
| February | March | April | May | June | |
|---|---|---|---|---|---|
| Total | 100 | 93 | 82 | 86 | 91 |
| Goods industries | 100 | 94 | 79 | 85 | 92 |
| Service industries | 100 | 92 | 83 | 86 | 91 |
| Notes: Data available on CODR. Month over month percent changes derived and presented in the graph. Source(s): Statistics Canada, table 36-10-0434-01. Release Date: August 28, 2020. |
|||||
Real gross domestic product, expressed as a percentage of pre-COVID levels, selected service industries industries

Description - Real gross domestic product, expressed as a percentage of pre-COVID levels, selected service industries industries
| Activity during COVID-19 economic shutdown (April 2020) | Activity during current reference month (June 2020) | |||
|---|---|---|---|---|
| Service industries | 83 | 91 | ||
| Finance and insurance | 99 | 101 | ||
| Professional, scientific and technical services | 87 | 91 | ||
| Retail trade | 71 | 101 | ||
| Transportation and warehousing | 68 | 74 | ||
| Accommodation and food services | 34 | 55 | ||
| Source: Statistics Canada, table 36-10-0434-01. | ||||
Historic declines in labour market activity
Employment losses totaled 3 million from February to April, almost 2 million of which were in full-time work.
Employment rose by 1.9 million from April to August. Total employment in August was 5.3% below its pre-pandemic level.
Employment, by type of work

Description - Employment, by type of work
| February | March | April | May | June | July | August | |
|---|---|---|---|---|---|---|---|
| Total | 100.0 | 94.7 | 84.3 | 85.9 | 90.8 | 93.0 | 94.3 |
| Full-time | 100.0 | 97.0 | 87.5 | 88.9 | 92.1 | 92.5 | 93.9 |
| Part-time | 100.0 | 85.0 | 70.4 | 72.4 | 85.4 | 95.0 | 96.1 |
| Source: Statistics Canada, table 14-10-0287-01. | |||||||
Labour market indicators:
Unemployment rate:
- 10.2% (August)
- 10.9% (July)
- 13.7% (May)
- 5.6% (February)
Employment rate:
- 58.0% (August)
- 57.3% (July)
- 52.1% (April)
- 61.8% (February)
Assessing the recovery to date: From February to April, 5.5 million Canadian workers were affected by the COVID-19 economic shutdown. By August, the number of impacted workers had fallen to 1.8 million.
Employment is recovering, but steep losses remain in certain highly impacted sectors
Employment in several heavily impacted industries (e.g., construction, manufacturing) has rebounded to more than 90% of pre-COVID levels as businesses reopen. By contrast, overall employment in accommodation and food services remains over 20% below levels in February.
However, payroll employment (a stricter measure of employment based on the number of workers receiving pay or benefits) yields a different perspective on the financial challenges facing many workers, especially those in lower earning occupations.
Net employment losses, February to August, 2020
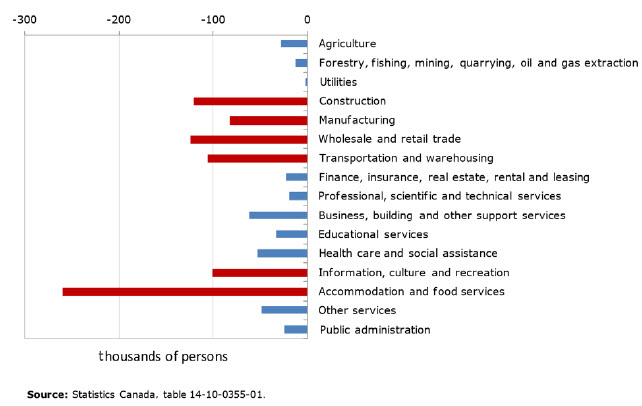
Description - Net employment losses, February to August, 2020 (Thousands of persons)
Net employment losses, February to August, 2020 (Thousands of persons)
| Thousands of persons | |
|---|---|
| Agriculture | -28 |
| Forestry, fishing, mining, quarrying, oil and gas extraction | -13 |
| Utilities | -2 |
| Construction | -121 |
| Manufacturing | -83 |
| Wholesale and retail trade | -124 |
| Transportation and warehousing | -106 |
| Finance, insurance, real estate, rental and leasing | -23 |
| Professional, scientific and technical services | -19 |
| Business, building and other support services | -62 |
| Educational services | -33 |
| Health care and social assistance | -53 |
| Information, culture and recreation | -101 |
| Accommodation and food services | -260 |
| Other services | -49 |
| Public administration | -24 |
| Source: Statistics Canada table: 14-10-0355-01. | |
Severe declines in payroll employment among hourly paid workers
- As of July, there had been only a modest recovery in the number of payroll jobs (based on the number of workers receiving pay and benefits in that month).
- Overall payroll employment was down 1.9 million from February levels, with hourly paid workers accounting for two-thirds of overall losses. Payroll employment in accommodation and food services was about two-thirds of its pre-COVID-19 level.
- Among hourly paid workers, payroll employment in July remained about 13% below February's level.
Hourly paid workers have been far more severely impacted

Description - Hourly paid workers have been far more severely impacted
| February | March | April | May | June | July | |
|---|---|---|---|---|---|---|
| hourly paid employees | 100.0 | 92.5 | 76.4 | 74.5 | 81.1 | 86.7 |
| salaried employees | 100.0 | 96.9 | 94.2 | 92.2 | 92.5 | 94.5 |
| Source: Statistics Canada table, 14-10-0222. | ||||||
Economic impacts - Unequal impacts on Canadian workers
Challenges for robust, inclusive growth - Unequal impacts on Canadian households
- Prior to Covid-19, Canadian families were unequal in their ability to deal with a lockdown, as many had little savings or financial reserves to rely on during extended work stoppages.
- Facing a two-month work stoppage, about one in four families did not have enough savings to avoid falling into poverty in the absence of government transfers.
- New Canadians, lower educated workers, and diverse population groups are among those at most risk.
Unequal impacts - Financial vulnerabilities among working families prior to COVID-19
Without government transfers, financially vulnerable families would have needed, on average, $3,500 over 2 months to stay above low income.
1 in 3 Canadians did not have enough savings to handle a 3-month work stoppage.
Financial vulnerability, by age and family type

Description - Financial vulnerability, by age and family type
| Percent | |
|---|---|
| Age | |
| 65 and over | 10.4 |
| 35 to 64 | 23.4 |
| Under 35 | 37.3 |
| Family composition | |
| Single fathers | 28.9 |
| Single mothers | 56.3 |
| Non-elderly married with children | 27.5 |
| Non-elderly married without children | 17.9 |
| Non-elderly unmarried women | 35.5 |
| Non-elderly unmarried men | 37.4 |
| All | 26.4 |
| Source: Statistics Canada, Survey of Financial Security, 2016. | |
Unequal impacts - Visible minority groups face much higher risks from work stoppages
Poverty rates in 2015 among working families, by visible minority group of major income earner

Description - Poverty rates in 2015 among working families, by ethnicity of major income earner
| Percent | |
|---|---|
| White | 5.3 |
| Filipino | 7.9 |
| Other visible minorities | 9.4 |
| South Asian | 10.8 |
| Latin American | 10.8 |
| Southeast Asian | 10.8 |
| Black | 11.3 |
| Japanese | 12.3 |
| Chinese | 13.7 |
| Arab | 14.3 |
| West Asian | 18.8 |
| Korean | 23.2 |
| Note: People not designated as a visible minority are identified with the colour red. Source: Statistics Canada, Census of Population of 2016. |
|
Recent immigrants were more likely than Canadian-born workers to move out of employment in March and April, mainly because of their shorter job tenure and over-representation in lower-wage jobs
Percentage of workers employed in accommodation and food services and arts, entertainment and recreation, 2016

Description - Percentage of workers employed in accommodation and food services and arts, entertainment and recreation, 2016
| Percent | |
|---|---|
| South Asian | 9.7 |
| Chinese | 12.5 |
| Black | 9.2 |
| Filipino | 15.5 |
| Latin American | 9.6 |
| Arab | 9.2 |
| Southeast Asian | 15.3 |
| West Asian | 10.8 |
| Korean | 20.6 |
| Japanese | 15.8 |
| Other visible minorities | 10.8 |
| Aboriginal peoples | 10.4 |
| White | 8.0 |
| Overall | 8.8 |
| Note: People not designated as a visible minority are identified with the colour red. Source: Statistics Canada, Census of Population of 2016. |
|
Unequal impacts - Low-wage workers have been affected to a far greater extent than during the 2008-2009 recession
Average monthly layoff rates of employees, by wage decile, 2007, 2009 and 2020*
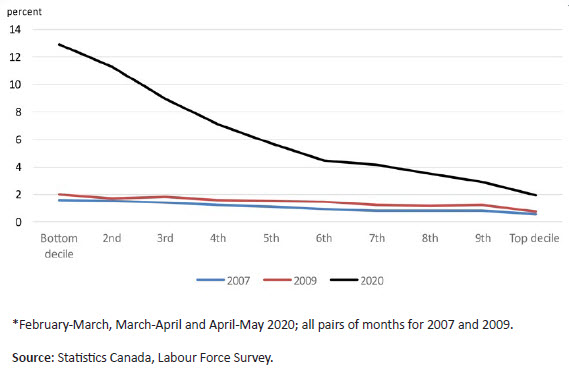
Description - Average monthly layoff rates of employees, by wage decile, 2007, 2009 and 2020*
| 2007 | 2009 | 2020 | |
|---|---|---|---|
| Bottom decile | 1.6 | 2.0 | 12.9 |
| 2nd | 1.5 | 1.7 | 11.3 |
| 3rd | 1.4 | 1.8 | 9.0 |
| 4th | 1.2 | 1.6 | 7.1 |
| 5th | 1.1 | 1.5 | 5.8 |
| 6th | 0.9 | 1.5 | 4.5 |
| 7th | 0.8 | 1.2 | 4.1 |
| 8th | 0.8 | 1.2 | 3.5 |
| 9th | 0.8 | 1.2 | 2.9 |
| Top decile | 0.6 | 0.7 | 1.9 |
| Source: Statistics Canada, Labour Force Survey. | |||
Percentage change, from 2019 to 2020, in the number of employees working at least half their usual hours, by 2019 wage decile

Description - Percentage change, from 2019 to 2020, in the number of employees working at least half their usual hours, by 2019 wage decile
| April | July | |
|---|---|---|
| Bottom decile | -65.1 | -39.4 |
| 2 | -52.7 | -20.1 |
| 3 | -43.4 | -11.1 |
| 4 | -24.1 | -0.6 |
| 5 | -34.3 | -12.6 |
| 6 | -25.8 | -9.9 |
| 7 | -16.4 | -3.4 |
| 8 | -9.7 | 2.7 |
| 9 | -0.5 | 8.0 |
| Top decile | 13.7 | 16.0 |
| Source: Statistics Canada, Labour Force Survey. | ||
Unequal impacts - Youth, less educated workers, women, recent immigrants, and temporary employees have been hit harder
Among temporary employees aged 25-54, employment at significant hours was 20% lower in August 2020 than in August 2019
Among permanent employees aged 25-54, the corresponding gap was 3%
Employees holding jobs that can be done from home have generally fared better
Percentage change, in the proportion of population employed and working at least half of their usual hours
Individuals aged 15 to 24 versus others

Description - Individuals aged 15 to 24 versus others
| 15 to 24 | 25 to 44 | All | |
|---|---|---|---|
| February | 101.8 | 100.8 | 101 |
| March | 67.3 | 82.3 | 80 |
| April | 51.7 | 72.8 | 70 |
| May | 57.3 | 77.4 | 75 |
| June | 75.3 | 85.2 | 83 |
| July | 83.2 | 91.3 | 89 |
| August | 85.7 | 93.5 | 91 |
| Source: Statistics Canada, special tabulations, Labour Force Survey. | |||
Women versus men

Description - Women versus men
| men | women | |
|---|---|---|
| February | 100.9 | 100.6 |
| March | 84.9 | 74.8 |
| April | 72.8 | 67.5 |
| May | 77.5 | 71.2 |
| June | 86.0 | 80.4 |
| July | 90.4 | 87.9 |
| August | 92.4 | 89.4 |
| Source: Statistics Canada, special tabulations, Labour Force Survey. | ||
Individuals aged 25 to 54, by education

Description - Individuals aged 25 to 54, by education
| Less than high school | High school | BA+ | |
|---|---|---|---|
| February | 101.6 | 102.2 | 100.1 |
| March | 76.6 | 81.7 | 84.4 |
| April | 58.4 | 65.0 | 82.8 |
| May | 67.7 | 70.7 | 85.4 |
| June | 82.6 | 81.5 | 89.1 |
| July | 91.3 | 86.3 | 94.5 |
| August | 95.6 | 88.6 | 95.7 |
| Source: Statistics Canada, special tabulations, Labour Force Survey. | |||
Individuals aged 15 and over, by immigration status

Description - Individuals aged 15 and over, by immigration status
| Recent immigrants | Others | |
|---|---|---|
| February | 101.5 | 100.7 |
| March | 84.1 | 79.9 |
| April | 66.0 | 70.7 |
| May | 70.7 | 74.9 |
| June | 82.1 | 83.5 |
| July | 88.9 | 89.4 |
| August | 91.1 | 91.3 |
| Source: Statistics Canada, special tabulations, Labour Force Survey. | ||
Unequal impacts - Women and youth
Employment losses among youth were severe during the containment phase (totaling over 870,000). Since April, youth employment has rebounded by 483,000.
Employment, expressed as a percentage of pre-COVID levels , by age group and sex

Description - Employment, expressed as a percentage of pre-COVID levels , by age group and sex
| Indexed employment level during COVID-19 economic shutdown (April 2020) | Indexed employment level during current reference month (August 2020) | |
|---|---|---|
| Youth: male | 70 | 85 |
| Youth: female | 62 | 85 |
| Core-age: male | 88 | 97 |
| Core-age: female | 87 | 96 |
| Older: male | 87 | 95 |
| Older: female | 86 | 94 |
| Notes: Youth: 15 to 24 year-olds; Core-age: 25 to 54 year-olds; Older: 55 year- olds and over. Source: Statistics Canada, table 14-10-0287-01. |
||
Employment, expressed as a percentage of pre-COVID-19 levels, by type of work

Description - Employment, expressed as a percentage of pre-COVID-19 levels, by type of work
| Indexed employment level during COVID-19 economic shutdown (April 2020) | Indexed employment level during current reference month (August 2020) | |
|---|---|---|
| Youth: Full-time | 78 | 77 |
| Youth: Part-time | 53 | 93 |
| Core-age: Full-time | 88 | 95 |
| Core-age: Part-time | 79 | 102 |
| Older: Full-time | 88 | 95 |
| Older: Part-time | 81 | 92 |
| Notes: Youth: 15 to 24 year olds; Core-age: 25 to 54 year olds; Older: 55 year olds and over. Source: Statistics Canada, table 14-10-0287-01. |
||
Unequal impacts - A weaker recovery among young Canadians
Youth employment was much slower to recover, particularly in terms of full-time work, especially among women. The youth unemployment rate in August was 23.1%, compared to 10.3% in February.
Unemployment rate, 15 to 24 year-olds, February to August, 2020

Description - Unemployment rate, 15 to 24 year-olds, February to August, 2020
| 15 to 24 year-olds | |
|---|---|
| February | 10.3 |
| March | 16.8 |
| April | 27.2 |
| May | 29.4 |
| June | 27.5 |
| July | 24.2 |
| August | 23.1 |
| Source: Statistics Canada, table 14-10-0287-01. | |
The partial recovery in youth employment since April, has all been in part-time work. Full-time work among young Canadians is down 23% from pre-COVID levels. Among young women, it's down almost 30%.
Full-time employment, 15 to 24 year-olds, February to August, 2020

Description - Full-time employment, 15 to 24 year-olds, February to August, 2020
| February | March | April | May | June | July | August | |
|---|---|---|---|---|---|---|---|
| Total | 100.0 | 94.6 | 77.8 | 76.5 | 80.7 | 74.6 | 76.7 |
| Young men | 100.0 | 95.3 | 77.8 | 78.0 | 82.8 | 78.8 | 80.9 |
| Young women | 100.0 | 93.6 | 77.8 | 74.5 | 77.7 | 68.7 | 70.9 |
| Source: Statistics Canada, table 14-10-0287-01. | |||||||
Unequal impacts - Larger impacts on women and youth
– RBC Economics, July 16
About 50% of young employed women work in either retail or accommodation and food, compared to 38% of young men.
Decline in labour force participation rate, February to August:
Men: -0.5 percentage points
Women: -1.4 percentage points

Description - Distribution of employment across industries
| All persons | Men | Women | Young men | Young women | |
|---|---|---|---|---|---|
| Agriculture | 2.4 | 3.3 | 1.5 | 3.3 | 1.6 |
| Mining, quarrying, and oil and gas extraction | 1.5 | 2.3 | 0.6 | 1.2 | 0.3 |
| Utilities | 0.7 | 1.1 | 0.4 | 0.5 | 0.2 |
| Construction | 7.5 | 12.6 | 1.9 | 11.2 | 1.2 |
| Manufacturing | 8.7 | 12.1 | 5.1 | 8.0 | 3.0 |
| Wholesale | 3.6 | 4.7 | 2.5 | 2.9 | 1.3 |
| Retail | 11.6 | 10.3 | 12.9 | 21.7 | 26.3 |
| Transportation and warehousing | 4.8 | 6.9 | 2.5 | 3.3 | 1.1 |
| Information and cultural | 2.3 | 2.6 | 2.0 | 2.0 | 1.8 |
| Finance and insurance | 4.3 | 3.4 | 5.3 | 1.8 | 2.4 |
| Real estate, rental and leasing | 1.8 | 1.9 | 1.7 | 1.1 | 0.8 |
| Professional, scientific and technical | 7.3 | 7.8 | 6.8 | 3.7 | 3.8 |
| Management of companies | 0.2 | 0.1 | 0.2 | 0.1 | 0.1 |
| Administrative and support services | 4.4 | 4.9 | 3.9 | 6.2 | 3.0 |
| Education | 7.4 | 4.4 | 10.6 | 3.1 | 5.9 |
| Health care and social services | 11.7 | 4.0 | 20.1 | 2.1 | 10.8 |
| Arts, entertainment and recreation | 2.1 | 2.0 | 2.1 | 4.1 | 4.5 |
| Accommodation and food | 7.0 | 5.6 | 8.6 | 16.6 | 24.6 |
| Other services | 4.5 | 3.9 | 5.1 | 3.6 | 4.1 |
| Public administration | 6.2 | 6.2 | 6.2 | 3.7 | 3.3 |
| Source: 2016 Census of Population. | |||||
Unequal impacts - Earning losses over time
Long-term effects of COVID-19 will depend critically on the degree to which layoffs become permanent job losses
In the 3 previous downturns, 45% of laid-off workers ended up losing their job.
Of those who lost their job, one in five had substantial (25% or more) earnings declines 5 years after job loss, when EI benefits no longer apply.

Description - Selected statistics - current and previous labour market downturns
| Labour market downturn | Average monthly layoff rates | |||
|---|---|---|---|---|
| 1981 to 1982 | 1990 to 1992 | 2008 to 2009 | February-March and March-April 2020 | |
| percent | ||||
| Overall | 3.5 | 3.4 | 2.5 | 12.4 |
| Men | 3.9 | 4.1 | 3.3 | 12.2 |
| Women | 2.9 | 2.5 | 1.8 | 12.6 |
| Educational attainment | ||||
| Below Bachelor's degree | 3.8 | 3.8 | 3.0 | 15.1 |
| Bachelor's degree or higher | 1.2 | 0.8 | 1.1 | 7.2 |
| Age group | ||||
| 15 to 24 | 5.2 | 4.8 | 4.1 | 25.1 |
| 25 to 44 | 2.9 | 3.1 | 2.1 | 10.7 |
| 45 to 64 | 2.8 | 2.9 | 2.3 | 9.9 |
| Permanently laid-off workers as a percentage of all laid-off workers | 46.2 | 46.4 | 44.6 | … |
| …not applicable Notes: Paid workers aged 15 to 64. Montly layoff rates include temporary layoffs and permanent layoffs and are computed for the first two pairs of months of each labour market downturn. Source: Statistics Canada, Labour Force Survey and Longitudinal Worker File. |
||||
Percentage of permanently laid-off workers whose real earnings 5 years after job loss are at least 25% lower than in the year prior to job loss, 1979 to 2011
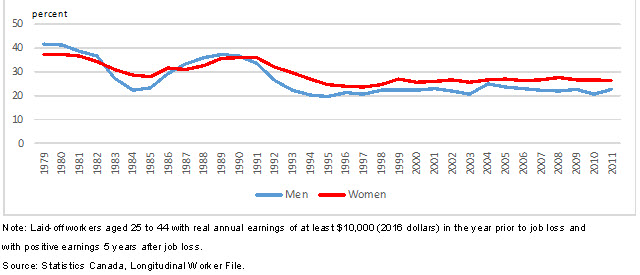
Description - Percentage of permanently laid-off workers whose real earnings 5 years after job loss are at least 25% lower than in the year prior to job loss, 1979 to 2011
| Men | Women | |
|---|---|---|
| 1979 | 41.7 | 37.4 |
| 1980 | 41.4 | 37.3 |
| 1981 | 38.8 | 36.7 |
| 1982 | 36.6 | 34.4 |
| 1983 | 27.3 | 31.0 |
| 1984 | 22.3 | 28.7 |
| 1985 | 23.3 | 28.2 |
| 1986 | 29.3 | 31.7 |
| 1987 | 33.4 | 31.0 |
| 1988 | 36.1 | 32.8 |
| 1989 | 37.4 | 35.6 |
| 1990 | 36.6 | 36.1 |
| 1991 | 33.6 | 36.1 |
| 1992 | 26.4 | 32.2 |
| 1993 | 22.3 | 29.6 |
| 1994 | 20.4 | 27.2 |
| 1995 | 19.8 | 24.8 |
| 1996 | 21.3 | 24.0 |
| 1997 | 20.9 | 23.7 |
| 1998 | 22.3 | 24.9 |
| 1999 | 22.3 | 27.0 |
| 2000 | 22.3 | 25.8 |
| 2001 | 23.2 | 26.1 |
| 2002 | 22.1 | 26.8 |
| 2003 | 20.9 | 25.8 |
| 2004 | 25.2 | 26.7 |
| 2005 | 23.8 | 27.0 |
| 2006 | 23.1 | 26.5 |
| 2007 | 22.4 | 26.7 |
| 2008 | 22.2 | 27.6 |
| 2009 | 22.7 | 26.8 |
| 2010 | 20.7 | 26.6 |
| 2011 | 22.7 | 26.4 |
| Note: Laid-off workers aged 25 to 44 with real annual earnings of at least $10,000 (2016 dollars) in the year prior to job loss and with positive earnings 5 years after job loss. Source: Statistics Canada, Longitudinal Worker File. |
||
Unequal impacts - Young workers entering the labour market will take an earnings hit
If this year's youth unemployment rate roughly matches the historical high at 19.0%, potential losses could range from about $8,000 to $15,000.
Cumulative five-year earnings loss after graduation due to economic downturn (Bachelor's degree graduates in 2020 by gender)

Description - Cumulative five-year earnings loss after graduation due to economic downturn (Bachelor's degree graduates in 2020 by gender)
| Youth unemployment rate in 2020 (percent) | Men | Women | Men | Women |
|---|---|---|---|---|
| earnings loss (2016 constant dollars) | earnings loss (percent) | |||
| 16 | -3,491 | -5,467 | -1.45 | -2.67 |
| 19 | -9,590 | -15,019 | -3.98 | -7.32 |
| 22 | -15,689 | -24,570 | -6.52 | -11.98 |
| 25 | -21,788 | -34,122 | -9.05 | -16.64 |
| 28 | -27,887 | -43,674 | -11.58 | -21.30 |
| Note: Shown are the cumulative earnings loss in dollars and percent over the first five years following graduation under different scenarios of the youth unemployment in 2020, compared to historial average earnings in first five years following graduation. Source:Statistics Canada, Census of Population and Labour Force Survey. |
||||
Unequal impacts - Lower wage growth, more job displacement, increases in teleworking and automation?
From 2000 to 2018, between 10% and 14% of employees worked at home.
Estimates suggest that between 30% and 50% of workers might have worked from home at the end of March 2020.
The density of industrial robots in Canada increased by 49.5% between 2010 and 2015.
Median real hourly wages of full-time employees aged 17 to 64, 1981 to 2019 (1981:100)

Description - Median real hourly wages of full-time employees aged 17 to 64, 1981 to 2019 (1981:100)
| 2019 dollars indexed | |
|---|---|
| 1981 | 100.0 |
| 101.0 | |
| 102.0 | |
| 1984 | 103.0 |
| 102.0 | |
| 1986 | 101.0 |
| 1987 | 101.6 |
| 1988 | 104.2 |
| 1989 | 102.2 |
| 1990 | 102.6 |
| 102.6 | |
| 102.6 | |
| 102.7 | |
| 102.7 | |
| 102.7 | |
| 102.7 | |
| 1997 | 102.7 |
| 1998 | 104.0 |
| 1999 | 103.4 |
| 2000 | 103.8 |
| 2001 | 105.7 |
| 2002 | 105.2 |
| 2003 | 104.2 |
| 2004 | 105.1 |
| 2005 | 104.1 |
| 2006 | 105.9 |
| 2007 | 106.7 |
| 2008 | 108.5 |
| 2009 | 110.9 |
| 2010 | 111.5 |
| 2011 | 110.6 |
| 2012 | 111.9 |
| 2013 | 114.0 |
| 2014 | 113.7 |
| 2015 | 117.3 |
| 2016 | 115.8 |
| 2017 | 115.6 |
| 2018 | 116.0 |
| 2019 | 117.6 |
| Source(s): Statistics Canada, 1981 Survey of Work History, 1984 Survey of Union Membership, 1986 to 1990 Labour Market Activity Survey, 1997 to 2019 Labour Force Survey. | |
Temporary and permanent layoff rates for employees aged 15 to 64, 1976 to 2019 (LFS)

Description - Temporary and permanent layoff rates for employees aged 15 to 64, 1976 to 2019 (LFS)
| Both Sexes | Men | Women | |
|---|---|---|---|
| 1976 | 2.23 | 2.17 | 2.32 |
| 1977 | 2.41 | 2.37 | 2.47 |
| 1978 | 2.32 | 2.26 | 2.42 |
| 1979 | 2.20 | 2.13 | 2.30 |
| 1980 | 2.35 | 2.31 | 2.41 |
| 1981 | 2.58 | 2.62 | 2.53 |
| 1982 | 3.56 | 3.81 | 3.23 |
| 1983 | 3.16 | 3.35 | 2.92 |
| 1984 | 2.92 | 3.10 | 2.70 |
| 1985 | 2.78 | 2.86 | 2.69 |
| 1986 | 2.68 | 2.76 | 2.59 |
| 1987 | 2.48 | 2.51 | 2.43 |
| 1988 | 2.34 | 2.39 | 2.28 |
| 1989 | 2.32 | 2.40 | 2.24 |
| 1990 | 2.62 | 2.83 | 2.38 |
| 1991 | 2.91 | 3.22 | 2.57 |
| 1992 | 2.96 | 3.29 | 2.60 |
| 1993 | 2.88 | 3.11 | 2.62 |
| 1994 | 2.59 | 2.76 | 2.40 |
| 1995 | 2.69 | 2.89 | 2.46 |
| 1996 | 2.63 | 2.86 | 2.39 |
| 1997 | 2.31 | 2.52 | 2.08 |
| 1998 | 2.27 | 2.51 | 2.01 |
| 1999 | 2.11 | 2.26 | 1.95 |
| 2000 | 1.95 | 2.08 | 1.80 |
| 2001 | 2.12 | 2.37 | 1.85 |
| 2002 | 2.08 | 2.30 | 1.86 |
| 2003 | 2.07 | 2.26 | 1.87 |
| 2004 | 1.98 | 2.15 | 1.80 |
| 2005 | 1.89 | 2.07 | 1.70 |
| 2006 | 1.87 | 2.07 | 1.67 |
| 2007 | 1.88 | 2.07 | 1.69 |
| 2008 | 2.06 | 2.32 | 1.79 |
| 2009 | 2.28 | 2.72 | 1.85 |
| 2010 | 1.93 | 2.19 | 1.68 |
| 2011 | 1.88 | 2.12 | 1.64 |
| 2012 | 1.86 | 2.05 | 1.66 |
| 2013 | 1.79 | 2.01 | 1.57 |
| 2014 | 1.73 | 1.92 | 1.53 |
| 2015 | 1.77 | 1.99 | 1.54 |
| 2016 | 1.66 | 1.88 | 1.43 |
| 2017 | 1.56 | 1.68 | 1.43 |
| 2018 | 1.46 | 1.56 | 1.35 |
| 2019 | 1.51 | 1.69 | 1.33 |
| Sources: Statistics Canada, Labour Force Survey. | |||
Potential impacts of COVID-19:
- Teleworking - The growth in telework will likely persist and may contribute to gender equality in the labour market.
- Automation - To manage future risks of pandemic, firms might not only increase their capacity to do telework: they might also choose to speed up the automation of certain tasks - This may impact predominantly less educated workers.
Percentage of workers facing a high risk of job transformation due to automation

Description - Percentage of workers facing a high risk of job transformation due to automation
| Percent | |||
|---|---|---|---|
| Master's degree | 1.3 | ||
| First professional degree | 6.1 | ||
| Bachelor's degree | 3.6 | ||
| College or CEGEP certificate or diploma | 9.9 | ||
| All levels | 10.6 | ||
| Trade or apprenticeship certificate | 15.4 | ||
| High school diploma or equivalent | 24.1 | ||
| No certificate, diploma or degree | 33.4 | ||
| Source(s): Longitudinal and International Study of Adults (LISA), Wave 3 (2016). | |||
Economic impacts - Business uncertainty in the recovery phase
Business uncertainty - Steep challenges facing many firms
- Uncertain business conditions will likely persist for an extended period as debt-deferrals, wage supports and preferential access to financing begin to wind down. As of May 2020, nearly one quarter of businesses with rent or mortgage payments have been granted deferrals.
- Many businesses will be reluctant to invest in the near term as they focus on their protecting their balance sheets and debt-servicing. Private-sector capital intentions, based on data collected by Statistics Canada in June and July, point to a 17% annual decrease in private sector capital spending in 2020, with substantial pull-backs across many sectors.
- Small service-based companies were disproportionately impacted by the pandemic. According to the Canadian Federation of Independent Business, "three quarters of small businesses have taken on debt as a result of COVID-19 and a majority of those with debt (68 per cent) estimate it will take more than a year to pay off".
Business uncertainty - Prior to the pandemic, firm creation was on a upswing and the financial position of firms was improving
Since 2015, the number of active firms has increased. In the last two years, the economy added an average of 16,500 firms each quarter.
The potential rates of business failures, especially among small firms, that may occur in the wake of the shutdowns dwarf the entry and exit rates observed over the last two decades.
Small firms (with less than 100 employees) account for about 45% of GDP.
Share of GDP
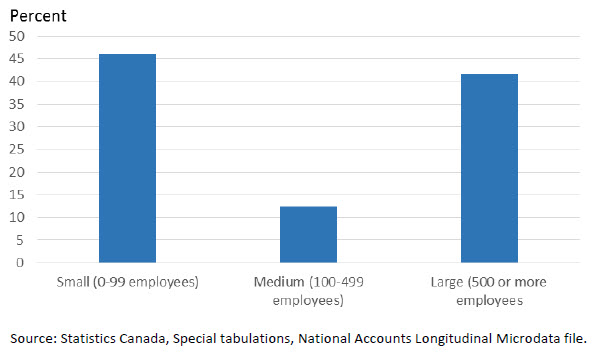
Description - Share of GDP
| percent | |
|---|---|
| Large (500 or more employees) | 45.14 |
| Medium (100-499 employees) | 13.17 |
| Small (0-99 employees) | 41.69 |
| Source: Statistics Canada, Special tabulations, National Accounts Longitudinal Microdata file | |
Since mid-2015, the debt to equity ratio for larger firms has been declining, indicating lower debt and interest expenses.
Private non-financial corporations, total debt to equity

Description - Private non-financial corporations, total debt to equity
| Percent | |||
|---|---|---|---|
| 2007 | 169.75 | ||
| 169.91 | |||
| 167.13 | |||
| 169.74 | |||
| 2008 | 175.17 | ||
| 174.04 | |||
| 194.51 | |||
| 217.17 | |||
| 2009 | 224.94 | ||
| 205.15 | |||
| 193.04 | |||
| 185.88 | |||
| 2010 | 188.14 | ||
| 192.75 | |||
| 186.43 | |||
| 179.46 | |||
| 2011 | 180.01 | ||
| 184.93 | |||
| 195.01 | |||
| 190.62 | |||
| 2012 | 188.74 | ||
| 191.63 | |||
| 189.36 | |||
| 187.85 | |||
| 2013 | 191.65 | ||
| 195.14 | |||
| 192.55 | |||
| 187.84 | |||
| 2014 | 186.23 | ||
| 183.26 | |||
| 186.89 | |||
| 191.25 | |||
| 2015 | 188.66 | ||
| 193.72 | |||
| 201.4 | |||
| 200.69 | |||
| 2016 | 196.88 | ||
| 193.9 | |||
| 194.97 | |||
| 192.83 | |||
| 2017 | 192.04 | ||
| 192.95 | |||
| 191.91 | |||
| 188.59 | |||
| 2018 | 191.32 | ||
| 187.93 | |||
| 186.72 | |||
| 192.58 | |||
| 2019 | 187.51 | ||
| 188.54 | |||
| 190.33 | |||
| 188.59 | |||
| 2020 | 213.24 | ||
| 199.74 | |||
| Source: Statistics Canada, table 38-10-0236-01. | |||
Business uncertainty - Closures rose dramatically during the shutdowns as employees left payrolls
Closures are businesses that did not have payroll employment in the current month, but did have payroll employment in the previous month.
- Business closures more than doubled to 88,000 in April, led by closures in construction, retail trade and accommodation and food services.
- 62,600 business closures were observed in May, 29% less than in April but still 59% higher than pre-COVID-19 levels observed in February.
Business sector, openings and closings

Description - Business sector, openings and closings
| Openings | Closures | |
|---|---|---|
| Jan-15 | 40,238 | 31,174 |
| Feb-15 | 39,723 | 35,613 |
| Mar-15 | 35,809 | 32,798 |
| Apr-15 | 38,593 | 37,444 |
| May-15 | 39,603 | 34,224 |
| Jun-15 | 28,382 | 35,601 |
| Jul-15 | 41,887 | 36,725 |
| Aug-15 | 37,629 | 35,643 |
| Sep-15 | 31,280 | 35,032 |
| Oct-15 | 38,848 | 37,302 |
| Nov-15 | 41,439 | 36,596 |
| Dec-15 | 33,579 | 36,581 |
| Jan-16 | 39,902 | 34,422 |
| Feb-16 | 37,528 | 45,678 |
| Mar-16 | 38,029 | 37,877 |
| Apr-16 | 39,968 | 37,010 |
| May-16 | 37,894 | 36,716 |
| Jun-16 | 30,094 | 34,396 |
| Jul-16 | 42,999 | 41,910 |
| Aug-16 | 38,142 | 38,385 |
| Sep-16 | 35,071 | 36,579 |
| Oct-16 | 38,994 | 38,733 |
| Nov-16 | 43,735 | 39,925 |
| Dec-16 | 38,966 | 37,525 |
| Jan-17 | 37,172 | 39,036 |
| Feb-17 | 38,332 | 34,832 |
| Mar-17 | 38,929 | 42,476 |
| Apr-17 | 38,646 | 37,406 |
| May-17 | 38,867 | 34,004 |
| Jun-17 | 36,927 | 36,771 |
| Jul-17 | 35,925 | 38,800 |
| Aug-17 | 39,399 | 38,172 |
| Sep-17 | 41,420 | 39,303 |
| Oct-17 | 36,466 | 38,390 |
| Nov-17 | 36,157 | 31,767 |
| Dec-17 | 37,470 | 38,757 |
| Jan-18 | 37,020 | 38,986 |
| Feb-18 | 38,983 | 37,310 |
| Mar-18 | 41,766 | 39,658 |
| Apr-18 | 37,957 | 37,453 |
| May-18 | 36,393 | 39,091 |
| Jun-18 | 41,517 | 37,944 |
| Jul-18 | 37,480 | 36,691 |
| Aug-18 | 38,755 | 43,234 |
| Sep-18 | 41,078 | 39,271 |
| Oct-18 | 39,413 | 38,616 |
| Nov-18 | 50,149 | 49,462 |
| Dec-18 | 38,899 | 39,663 |
| Jan-19 | 38,586 | 39,887 |
| Feb-19 | 40,137 | 40,186 |
| Mar-19 | 42,409 | 37,699 |
| Apr-19 | 39,358 | 38,978 |
| May-19 | 39,321 | 38,796 |
| Jun-19 | 39,601 | 39,760 |
| Jul-19 | 39,617 | 37,784 |
| Aug-19 | 37,062 | 38,097 |
| Sep-19 | 37,783 | 38,608 |
| Oct-19 | 37,545 | 37,671 |
| Nov-19 | 37,827 | 37,492 |
| Dec-19 | 38,697 | 38,307 |
| Jan-20 | 37,676 | 39,190 |
| Feb-20 | 35,652 | 39,321 |
| Mar-20 | 33,505 | 59,220 |
| Apr-20 | 35,597 | 87,998 |
| May-20 | 37,724 | 62,560 |
| Source: Statistics Canada table 33-10-0270-01. | ||
Business uncertainty - Historic declines in the number of active firms
- The number of active firms fell sharply on a year-over-year basis in April (-10.4%) and May (-13.5%).
- The pace of the job recovery will depend in large part on the extent to which many affected companies, especially small service-providing firms, can remain viable over the coming months.
- Uncertain consumer demand for non-essential discretionary items, in light of heightened income uncertainty and concerns over safety, may limit the recovery for many businesses.
Business sector, change in the number of active firms, year-over-year

Description - Business sector, change in the number of active firms, year-over-year
| Business sector, active firms | |
|---|---|
| 2016 | 18,392 |
| 6,318 | |
| 3,529 | |
| 5,401 | |
| 1,158 | |
| 3,928 | |
| -87 | |
| -2,199 | |
| 84 | |
| -1,082 | |
| -1,611 | |
| 2,898 | |
| 2017 | -5,625 |
| 6,307 | |
| 2,525 | |
| 796 | |
| 4,407 | |
| 8,722 | |
| 4,970 | |
| 6,763 | |
| 10,204 | |
| 8,410 | |
| 9,774 | |
| 7,100 | |
| 2018 | 5,661 |
| 4,035 | |
| 9,350 | |
| 8,494 | |
| 1,130 | |
| 4,195 | |
| 8,141 | |
| 2,774 | |
| 2,259 | |
| 5,398 | |
| 2,519 | |
| 3,155 | |
| 2019 | 2,892 |
| 1,224 | |
| 3,224 | |
| 2,813 | |
| 6,266 | |
| 2,234 | |
| 3,568 | |
| 7,341 | |
| 4,603 | |
| 3,964 | |
| 4,397 | |
| 5,513 | |
| 2020 | 4,922 |
| 1,142 | |
| -29,857 | |
| -82,953 | |
| -107,824 | |
| Source: Statistics Canada table 33-10-0270-01. | |
The number of active firms expanded as economic growth accelerated in 2017.
There were 100,000 fewer active businesses in May 2020 than in May 2019.
Over half of these losses were in accomodation and food services, other business services (including personal services), construction, and retail trade.
Business uncertainty - Operating costs and weak demand cloud the outlook for many affected businesses
- According to the Survey on Business Conditions (SBC) for reference month May, over 50% of businesses in accommodation and food services with mortgage or rent payments have had their payments deferred.
- This compares to less than one-quarter of construction and retail businesses.
- Of businesses with mortgage or rent payments, 24% of small companies have had payments deferred as have 34% of new companies (those two years old or newer).
- The SBC also found that 8% of companies could continue to operate for less than three months at current revenue and expenditure levels before having to consider further staffing action, closure or bankruptcy.
- Among businesses that provide food and accommodation, or arts, entertainment or recreation, the number was 18%.
- The risk of needing to consider staffing action, closure or bankruptcy in the near term was also slightly elevated for newer businesses and women-owned firms.
Business uncertainty - Firms sharply downgrade capital spending plans and focus on protecting balance sheets
- Businesses across most sectors of the economy revised their spending plans in light of heightened uncertainty.
- As of May, about 1 and 6 businesses has had mortgage or rental payments deferred.
Private sector capital spending

Description - Private sector capital spending
| 2014 (billions of dollars) | 2015 (billions of dollars) | 2016 (billions of dollars) | 2017 (billions of dollars) | 2018 (billions of dollars) | 2019 (billions of dollars) | 2020 (billions of dollars) | |
|---|---|---|---|---|---|---|---|
| Pre-COVID 2020 intentions | 199 | 173 | 154 | 156 | 172 | 176 | 178 |
| Post-COVID 2020 intentions | 199 | 173 | 154 | 156 | 172 | 176 | 147 |
| Source: Statistics Canada table 34-10-0037. | |||||||
2020 private capital intentions prior to COVID-19 ($178 billion)
2020 private capital intentions after COVID-19 ($147 billion)
| Percent change from 2019 levels | |
|---|---|
| All industries | -9.5 |
| Private sector | -16.6 |
| Public sector | 4.2 |
| Mining and oil and gas extraction | -27.2 |
| Manufacturing | -18.5 |
| Construction | -10.1 |
| Accommodation and food | -39.2 |
| Retail | -11.9 |
| Real estate and rental | -27.0 |
| Source: Statistics Canada table 34-10-0037. | |
Business uncertainty - The recovery in Canadian trade may be influenced by the spread of COVID-19 in U.S. States that are key trading partners
Total trade in 2019 with key states, billions of dollars, COVID-19 cases per 100,000

Description - Total trade in 2019 with key states, billions of dollars, COVID-19 cases per 100,000
| 2019 Total Trade | Cases per 100,000 | |
|---|---|---|
| Michigan | 90,923,966,000 | 1,078 |
| Illinois | 71,587,894,000 | 1,752 |
| Texas | 56,340,917,000 | 2,022 |
| California | 52,096,093,000 | 1,690 |
| New York | 43,914,909,000 | 2,218 |
| Source(s): Statistics Canada, table 12-10-0099-01, U.S. Center for Disease Control. | ||
Economic impacts - Structural challenges in heavily affected sectors
Structural impacts - Severe implications for transportation and tourism

- The transportation system provides a key foundation for the Canadian economy; with truckers and transport equipment operators the largest occupational group in the country.
- The transportation and warehousing sector employs roughly one million Canadians - many of these jobs are at risk as the movement of people and goods dwindles.

- In 2019, Canada welcomed 22.1 million tourists from abroad (excluding U.S. day trips) – These foreign travellers spent over $22.0 billion while visiting Canada with overseas visitors averaging $1,640 per trip in 2018.
- About half of all the employment generated through tourism is in accommodation and food services.
Structural challenges in heavily impacted sectors - transportation
Disruptions to the Canadian airline industry are unprecedented

Description - Disruptions to the Canadian airline industry
Disruptions to the Canadian airline industry
The title of the infographic is "Disruptions to the Canadian airline industry"
In brackets underneath the title it says "Percentages indicate year-over-year changes."
The first subheading is "2001 – September 11 events in the United States". The description under this subheading says "A sudden 26% drop in passengers followed by a gradual recovery."
There are five blue arrows in a row pointing to the right. Each arrow contains one month with the year-over-year percentage change for that month. The first arrow is for the month of September and the change is minus 26.0%. The second arrow is for the month of October and the change is minus 18.4%. The third arrow is for the month of November and the change is minus 9.6%. The fourth arrow is for the month of December and the change is minus 3.4%. The fifth arrow is for the month of January 2002 and the change is minus 1.3%.
The second subheading is "2003 – SARS (severe acute respiratory syndrome) outbreak." The description under this subheading says "A gradual decline in passengers, reaching a 26% decrease in May, followed by a gradual recovery."
There are five green arrows in a row pointing to the right. Each arrow contains one month with the year-over-year percentage change for that month. The first arrow is for the month of February and the change is minus 10.1%. The second arrow is for the month of March and the change is minus 12.7%. The third arrow is for the month of April and the change is minus 25.2%.The fourth arrow is for the month of May and the change is minus 26.0%. The fifth arrow is for the month of June and the change is minus 17.1%.
The third subheading is "2020 – COVID-19 pandemic." The description under this subheading says "A steep decline, falling to 97% fewer passengers than the previous year."
There are four red arrows in a row pointing to the right. Each arrow contains one month with the year-over-year percentage change for that month. The first arrow is for the month of March and the change is minus 44.1%. The second arrow is for the month of April and the change is minus 97.0%. The third arrow is for the month of May and the change is minus 96.7%. The fourth arrow is for the month of June and the change is minus 93.9%.
Source(s): Monthly Civil Aviation Survey (5026), table 23-10-0079-01.
Because of weaker demand for energy and autos, Canadian railways were hauling few tonnes of freight

Description - Because of weaker demand for energy and autos, Canadian railways were hauling few tonnes of freight
| March | April | May | June | |
|---|---|---|---|---|
| 2019 | 31,746,377 | 33,344,944 | 34,705,350 | 33,201,400 |
| 2020 | 33,398,609 | 30,023,466 | 30,072,833 | 29,800,000 |
| Source: Statistics Canada, table 23-10-0216-01. | ||||
Severe declines in public transit as workers adjust to the new normal

Description - Severe declines in public transit as workers adjust to the new normal
| 2019 | 2020 | |
|---|---|---|
| Jan | 159 | 163.4 |
| Feb | 153.5 | 160.9 |
| Mar | 163.5 | 94.8 |
| Apr | 156.5 | 23.4 |
| May | 152.7 | 26.2 |
| Jun | 149.5 | 37.9 |
| Source: Statistics Canada, table 23-10-0521-01. | ||
Structural challenges in heavily affected sectors – commercial real estate
- Commercial rents fell 3.1% in the second quarter of 2020, after edging down 0.2% in the first.
- Declines in Q2 were widespread across building types and reflected lower commercial rents in every province and territory.
- As of the end of the second quarter, a small percentage of commercial property owners indicated that they applied for the Canada Emergency Commercial Rent Assistance (CECRA) program on behalf of their tenants.
The pandemic pulled down commercial rents across Canada

Description - The pandemic pulled down commercial rents across Canada
| Q1 2019 | Q2 2019 | Q3 2019 | Q4 2019 | Q1 2020 | Q2 2020 | |
|---|---|---|---|---|---|---|
| Office buildings | 99.9 | 99.4 | 100.1 | 100.6 | 100.5 | 97.4 |
| Retail buildings | 99.4 | 99.4 | 100.3 | 100.9 | 99.9 | 96.9 |
| Industrial buildings and warehouses | 98.9 | 99.8 | 100.4 | 100.9 | 101.4 | 98.2 |
| Source: Statistics Canada, table 18-10-0260-01. | ||||||
The long-term outlook of the commercial real estate market remains in flux as building tenants assess their future office space needs as large numbers of corporate employees continue to work from home . This could put further downward pressure on new office building lease rates.
Structural challenges in heavily affected sectors – retail trade
The retail sector rebounded quickly from storefront closures as companies developed or enhanced their on-line platforms . By June, the volume of retail activity had surpassed pre-COVID levels, while payroll employment in retail industries was 15% below levels in February.
Retail e-commerce sales soar to all-time high

Description - Retail e-commerce sales soar to an all-time high
| E-commerce | In-store | |
|---|---|---|
| 2016 | 100 | 100 |
| 110.8 | 99.5 | |
| 105.1 | 96 | |
| 105.8 | 100.1 | |
| 104.3 | 93.6 | |
| 105.6 | 96.9 | |
| 107.8 | 97.6 | |
| 111.1 | 96.4 | |
| 120 | 99.3 | |
| 115.6 | 99.4 | |
| 117.9 | 98.9 | |
| 165 | 103 | |
| 2017 | 140.9 | 103 |
| 136.5 | 103.1 | |
| 142.8 | 103.1 | |
| 150.8 | 105.1 | |
| 147 | 103.2 | |
| 147.8 | 105 | |
| 152.9 | 104.9 | |
| 152.5 | 105 | |
| 151.9 | 105 | |
| 156.1 | 106.9 | |
| 169.7 | 105.7 | |
| 165.7 | 106.5 | |
| 2018 | 165.7 | 105.2 |
| 159.2 | 105.5 | |
| 163.8 | 107.3 | |
| 167.6 | 104.5 | |
| 174.2 | 107.9 | |
| 178.6 | 108.1 | |
| 167.9 | 105.9 | |
| 180.5 | 107.8 | |
| 172 | 108.4 | |
| 188 | 108.4 | |
| 207.4 | 107.5 | |
| 177.8 | 108.1 | |
| 2019 | 189.1 | 107.9 |
| 188.7 | 107.5 | |
| 204 | 108.9 | |
| 203.4 | 107.7 | |
| 217.7 | 108.4 | |
| 232.5 | 107.7 | |
| 225.8 | 108.8 | |
| 223.6 | 109.9 | |
| 228 | 107.6 | |
| 217.7 | 108.4 | |
| 220.2 | 108.9 | |
| 244.5 | 108.3 | |
| 2020 | 213.6 | 110.2 |
| 230.2 | 111.4 | |
| 273.8 | 97.8 | |
| 448.6 | 73 | |
| 459 | 85.9 | |
| Source: Statistics Canada, Census of Population of 2016. | ||
E-commerce sales increased more among non-essential retailers

Description - E-commerce sales increase more among non-essential retailers
| In-store | E-commerce | |
|---|---|---|
| Retail trade | -34.5 | 94.8 |
| Furniture and home furnishings stores | -69.6 | 191.2 |
| General merchandise stores | -15.1 | 170.1 |
| Sporting goods, hobby, book and music stores | -79 | 154.9 |
| Food and beverage stores | 3.3 | 107 |
| Clothing and clothing accessories stores | -84.2 | 83.3 |
| Health and personal care stores | -16.1 | 55.6 |
| Building material and garden equipment and supplies dealers | -15.8 | 40.5 |
| Source: Statistics Canada, Monthly Retail Trade Survey. | ||
From February to May 2020, total retail sales fell by 18% while retail e-commerce sales doubled.
Economic impacts - Investing in resilience and growth
Investing in resilience and growth - Digitalization a driver of structural change in the economy
Employment growth in the digital economy and in clean technology and environmental production has outpaced even high growth areas in the service sector.
Digitally intensive industries have higher rates of innovation and more high growth firms than other sectors.
Employment growth in selected sectors since the 2008-2009 recession

Description - Employment growth in selected sectors since the 2008-2009 recession
| 2010 | 2011 | 2012 | 2013 | 2014 | 2015 | 2016 | 2017 | 2018 | 2019 | |
|---|---|---|---|---|---|---|---|---|---|---|
| All industries | 100 | 102 | 103 | 105 | 106 | 107 | 108 | 110 | 113 | 115 |
| Clean technology and environment | 100 | 105 | 107 | 110 | 112 | 119 | 118 | 123 | 125 | |
| Digital economy | 100 | 103 | 105 | 118 | 121 | 125 | 132 | 137 | ||
| Knowledge-based industries | 100 | 103 | 106 | 107 | 109 | 110 | 110 | 114 | 119 | 123 |
| Health care and social assistance | 100 | 101 | 103 | 105 | 107 | 109 | 112 | 114 | 117 | 121 |
| Source(s): Statistics Canada, special tabulations, "Measuring digital economic activities in Canada: Initial estimates"; Environmental and Clean Technology Products Economic Account; and Survey of Employment, Payrolls and Hours. | ||||||||||
Percentage of innovative enterprises, 2017

Description - Percentage of innovative enterprises, 2017
| Percent | |
|---|---|
| Digitally intensive industries | 81.6 |
| Other industries | 78.5 |
| Source: Special tabulations, Survey of Innovation and Business Strategy | |
Percentage of High-Growth Firms by Industry

Description - Percentage of high-growth firms, by industry
| Percent | |
|---|---|
| Digital Industries | 18.58% |
| Information & cultural industries | 11.87% |
| Agriculture, forestry, fishing & hunting | 11.17% |
| Mining, quarrying, oil & gas extraction & utilities | 10.06% |
| Finance, insurance, real estate, rental & leasing | 9.44% |
| Construction | 9.33% |
| Manufacturing | 9.07% |
| Administrative, support, waste management & remediation | 8.98% |
| Professional, scientific & technical | 7.96% |
| Wholesale trade | 7.23% |
| Transportation & warehousing | 6.84% |
| Arts, entertainment, recreation, accommodation & food | 6.71% |
| Retail trade | 6.20% |
| Other services (except public admin.) | 5.49% |
| Source: Statistics Canada, special tabulation, National Accounts Longitudinal Microdata File. | |
Investing in resilience and growth - Digitalization accelerated during the pandemic
- The share of businesses with at least 10% of their workforce teleworking doubled from February to May 2020, from 16.6% to 32.6%.
- Over one-fifth of businesses (22.5%) expect at least 10% of their workforce to continue teleworking after the pandemic.
Telework capacity, selected industries, 2019
Description - Telework capacity, selected industries, 2019
| Percent | |
|---|---|
| Accommodation, food services | 5.6 |
| Construction | 11.1 |
| Manufacturing | 19.1 |
| Retail trade | 22 |
| Transportation, warehousing | 24.5 |
| Health care, social assistance | 28.8 |
| Utilities | 38.6 |
| Arts, entertainment, recreation | 40.1 |
| Public administration | 58.2 |
| Information, cultural industries | 68.5 |
| Professional, scientific & technical services | 83.9 |
| Educational services | 84.6 |
| Finance, insurance | 85.3 |
| Source: Statistics Canada, Special Tabulations, Labour Force Survey, Occupational Information Network (O*NET). | |
Investing in resilience and growth - Risks and opportunities associated with digitalization in the workplace are unevenly distributed
Workers at the bottom of the earnings distribution have greater risk of job automation and less opportunity for telework.
Percent of workers at high-risk of automation-related job transformation, by percentile of employment income

Description - Percentage of workers at high-risk of automation-related job transformation, by percentile of employment income
| Percent | |
|---|---|
| Below 10 | 26.8 |
| 10-24 | 16.6 |
| 25-49 | 13.7 |
| 50-74 | 5.5 |
| 75-89 | 3.1 |
| 90 or above | 2.1 |
| Source(s): Statistics Canada, Labour Force Survey, 2019, and Longitudinal and International Study of Adults, 2016. | |
Percent of adults in jobs that can be done from home, by family earnings decline, dual-earner families, 2019

Description - Percentage of adults in jobs that can be done from home, by family earnings decile, dual-earner families, 2019
| Husbands | Wives | Both | |
|---|---|---|---|
| 1st (Lowest) | 18.7 | 28.6 | 8.1 |
| 2nd | 23.5 | 36.5 | 10.9 |
| 3rd | 27.3 | 45.1 | 14.7 |
| 4th | 28.3 | 49.9 | 16.3 |
| 5th | 33.8 | 55.8 | 21.7 |
| 6th | 38 | 57.1 | 24.6 |
| 7th | 40.5 | 63.2 | 27.6 |
| 8th | 50.7 | 65.9 | 36.9 |
| 9th | 53.1 | 66.9 | 39.1 |
| 10th (Highest) | 66.1 | 74.8 | 53.9 |
| Source: Statistics Canada, Special Tabulations, Labour Force Survey, Occupational Information Network (O*NET). | |||
Investing in resilience and growth - Environmental and clean technology (ECT) products and services
ECT products and services include clean electricity, clean-technology manufactured goods, scientific services, research and development services, construction services and support services. Examples include solar panels or the design and construction of energy-efficient buildings.
- ECT products and services account for 3.2% of GDP and just under 1.9% of Canadian exports and 2.6% of Canadian imports.
- Clean electricity production accounts for over 40% of GDP in this sector.
- ECT activity accounts for about 320,000 jobs.
Gross domestic product, ECT activities
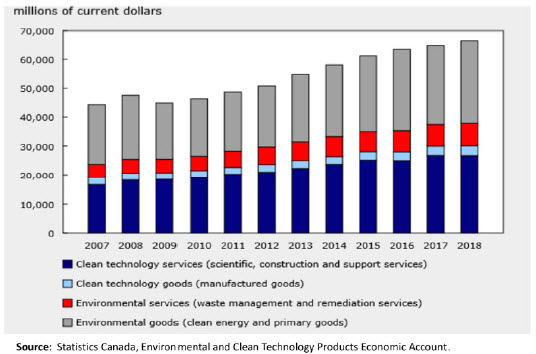
Description - Composition of national gross domestic product from environmental and clean technology products
Share of total jobs attributable to ECT activity

Description - Jobs attributed to environmental and clean technology products sector, 2018
Source: Statistics Canada, Environmental and Clean Technology Products Economic Account
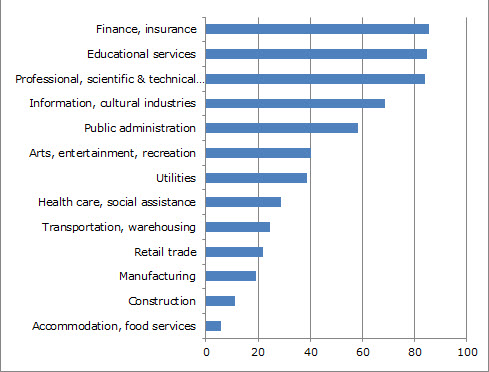
Investing in resilience and growth - Many environmental and clean technology (ECT) jobs are relatively high paying and high skilled
Average annual wages for ECT jobs were higher for than for non-ECT jobs across comparable educational levels.
Two-thirds of ECT jobs employ workers with some post-secondary education.
Engineering positions are relatively well represented in the ECT sector.
Share of total jobs attributable to ECT activity

Description - Portrait of environmental and clean technology jobs in Canada, 2017
- Date modified: