Information identified as archived is provided for reference, research or recordkeeping purposes. It is not subject to the Government of Canada Web Standards and has not been altered or updated since it was archived. Please "contact us" to request a format other than those available.
Above national annual Gross domestic product (GDP) growth for P.E.I. in the last 4 years
Description for chart 8 - Annual GDP growth, Canada and Atlantic provinces (percent)
Annual GDP growth, Canada and Atlantic provinces (percent)
2016
2017
2018
Canada
1.1
3.2
2.0
Newfoundland and Labrador
1.7
0.9
-2.7
Prince Edward Island
1.7
3.4
2.6
Nova Scotia
1.5
1.5
1.2
New Brunswick
1.4
2.0
0.1
Source: Statistics Canada, Gross domestic product (GDP) at basic prices, by industry.
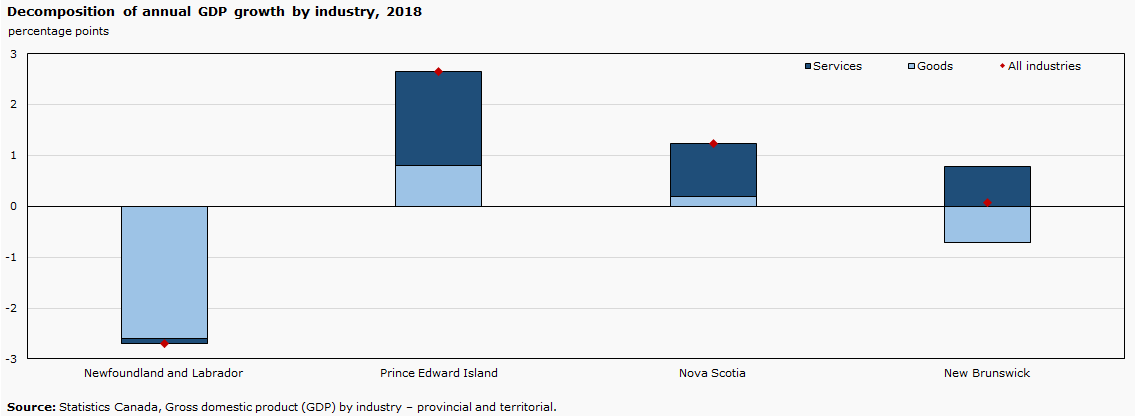
Recent Gross domestic product (GDP) growth in most Atlantic provinces driven by services-producing industries, while decline in Newfoundland and Labrador driven by goods-producing industries
In 2018, about 1 in 4 people in the Atlantic provinces worked in sales and service occupations.
Description for chart 9 - Decomposition of annual GDP growth by industry, 2018
Decomposition of annual GDP growth by industry, 2018
Newfoundland and Labrador
Prince Edward Island
Nova Scotia
New Brunswick
percentage points
All industries
-2.697
2.644
1.228
0.078
Goods
-2.598
0.805
0.197
-0.707
Services
-0.099
1.840
1.033
0.785
Source: Statistics Canada, Gross domestic product (GDP) by industry – provincial and territorial.
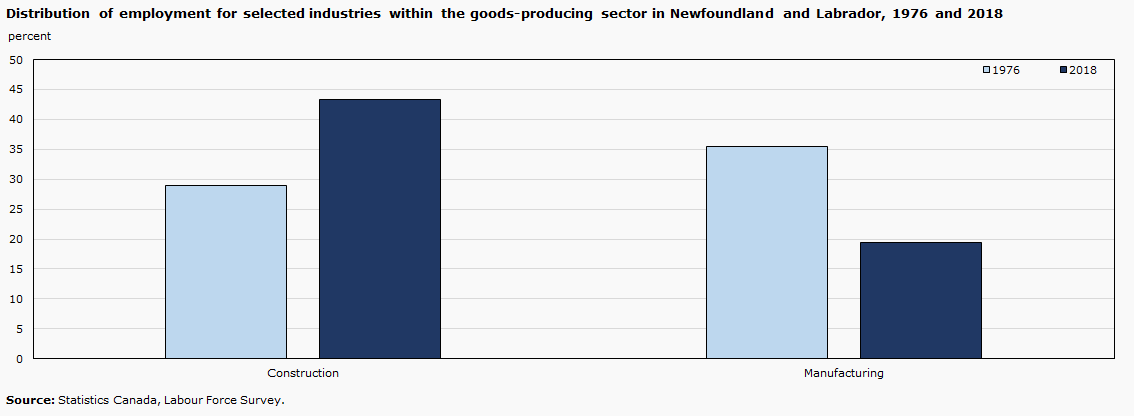
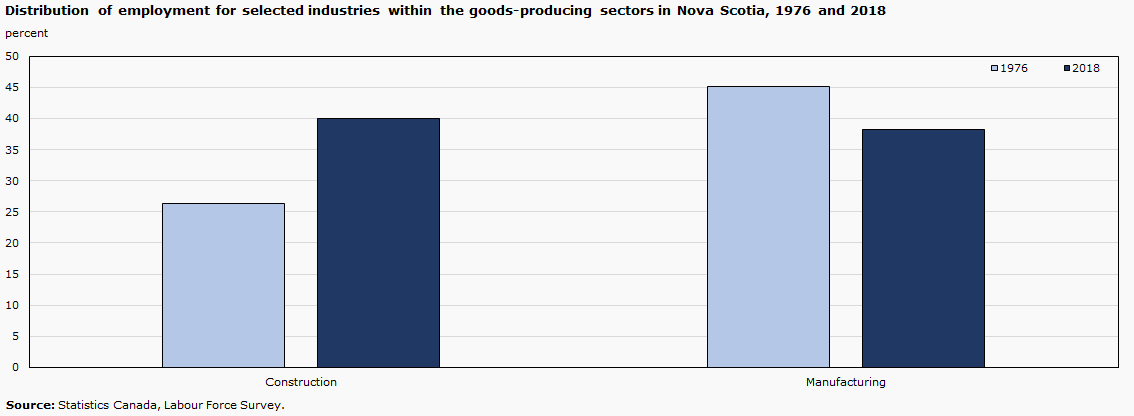
Distribution of employment within the goods-producing sector experienced trade-offs between 1976 and 2018 in most Atlantic provinces
Description for chart 10 - Distribution of employment for selected industries within the goods-producing sector in Newfoundland and Labrador, 1976 and 2018 (percent)
Distribution of employment for selected industries within the goods-producing sector in Newfoundland and Labrador, 1976 and 2018 (percent)
Construction
Manufacturing
1976
29.0
35.5
2018
43.4
19.4
Source: Statistics Canada, Labour Force Survey.
Description for chart 11 - Distribution of employment for selected industries within the goods-producing sectors in Prince Edward Island, 1976 and 2018 (percent)
Distribution of employment for selected industries within the goods-producing sectors in Prince Edward Island, 1976 and 2018 (percent)
Agriculture
Manufacturing
1976
40.4
19.9
2018
20.6
35.1
Source: Statistics Canada, Labour Force Survey.
Description for chart 12 - Distribution of employment for selected industries within the goods-producing sectors in Nova Scotia, 1976 and 2018 (percent)
Distribution of employment for selected industries within the goods-producing sectors in Nova Scotia, 1976 and 2018 (percent)
Construction
Manufacturing
1976
26.3
45.2
2018
40.0
38.3
Source: Statistics Canada, Labour Force Survey.
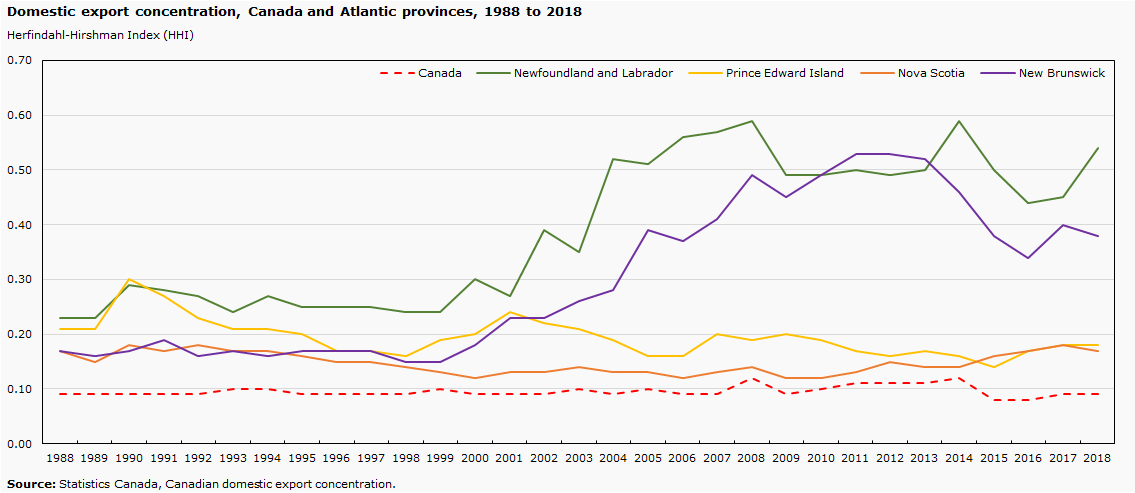
Exports from Newfoundland and Labrador and New Brunswick highly concentrated since the early 2000s
Description for chart 13 - Domestic export concentration, Canada and Atlantic provinces, 1988 to 2018 (Herfindahl-Hirshman Index (HHI))
Domestic export concentration, Canada and Atlantic provinces, 1988 to 2018 (Herfindahl-Hirshman Index (HHI))
Canada
New Brunswick
Newfoundland and Labrador
Nova Scotia
Prince Edward Island
1988
0.09
0.17
0.23
0.17
0.21
1989
0.09
0.16
0.23
0.15
0.21
1990
0.09
0.17
0.29
0.18
0.30
1991
0.09
0.19
0.28
0.17
0.27
1992
0.09
0.16
0.27
0.18
0.23
1993
0.10
0.17
0.24
0.17
0.21
1994
0.10
0.16
0.27
0.17
0.21
1995
0.09
0.17
0.25
0.16
0.20
1996
0.09
0.17
0.25
0.15
0.17
1997
0.09
0.17
0.25
0.15
0.17
1998
0.09
0.15
0.24
0.14
0.16
1999
0.10
0.15
0.24
0.13
0.19
2000
0.09
0.18
0.30
0.12
0.20
2001
0.09
0.23
0.27
0.13
0.24
2002
0.09
0.23
0.39
0.13
0.22
2003
0.10
0.26
0.35
0.14
0.21
2004
0.09
0.28
0.52
0.13
0.19
2005
0.10
0.39
0.51
0.13
0.16
2006
0.09
0.37
0.56
0.12
0.16
2007
0.09
0.41
0.57
0.13
0.20
2008
0.12
0.49
0.59
0.14
0.19
2009
0.09
0.45
0.49
0.12
0.20
2010
0.10
0.49
0.49
0.12
0.19
2011
0.11
0.53
0.50
0.13
0.17
2012
0.11
0.53
0.49
0.15
0.16
2013
0.11
0.52
0.50
0.14
0.17
2014
0.12
0.46
0.59
0.14
0.16
2015
0.08
0.38
0.50
0.16
0.14
2016
0.08
0.34
0.44
0.17
0.17
2017
0.09
0.40
0.45
0.18
0.18
2018
0.09
0.38
0.54
0.17
0.18
Source: Statistics Canada, Canadian domestic export concentration.
Recent trends in an evolving labour market
Vulnerability and quality of work
Wage growth in Canada is subject to regional and cyclical variations
In the 2000s wage growth was driven by the oil-sector…
Description for chart 14 - Indexed real hourly wage by region, employees aged 25 to 54, 2000-2018
Indexed real hourly wage by region, employees aged 25 to 54, 2000-2018
Oil producing provinces
Atlantic without Newfoundland and Labrador
Ontario
Other provinces
2000=100
2000
100.0
100.0
100.0
100.0
2001
102.3
101.1
100.4
100.7
2002
104.0
99.8
100.5
101.2
2003
101.4
100.2
99.3
101.4
2004
102.3
100.9
100.5
101.7
2005
106.1
100.3
101.2
101.8
2006
108.3
101.8
102.9
102.4
2007
109.4
105.1
104.3
104.0
2008
112.0
106.7
105.9
105.6
2009
116.3
111.3
107.5
109.2
2010
116.6
112.7
106.5
109.8
2011
116.6
109.7
105.9
108.0
2012
120.6
111.5
106.3
109.2
2013
122.6
112.5
107.2
110.5
2014
122.2
113.9
106.1
111.6
2015
124.9
116.2
108.1
113.6
2016
124.8
116.7
108.1
114.6
2017
125.0
117.3
107.5
116.2
2018
124.5
117.4
108.2
115.3
Source: Statistics Canada, Labour Force Survey.
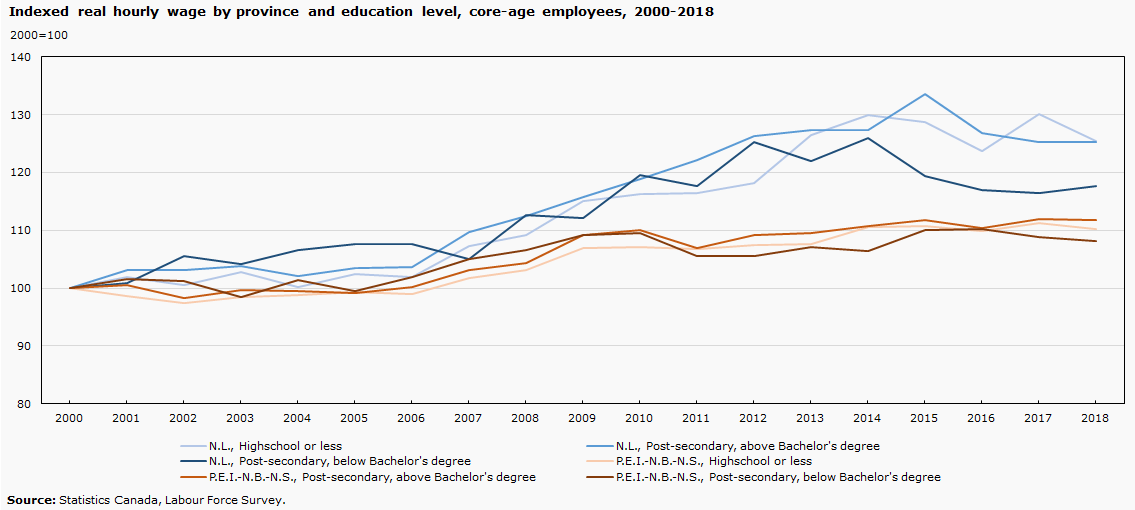
…and workers with higher levels of education were the most affected by downturn in the industry.
Description for chart 15 - Indexed real hourly wage by province and education level, core-age employees, 2000-2018
Indexed real hourly wage by province and education level, core-age employees, 2000-2018
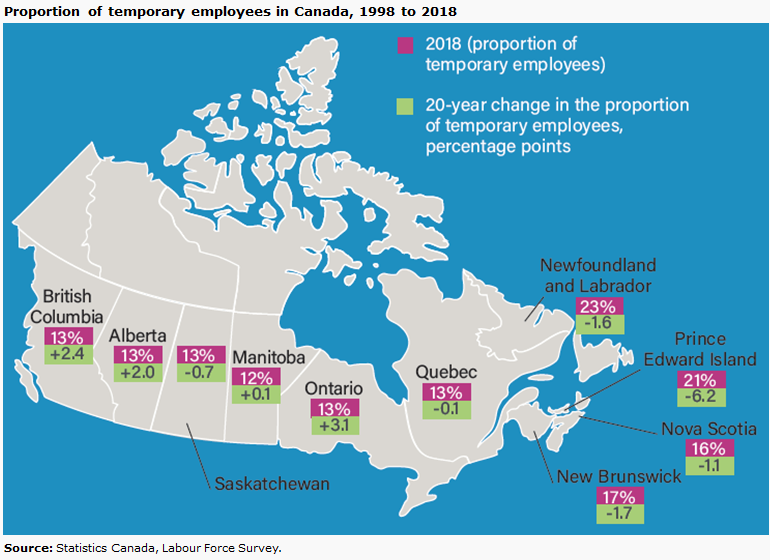
Temporary employment higher in the Atlantic provinces…
…but the share has declined over the years
Description for map 1 - Proportion of temporary employees in Canada, 1998-2018
Proportion of temporary employees in Canada, 1998-2018
Proportion of temporary employees in 2018 (percent)
20-year change in the proportion of temporary employees (percentage points)
Newfoundland and Labrador
23
-1.6
Prince Edward Island
21
-6.2
Nova Scotia
16
-1.1
New Brunswick
17
-1.7
Quebec
13
-0.1
Ontario
13
3.1
Manitoba
12
0.1
Saskatchewan
13
-0.7
Alberta
13
2.0
British Columbia
13
2.4
Source: Statistics Canada, Labour Force Survey.
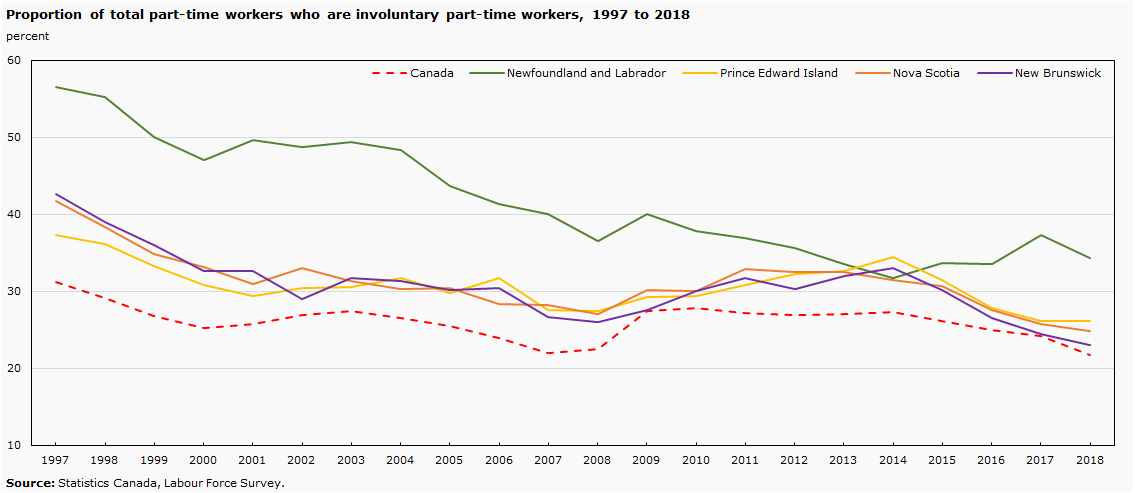
Involuntary part-time converging towards the national average, except in Newfoundland and Labrador
Description for chart 16 - Proportion of total part-time workers who are involuntary part-time workers, 1997 to 2018 (percent)
Proportion of total part-time workers who are involuntary part-time workers, 1997 to 2018 (percent)
Canada
Newfoundland and Labrador
Prince Edward Island
Nova Scotia
New Brunswick
1997
31.2
56.6
37.3
41.8
42.6
1998
29.2
55.3
36.2
38.4
39.0
1999
26.8
50.0
33.3
34.9
36.0
2000
25.3
47.1
30.8
33.2
32.7
2001
25.8
49.7
29.4
31.0
32.6
2002
26.9
48.8
30.5
33.1
29.0
2003
27.5
49.4
30.6
31.3
31.8
2004
26.6
48.3
31.8
30.3
31.3
2005
25.5
43.7
29.8
30.5
30.2
2006
23.9
41.4
31.8
28.4
30.4
2007
22.0
40.1
27.6
28.3
26.7
2008
22.5
36.5
27.4
27.1
26.0
2009
27.4
40.1
29.3
30.2
27.6
2010
27.8
37.9
29.4
30.0
30.0
2011
27.2
37.0
30.8
32.9
31.7
2012
27.0
35.6
32.3
32.5
30.3
2013
27.1
33.6
32.6
32.5
32.0
2014
27.3
31.8
34.5
31.5
33.0
2015
26.2
33.7
31.5
30.7
30.2
2016
25.0
33.5
27.9
27.6
26.5
2017
24.2
37.3
26.1
25.8
24.5
2018
21.8
34.3
26.1
24.8
23.0
Source: Statistics Canada, Labour Force Survey.
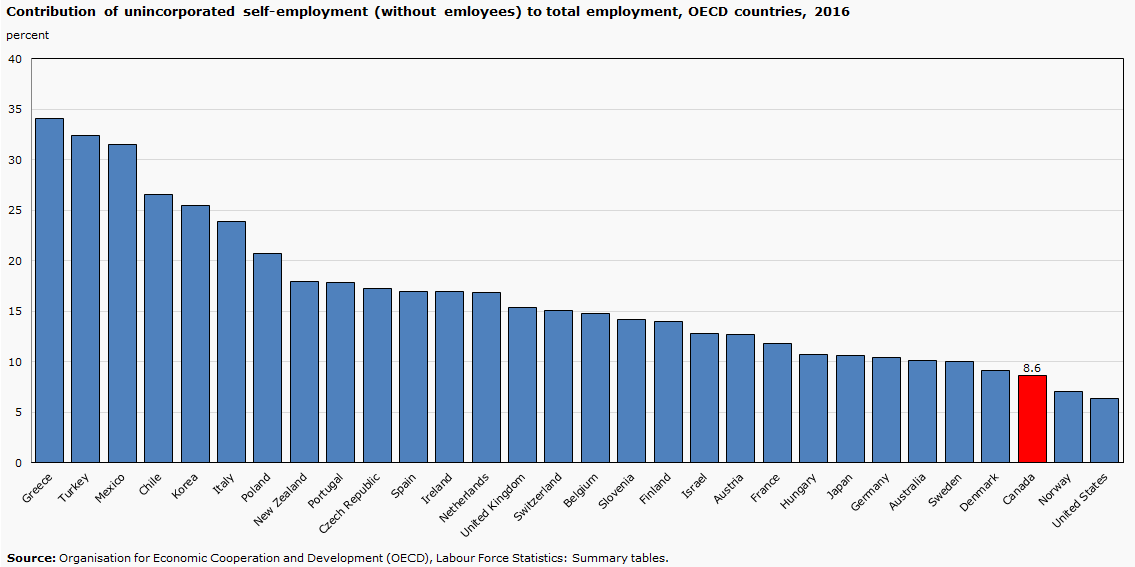
Forms of employment associated with the digital economy may increase precarity
STC is collaborating on the development of international standards and approaches to the measurement of new forms of employment and other aspects of an increasingly digital economy.
Work obtained via digital platforms —and performed either in-person or virtually — is a small but potentially fast-growing component of total employment in Canada.
This form of work may increase precarity by exposing self-employed workers to risks and dependencies without corresponding social protections.
In 2016, forms of employment which may be associated with gig employment were less common in Canada than in other OECD countries.
Description for chart 17 - Contribution of unincorporated self-employment (without emloyees) to total employment, OECD countries, 2016
Contribution of unincorporated self-employment (without emloyees) to total employment, OECD countries, 2016
percent
Greece
34.1
Turkey
32.4
Mexico
31.5
Chile
26.5
Korea
25.5
Italy
23.9
Poland
20.7
New Zealand
17.9
Portugal
17.8
Czech Republic
17.2
Spain
16.9
Ireland
16.9
Netherlands
16.8
United Kingdom
15.4
Switzerland
15.1
Belgium
14.8
Slovenia
14.2
Finland
14.0
Israel
12.8
Austria
12.7
France
11.8
Hungary
10.7
Japan
10.6
Germany
10.4
Australia
10.1
Sweden
10.0
Denmark
9.1
Canada
8.6
Norway
7.0
United States
6.4
Source: Organisation for Economic Cooperation and Development (OECD), Labour Force Statistics: Summary tables
Recent trends in an evolving labour market
Labour market dynamics.
Core-aged and older women account for most of the labour force increase in the Atlantic provinces between 1976 and 2018
Description for chart 18 - Labour force, by sex and age group, Atlantic provinces, 1976 to 2018 (thousands)
Labour force, by sex and age group, Atlantic provinces, 1976 to 2018 (thousands)
Men, 15 to 24 years
Men, 25 to 54 years
Men, 55 years and over
Women, 15 to 24 years
Women, 25 to 54 years
Women, 55 years and over
1976
139.2
320.6
68.0
105.6
159.4
25.7
1977
139.1
327.6
66.0
110.2
165.6
25.9
1978
139.9
336.2
65.0
114.4
181.2
26.0
1979
144.8
345.9
66.2
116.3
191.8
28.2
1980
141.2
353.5
64.6
117.5
206.3
25.9
1981
136.8
358.7
63.5
120.2
219.4
26.0
1982
129.7
363.4
62.9
115.9
227.3
27.1
1983
131.3
370.8
62.2
115.5
240.1
27.0
1984
131.0
379.6
61.5
115.8
254.3
28.1
1985
129.4
389.4
62.0
115.8
268.7
27.6
1986
126.8
398.1
59.8
116.1
284.1
26.2
1987
125.3
404.6
56.7
114.6
295.4
26.8
1988
121.6
414.6
58.7
112.6
311.8
26.7
1989
121.2
422.2
57.5
111.7
328.7
27.6
1990
118.0
430.3
56.7
108.2
344.7
28.3
1991
114.1
430.8
56.9
103.8
351.6
27.8
1992
109.2
427.2
54.7
101.4
355.1
27.1
1993
106.4
431.0
53.6
98.4
360.6
29.3
1994
105.2
434.0
54.2
95.3
361.4
30.7
1995
102.5
433.7
54.6
92.8
366.4
29.6
1996
99.4
432.4
55.2
90.3
370.2
30.3
1997
96.1
440.2
56.2
85.6
380.4
32.1
1998
95.9
443.3
57.8
88.0
385.5
36.1
1999
96.9
445.8
60.5
90.1
390.3
38.3
2000
95.4
443.5
63.5
91.5
397.9
38.8
2001
98.7
441.1
67.7
94.0
402.6
42.0
2002
99.6
442.0
73.2
96.4
409.2
48.9
2003
101.1
437.3
81.7
97.1
408.9
55.3
2004
100.3
436.9
89.0
97.0
411.5
62.9
2005
97.5
431.0
92.3
95.7
408.8
67.0
2006
97.2
421.7
96.9
94.9
409.5
70.7
2007
95.0
417.9
105.3
95.3
409.6
76.9
2008
97.4
417.1
112.8
96.2
407.0
85.2
2009
96.6
417.0
118.2
92.5
406.7
90.2
2010
95.0
416.2
126.3
90.4
407.2
98.0
2011
93.8
415.5
129.3
91.0
403.2
104.0
2012
93.8
413.4
138.7
90.6
404.6
112.7
2013
91.9
408.4
144.7
87.6
402.4
116.3
2014
89.1
402.8
148.3
87.8
393.1
117.5
2015
89.3
397.9
148.0
86.8
389.9
120.8
2016
86.6
391.3
153.3
83.4
386.2
123.4
2017
84.4
388.1
153.8
81.9
382.1
128.5
2018
87.0
388.2
156.1
82.0
380.2
129.3
Source: Statistics Canada, Labour Force Survey.
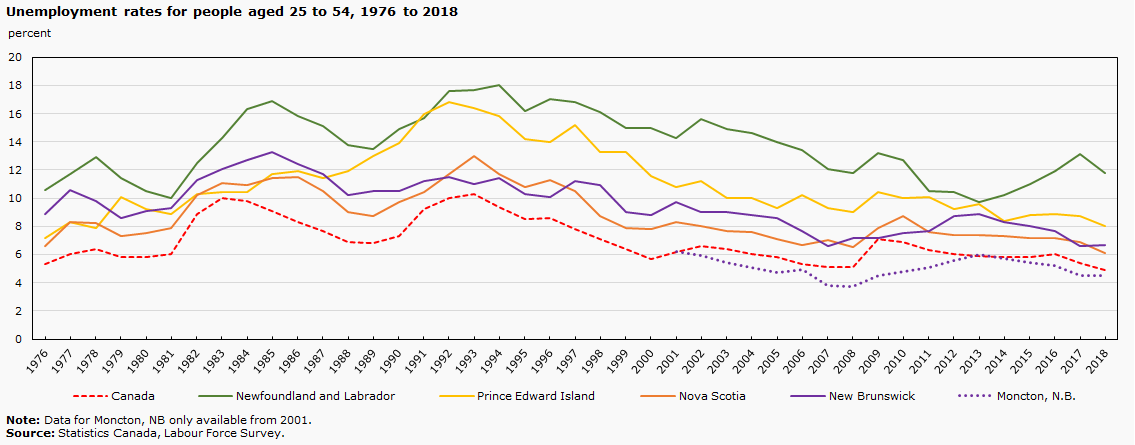
Unemployment rates historically above the national average
Description for chart 19 - Unemployment rates for people aged 25 to 54, 1976 to 2018
Unemployment rates for people aged 25 to 54, 1976 to 2018
Canada
Newfoundland and Labrador
Prince Edward Island
Nova Scotia
New Brunswick
Moncton, N.B.
percent
1976
5.3
10.6
7.2
6.6
8.9
..
1977
6.0
11.7
8.3
8.3
10.6
..
1978
6.4
12.9
7.9
8.2
9.8
..
1979
5.8
11.4
10.1
7.3
8.6
..
1980
5.8
10.5
9.2
7.5
9.1
..
1981
6.0
10.0
8.9
7.9
9.3
..
1982
8.9
12.5
10.3
10.2
11.3
..
1983
10.0
14.3
10.4
11.1
12.1
..
1984
9.8
16.3
10.4
10.9
12.7
..
1985
9.1
16.9
11.7
11.4
13.3
..
1986
8.3
15.8
11.9
11.5
12.4
..
1987
7.7
15.1
11.4
10.5
11.7
..
1988
6.9
13.8
11.9
9.0
10.2
..
1989
6.8
13.5
13.0
8.7
10.5
..
1990
7.3
14.9
13.9
9.7
10.5
..
1991
9.2
15.7
16.0
10.4
11.2
..
1992
10.0
17.6
16.8
11.7
11.5
..
1993
10.3
17.7
16.4
13.0
11.0
..
1994
9.4
18.0
15.8
11.7
11.4
..
1995
8.5
16.2
14.2
10.8
10.3
..
1996
8.6
17.0
14.0
11.3
10.1
..
1997
7.8
16.8
15.2
10.5
11.2
..
1998
7.1
16.1
13.3
8.7
10.9
..
1999
6.4
15.0
13.3
7.9
9.0
..
2000
5.7
15.0
11.6
7.8
8.8
..
2001
6.2
14.3
10.8
8.3
9.7
6.2
2002
6.6
15.6
11.2
8.0
9.0
5.9
2003
6.4
14.9
10.0
7.7
9.0
5.4
2004
6.0
14.6
10.0
7.6
8.8
5.1
2005
5.8
14.0
9.3
7.1
8.6
4.7
2006
5.3
13.4
10.2
6.7
7.7
4.9
2007
5.1
12.1
9.3
7.0
6.6
3.8
2008
5.1
11.8
9.0
6.5
7.2
3.7
2009
7.1
13.2
10.4
7.9
7.2
4.5
2010
6.9
12.7
10.0
8.7
7.5
4.8
2011
6.3
10.5
10.1
7.6
7.7
5.1
2012
6.0
10.4
9.2
7.4
8.7
5.6
2013
5.9
9.7
9.6
7.4
8.9
6.0
2014
5.8
10.2
8.4
7.3
8.3
5.7
2015
5.8
11.0
8.8
7.2
8.0
5.4
2016
6.0
11.9
8.9
7.2
7.7
5.2
2017
5.4
13.1
8.7
6.9
6.6
4.5
2018
4.9
11.8
8.0
6.1
6.7
4.5
.. not available for a specific reference period
Source: Statistics Canada, Labour Force Survey.
Employment rates converging towards the national average in most Atlantic provinces
Description for chart 20 - Employment rates for people aged 25 to 54, 1976 to 2018 (percent)
Employment rates for people aged 25 to 54, 1976 to 2018 (percent)
Canada
Newfoundland and Labrador
Prince Edward Island
Nova Scotia
New Brunswick
Moncton, N.B.
1976
69.6
54.4
65.3
64.0
60.8
..
1977
69.6
54.6
65.4
63.2
59.2
..
1978
70.7
55.2
67.3
64.7
61.7
..
1979
72.0
58.5
67.7
65.9
62.5
..
1980
72.9
59.6
68.7
67.1
63.6
..
1981
74.0
60.3
69.3
67.8
64.6
..
1982
71.6
59.5
67.7
66.5
62.1
..
1983
71.5
58.1
69.1
66.4
62.3
..
1984
72.2
58.1
69.1
67.9
61.7
..
1985
73.7
58.7
69.9
67.8
62.6
..
1986
75.2
60.0
70.8
68.5
65.4
..
1987
76.2
60.9
72.7
69.6
66.3
..
1988
77.6
62.8
73.7
71.6
68.7
..
1989
78.3
63.7
73.2
72.6
69.3
..
1990
78.1
63.2
73.4
73.0
69.8
..
1991
76.4
62.3
71.0
72.4
68.3
..
1992
75.0
58.5
71.1
70.3
68.0
..
1993
74.9
58.6
71.1
69.2
68.7
..
1994
75.5
58.2
72.1
69.9
68.2
..
1995
76.2
59.6
73.0
70.0
69.6
..
1996
76.2
58.0
73.8
70.0
69.6
..
1997
77.3
59.8
72.5
71.3
70.6
..
1998
78.4
61.6
74.2
73.6
71.2
..
1999
79.2
64.5
74.6
74.5
73.0
..
2000
79.9
64.0
77.2
75.4
74.1
..
2001
79.8
66.0
78.0
75.7
73.5
80.4
2002
80.3
66.2
78.1
76.9
75.7
82.7
2003
80.8
66.9
79.3
77.2
75.9
84.1
2004
81.3
67.5
79.7
78.4
76.9
84.9
2005
81.3
68.2
80.2
78.6
77.1
84.8
2006
81.6
69.8
80.3
78.2
78.3
84.5
2007
82.2
70.8
80.0
79.3
79.1
84.7
2008
82.3
71.4
80.5
79.4
79.4
86.0
2009
80.3
70.4
79.6
78.7
79.8
85.5
2010
80.5
71.4
79.4
78.6
79.3
85.0
2011
81.0
73.8
79.6
79.6
78.8
85.6
2012
81.4
75.5
81.8
80.0
78.5
84.9
2013
81.6
76.3
81.2
80.1
79.3
84.9
2014
81.2
75.8
82.2
79.8
79.1
84.7
2015
81.4
74.6
82.2
80.2
79.7
84.4
2016
81.4
74.3
79.5
79.3
80.1
84.9
2017
82.3
72.6
80.5
80.3
80.3
83.0
2018
82.7
74.1
81.5
81.2
80.7
84.6
.. not available for a specific reference period
Source: Statistics Canada, Labour Force Survey.
Lower projected labour force participation in Atlantic Canada outside CMAs
Description for chart 21 - Lower projected labour force participation rate in Atlantic Canada outside CMAs
Lower projected labour force participation rate in Atlantic Canada outside CMAs
2017
2036
percent
Atlantic Canada CMAs
65.9
60.4
Atlantic Canada outside CMAs
58.4
53.2
Canada
65.7
63.2
Notes: Reference scenario. Census Metropolitan Area (CMA).
Source: Statistics Canada, Labour Force Survey and Demosim 2017 (2036).
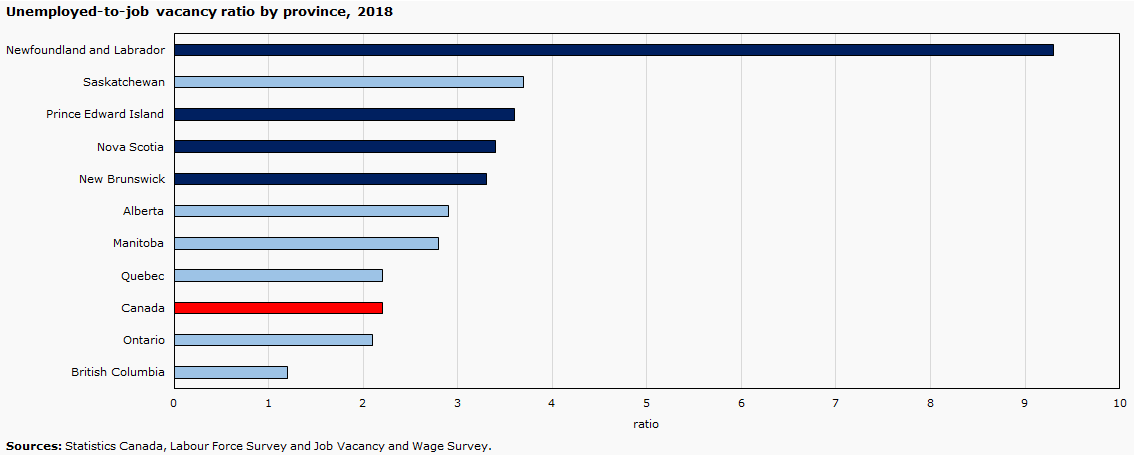
Unemployed-to-job vacancy ratio higher in Atlantic Canada
Description for chart 22 - Unemployed-to-job vacancy ratio by province, 2018
Unemployed-to-job vacancy ratio by province, 2018
ratio
Newfoundland and Labrador
9.3
Saskatchewan
3.7
Prince Edward Island
3.6
Nova Scotia
3.4
New Brunswick
3.3
Alberta
2.9
Manitoba
2.8
Quebec
2.2
Canada
2.2
Ontario
2.1
British Columbia
1.2
Sources: Statistics Canada, Labour Force Survey and Job Vacancy and Wage Survey.
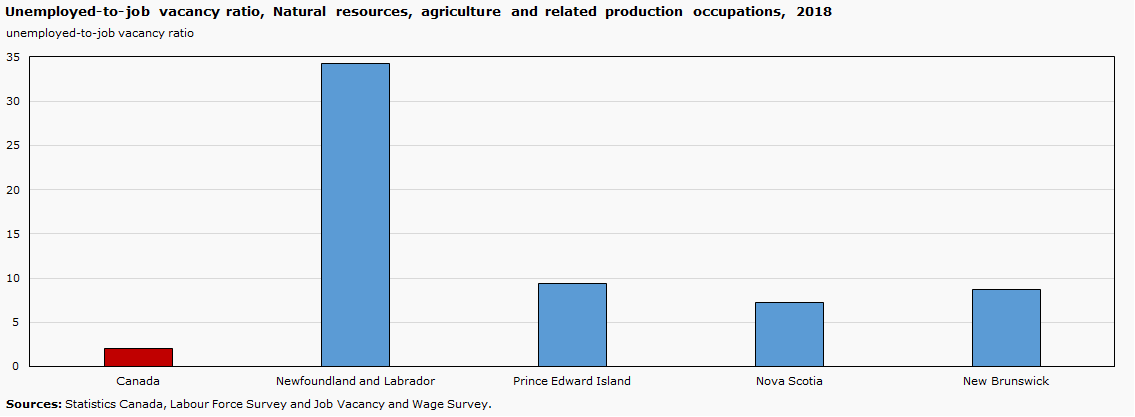
Unemployed-to-job vacancy ratio in the Atlantic provinces varies considerably by occupation
Description for chart 23 - Unemployed-to-job vacancy ratio, Business, finance and administration occupations, 2018
Unemployed-to-job vacancy ratio, Business, finance and administration occupations, 2018
Canada
Newfoundland and Labrador
Prince Edward Island
Nova Scotia
New Brunswick
Unemployed-to-job vacancy ratio
Business, finance and administration occupations
1.5
4.9
2.9
2.1
1.9
Sources: Statistics Canada, Labour Force Survey and Job Vacancy and Wage Survey.
Description for chart 24 - Unemployed-to-job vacancy ratio, Natural resources, agriculture and related production occupations, 2018
Unemployed-to-job vacancy ratio, Natural resources, agriculture and related production occupations, 2018
Canada
Newfoundland and Labrador
Prince Edward Island
Nova Scotia
New Brunswick
Unemployed-to-job vacancy ratio
Natural resources, agriculture and related production occupations
2.0
34.3
9.4
7.2
8.7
Sources: Statistics Canada, Labour Force Survey and Job Vacancy and Wage Survey.
Recent trends in an evolving labour market
Diverse landscape of regional labour markets.
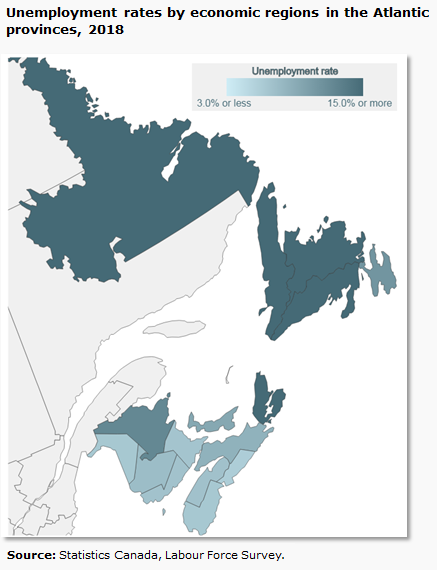
Regional labour markets in the Atlantic provinces
Labour market indicators tend to vary greatly between regional labour markets in the Atlantic provinces.
Similar to what is observed across Canada, unemployment rates tend to be higher in regions outside large population centers.
Unemployment rates ranging from 6.0% in Halifax, N.S. to 18.6% in South Coast-Burin Peninsula, N.L.
Description for map 2 - Unemployment rates by economic regions in the Atlantic provinces, 2018
Unemployment rates by economic regions in the Atlantic provinces, 2018
Economic region (perce
Unemployment rate (percent)
South Coast-Burin Peninsula, N.L.
18.6
Notre Dame-Central Bonavista Bay, N.L.
18.2
West Coast-Northern Peninsula-Labrador, N.L.
16.1
Cape Breton, N.S.
15.1
Campbellton-Miramichi, N.B.
12.3
Avalon Peninsula, N.L.
11.1
Prince Edward Island
9.4
North Shore, N.S.
8.5
Fredericton-Oromocto, N.B.
7.5
Annapolis Valley, N.S.
7.1
Saint John-St. Stephen, N.B.
7.0
Moncton-Richibucto, N.B.
6.8
Southern, N.S.
6.5
Edmundston-Woodstock, N.B.
6.5
Halifax, N.S.
6.0
Source: Statistics Canada, Labour Force Survey.
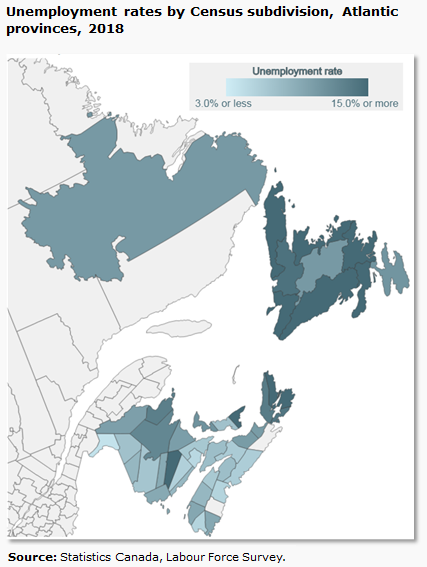
Regional labour markets in the Atlantic provinces
Even more diversity within regions…
Unemployment rates ranging from 4.1% in Madawaska, N.B. to 24.2% in Division No. 4, N.L.
Description for map 3 - Unemployment rates by Census subdivision, Atlantic provinces, 2018
Unemployment rates by Census subdivision, Atlantic provinces, 2018
Census subdivision
Unemployment rate (percent)
Division No. 4, N.L.
24.2
Division No. 2, N.L.
23.4
Division No. 7, N.L.
23.2
Division No. 9, N.L.
21.4
Division No. 8, N.L.
20.9
Victoria County, N.S.
18.7
Kings County, P.E.I.
16.6
Cape Breton County, N.S.
15.3
Queens County, N.B.
15.3
Division No. 3, N.L.
15.0
Division No. 5, N.L.
14.3
Richmond County, N.S.
13.9
Inverness County, N.S.
13.4
Gloucester County, N.B.
13.1
Northumberland County, N.B.
12.4
Prince County, P.E.I.
11.3
Division No. 1, N.L.
11.1
Division No. 6, N.L.
10.7
Division No. 10, N.L.
10.7
Pictou County, N.S.
10.5
Antigonish County, N.S.
10.5
Kent County, N.B.
10.3
Restigouche County, N.B.
10.2
Digby County, N.S.
9.5
Shelburne County, N.S.
9.4
Charlotte County, N.B.
9.3
Sunbury County, N.B.
9.2
Annapolis County, N.S.
8.0
Carleton County, N.B.
8.0
Saint John County, N.B.
7.9
Hants County, N.S.
7.4
Cumberland County, N.S.
7.4
Queens County, P.E.I.
7.1
Victoria County, N.B.
7.1
York County, N.B.
6.7
Westmorland County, N.B.
6.5
Kings County, N.S.
6.4
Colchester County, N.S.
6.2
Halifax County, N.S.
6.0
Kings County, N.B.
5.7
Yarmouth County, N.S.
5.4
Lunenburg County, N.S.
5.4
Albert County, N.B.
5.0
Madawaska County, N.B.
4.1
Division No. 11, N.L.
x
Guysborough County, N.S.
x
Queens County, N.S.
x
x suppressed to meet the confidentiality requirements of the Statistics Act
Source: Statistics Canada, Labour Force Survey.
In economic regions with high unemployment, jobs are more likely to be temporary
Description for chart 25 - Unemployment rate and percentage of employees in temporary positions, Atlantic Canada by economic region, 2018 (percentage)
Unemployment rate and percentage of employees in temporary positions, Atlantic Canada by economic region, 2018 (percent)
Economic region
Tempory employees rate
Unemployment rate
Avalon Peninsula, N.L.
20.5
11.1
West Coast-Northern Peninsula-Labrador, N.L.
24.0
16.2
South Coast-Burin Peninsula and Notre Dame-Central Bonavista Bay, N.L.
27.1
18.2
Prince Edward Island
21.0
9.4
Cape Breton, N.S.
21.8
15.1
North Shore, N.S.
15.7
8.5
Annapolis Valley, N.S.
14.3
7.1
Southern, N.S.
16.4
6.5
Halifax, N.S.
25.0
5.9
Campbellton-Miramichi, N.B.
25.0
12.4
Moncton-Richibucto, N.B.
14.9
6.8
Saint John-St. Stephen, N.B.
13.9
7.0
Fredericton-Oromocto, N.B.
16.9
7.5
Edmundston-Woodstock, N.B.
14.7
6.4
Source: Statistics Canada, Labour Force Survey.
Population aging and its impact on participation rates
Not all regional labour markets facing the same challenge when it comes to population aging.
Participation rates generally lower than the national average (65.4%) in the Atlantic economic regions.
However, some regions show participation rates close to orabove the national average:
Halifax: 68.1%
Prince Edward Island: 66.7%
Moncton-Richibucto: 63.5%
Description for map 4 - Participation rates by economic region, Atlantic provinces, 2018
Participation rates by economic region, Atlantic provinces, 2018
Economic regions
Participation rate (percent)
Halifax, N.S.
68.1
Prince Edward Island
66.7
Moncton-Richibucto, N.B.
63.5
Fredericton-Oromocto, N.B.
62.7
Avalon Peninsula, N.L.
62.1
Edmundston-Woodstock, N.B.
62.0
Saint John-St. Stephen, N.B.
61.8
Annapolis Valley, N.S.
58.9
West Coast-Northern Peninsula-Labrador, N.L.
57.8
North Shore, N.S.
57.1
Southern, N.S.
56.7
South Coast-Burin Peninsula, N.L.
56.4
Campbellton-Miramichi, N.B.
55.9
Cape Breton, N.S.
52.7
Notre Dame-Central Bonavista Bay, N.L.
52.4
Source: Statistics Canada, Labour Force Survey.
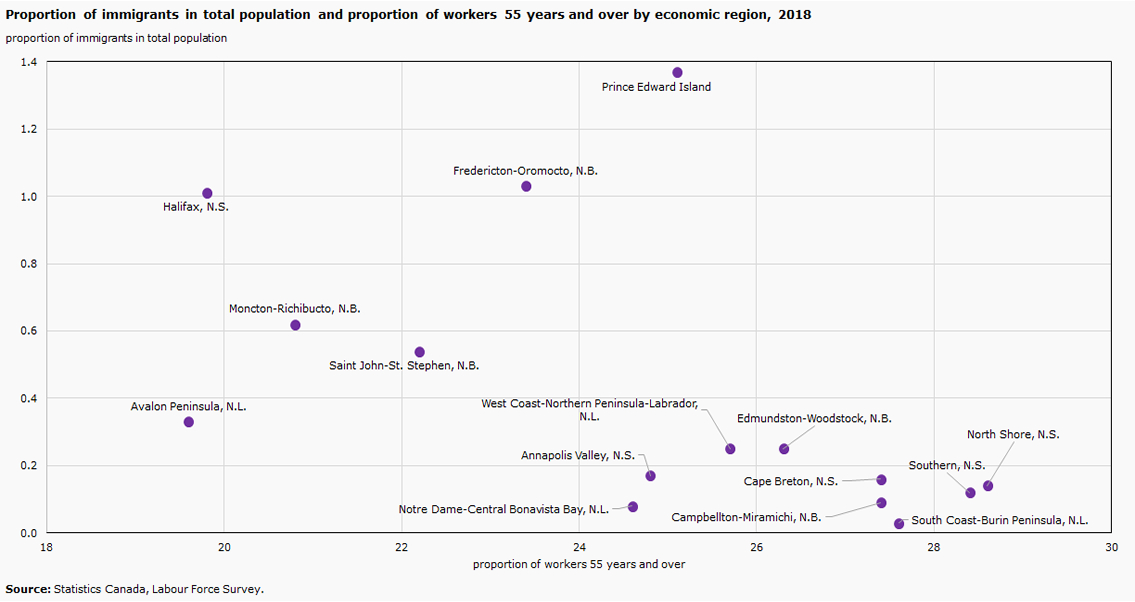
Immigration lower in regions with older workforce
Description for chart 26 - Proportion of immigrants in total population and proportion of workers 55 years and over by economic region, 2018
Proportion of immigrants in total population and proportion of workers 55 years and over by economic region, 2018
Economic region
Proportion of workers 55 years and over
Proportion of immigrants in total population
Annapolis Valley, N.S.
24.8
0.17
Avalon Peninsula, N.L.
19.6
0.33
Campbellton-Miramichi, N.B.
27.4
0.09
Cape Breton, N.S.
27.4
0.16
Edmundston-Woodstock, N.B.
26.3
0.25
Fredericton-Oromocto, N.B.
23.4
1.03
Halifax, N.S.
19.8
1.01
Moncton-Richibucto, N.B.
20.8
0.62
North Shore, N.S.
28.6
0.14
Notre Dame-Central Bonavista Bay, N.L.
24.6
0.08
Prince Edward Island
25.1
1.37
Saint John-St. Stephen, N.B.
22.2
0.54
South Coast-Burin Peninsula, N.L.
27.6
0.03
Southern, N.S.
28.4
0.12
West Coast-Northern Peninsula-Labrador, N.L.
25.7
0.25
Source: Statistics Canada, Labour Force Survey.
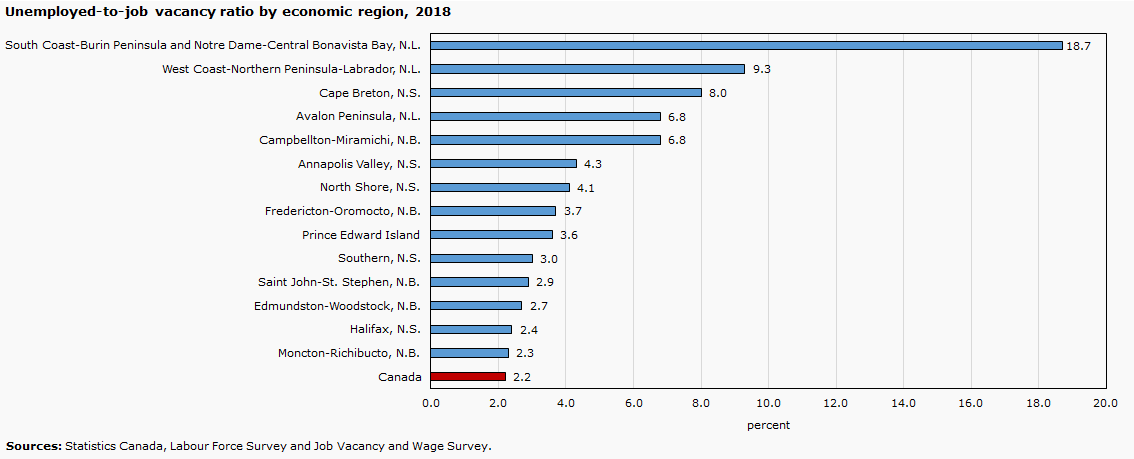
Unemployed-to-job vacancy ratio by economic region
Description for chart 27 - Unemployed-to-job vacancy ratio by economic region, 2018
Unemployed-to-job vacancy ratio by economic region, 2018
ratio
South Coast-Burin Peninsula and Notre Dame-Central Bonavista Bay, N.L.
18.7
West Coast-Northern Peninsula-Labrador, N.L.
9.3
Cape Breton, N.S.
8.0
Avalon Peninsula, N.L.
6.8
Campbellton-Miramichi, N.B.
6.8
Annapolis Valley, N.S.
4.3
North Shore, N.S.
4.1
Fredericton-Oromocto, N.B.
3.7
Prince Edward Island
3.6
Southern, N.S.
3.0
Saint John-St. Stephen, N.B.
2.9
Edmundston-Woodstock, N.B.
2.7
Halifax, N.S.
2.4
Moncton-Richibucto, N.B.
2.3
Canada
2.2
Source: Statistics Canada, Labour Force Survey and Job Vacancy and Wage Survey.
Opportunities in the Atlantic region
In 2017, 116 instances for which the average wage paid for an occupation was higher in an Atlantic economic region than the national averagewage paid for that same occupation.
Description for map 5 - Difference between the regional average full-time wage paid for an occcupation and the national average full-time wage paid for the same occupation, by select occupations and economic regions, 2018
Difference between the regional average full-time wage paid for an occcupation and the national average full-time wage paid for the same occupation, by select occupations and economic regions, 2018
Economic region
Occupation
Wage differential (percent)
West Coast-Northern Peninsula-Labrador, N.L.
Machining, metal forming, shaping and erecting trade
47
Campbellton-Miramichi, N.B.
Specialized occupations in personal and customer services
43
Cape Breton, N.S.
Administrative services supervisors
36
Annapolis Valley, N.S.
Managers in agriculture, horticulture and aquaculture
25
Prince Edward Island
Human resources and business service professionals
12
Source: Statistics Canada, Labour Force Survey.
Vision for analyzing tomorrow's labour market
Modernizing every step of the cycle to improve our products…
Creating the foundation for a digital government, society and economy.
Generation and Collection
From survey-first segregated collection to maximizing the use of administrative/big data.
User Centric Service Delivery
Integration
From fragmented to modern methodologies to better integrate data from a variety of sources.
Statistical Capacity Building & Leadership
Dissemination
From limited to significantly expanded access and responsive, high value products and services.
Sharing & Collaboration
Analysis and visualization
From static data tables and analysis to provision of tools to evaluate and support responsible data use.
Leading Edge Methods & Data Integration
Consumption
Supporting quality decisions by citizens, their governments and businesses based on evidence.
Flexible & Modern Workplace
Vision for analyzing tomorrow's labour market
Statistics Canada is committed to modernizing and building on existing labour market measures by:
Adapting measures of employment and quality of work to fully capture the effects of globalisation and the digital economy.
Addressing data gaps related to automation, technological change and skills.
Facilitating decision-making with increased local and granular labour market information.
Testing new questions for the 2021 Census in order to update labour and journey to work content.
Continuing to build and foster relationships with our partners and stakeholders
Ongoing consultation on …
Concepts, measures and indicators
Data sources
New questions and updated content for the 2021 Census
Alternative collection methods
With...
Governmental and community partners, such as Employment and Social Development Canada (ESDC) and the Atlantic Canada Opportunities Agency.
Independent agencies, such as the Labour Market Information Council.
Data users across the country, such as students, academic experts and survey participants.
Going forward: Measuring new forms of employment
One-time basis questions added in September 2018
Reasons for working for population aged 60 and over
Young people not in employment, education or training (NEET)
Trends in temporary employment
Self-employed Canadians: Who and why?
Beginning in November 2019, 5 questions will be added to the LFS on an on-going basis
Multiple job holders
Earnings of self-employed
Access to employment benefits
Main activity of those not in the labour force
Reasons for working beyond age 60
Statistics Canada – ESDC Working Group on Quality of Employment
Indicators of job precarity
Skills and skills mismatches
Electronically mediated employment
Small Area Estimation: Increasing precision of sub-provincial labour market indicators
Combining multiple data sources
Successful pilot project conducted in 2017
Increasing both the quality and availability of CA and CMA estimates
Transition to standard product: Available to the public on the Statistics Canada website by the end of 2019
Dissemination of new data, analytical and reference products
Innovative tools for a comprehensive picture of regional labour markets.
Canada owes the success of its statistical system to a long-standing partnership between Statistics Canada, the citizens of Canada, its businesses, governments and other institutions. Accurate and timely statistical information could not be produced without their continued co-operation and goodwill.
Standards of service to the public
Statistics Canada is committed to serving its clients in a prompt, reliable and courteous manner. To this end, the Agency has developed standards of service which its employees observe in serving its clients.
Copyright
Published by authority of the Minister responsible for Statistics Canada.