Telling Canada's story in numbers
The economy
Archived Content
Information identified as archived is provided for reference, research or recordkeeping purposes. It is not subject to the Government of Canada Web Standards and has not been altered or updated since it was archived. Please "contact us" to request a format other than those available.
October 17, 2017
Anil Arora
Chief Statistician of Canada
While Statistics Canada has data on virtually every aspect of the Canadian economy – as well as our society and the environment, this presentation focuses on providing some insights on recent trends in the Canadian economy. Statistics Canada publishes a great deal of economic data that is closely studied to understand the extent to which the economy is growing and changing – and how these changes are distributed across provinces, industries and different segments of the population.
Telling Canada's economic story
1. Current economic trends
Canada is leading the G7 in economic growth in 2017

Description for Chart 1
| Canada | France | Germany | Italy | Japan | United Kingdom | United States | |
|---|---|---|---|---|---|---|---|
| Source: OECD, Quarterly National Accounts. | |||||||
| 2000 | |||||||
| Q1 | 100.0 | 100.0 | 100.0 | 100.0 | 100.0 | 100.0 | 100.0 |
| Q2 | 101.2 | 100.9 | 101.0 | 100.8 | 100.2 | 100.7 | 101.9 |
| Q3 | 102.2 | 101.6 | 100.9 | 101.4 | 100.2 | 101.0 | 102.0 |
| Q4 | 102.4 | 102.4 | 100.9 | 103.0 | 101.2 | 101.2 | 102.6 |
| 2001 | |||||||
| Q1 | 102.9 | 102.9 | 102.6 | 103.4 | 101.9 | 102.5 | 102.3 |
| Q2 | 103.2 | 103.1 | 102.7 | 102.9 | 101.3 | 103.2 | 102.8 |
| Q3 | 103.1 | 103.4 | 102.4 | 102.7 | 100.2 | 103.9 | 102.5 |
| Q4 | 103.7 | 103.4 | 102.5 | 102.6 | 99.9 | 104.3 | 102.8 |
| 2002 | |||||||
| Q1 | 105.3 | 103.8 | 102.2 | 102.7 | 100.0 | 104.7 | 103.7 |
| Q2 | 105.9 | 104.2 | 102.5 | 103.1 | 100.8 | 105.5 | 104.3 |
| Q3 | 106.8 | 104.6 | 102.9 | 103.4 | 101.2 | 106.3 | 104.8 |
| Q4 | 107.4 | 104.6 | 102.7 | 103.5 | 101.6 | 107.2 | 104.9 |
| 2003 | |||||||
| Q1 | 108.0 | 104.8 | 101.5 | 103.4 | 101.3 | 108.1 | 105.4 |
| Q2 | 107.8 | 104.6 | 101.5 | 103.0 | 102.2 | 109.1 | 106.4 |
| Q3 | 108.2 | 105.3 | 102.0 | 103.3 | 102.7 | 110.2 | 108.2 |
| Q4 | 109.0 | 106.1 | 102.4 | 103.9 | 103.8 | 111.1 | 109.5 |
| 2004 | |||||||
| Q1 | 109.8 | 107.1 | 102.4 | 104.4 | 104.7 | 111.7 | 110.1 |
| Q2 | 111.1 | 107.7 | 102.7 | 104.8 | 104.6 | 112.3 | 110.9 |
| Q3 | 112.4 | 108.1 | 102.5 | 105.1 | 105.1 | 112.5 | 111.9 |
| Q4 | 113.2 | 108.8 | 102.6 | 105.1 | 104.7 | 113.1 | 112.9 |
| 2005 | |||||||
| Q1 | 113.6 | 109.1 | 102.4 | 105.0 | 105.2 | 113.8 | 114.1 |
| Q2 | 114.4 | 109.3 | 103.1 | 105.8 | 106.2 | 115.0 | 114.7 |
| Q3 | 115.8 | 109.9 | 103.9 | 106.5 | 107.2 | 116.3 | 115.6 |
| Q4 | 117.0 | 110.6 | 104.3 | 106.8 | 107.4 | 117.9 | 116.3 |
| 2006 | |||||||
| Q1 | 117.9 | 111.5 | 105.3 | 107.3 | 107.4 | 118.2 | 117.7 |
| Q2 | 117.9 | 112.5 | 107.0 | 107.9 | 107.9 | 118.5 | 118.0 |
| Q3 | 118.3 | 112.6 | 108.1 | 108.3 | 107.7 | 118.7 | 118.2 |
| Q4 | 118.7 | 113.4 | 109.5 | 109.5 | 108.9 | 119.1 | 119.1 |
| 2007 | |||||||
| Q1 | 119.5 | 114.2 | 109.9 | 109.8 | 109.8 | 120.3 | 119.2 |
| Q2 | 120.6 | 115.1 | 110.7 | 109.8 | 109.8 | 121.2 | 120.1 |
| Q3 | 121.1 | 115.5 | 111.7 | 109.6 | 109.4 | 122.1 | 120.9 |
| Q4 | 121.3 | 115.8 | 112.0 | 109.6 | 109.9 | 123.0 | 121.3 |
| 2008 | |||||||
| Q1 | 121.4 | 116.2 | 113.0 | 110.5 | 110.4 | 123.2 | 120.5 |
| Q2 | 121.8 | 115.7 | 112.7 | 109.7 | 109.6 | 122.4 | 121.1 |
| Q3 | 122.8 | 115.3 | 112.2 | 108.2 | 108.2 | 120.4 | 120.5 |
| Q4 | 121.4 | 113.7 | 110.1 | 105.7 | 105.9 | 117.6 | 117.9 |
| 2009 | |||||||
| Q1 | 118.6 | 111.8 | 105.1 | 102.7 | 100.8 | 115.7 | 116.3 |
| Q2 | 117.3 | 111.6 | 105.2 | 102.1 | 102.8 | 115.4 | 116.2 |
| Q3 | 117.8 | 111.8 | 105.8 | 102.6 | 102.7 | 115.5 | 116.5 |
| Q4 | 119.2 | 112.5 | 106.8 | 102.8 | 104.2 | 116.0 | 117.7 |
| 2010 | |||||||
| Q1 | 120.7 | 113.0 | 107.6 | 103.2 | 105.4 | 116.6 | 118.2 |
| Q2 | 121.3 | 113.7 | 109.8 | 104.0 | 106.4 | 117.8 | 119.3 |
| Q3 | 122.1 | 114.4 | 110.7 | 104.6 | 108.4 | 118.5 | 120.1 |
| Q4 | 123.5 | 115.1 | 111.6 | 105.1 | 107.7 | 118.6 | 120.9 |
| 2011 | |||||||
| Q1 | 124.4 | 116.3 | 113.6 | 105.4 | 106.1 | 119.3 | 120.4 |
| Q2 | 124.7 | 116.3 | 113.8 | 105.5 | 105.5 | 119.4 | 121.3 |
| Q3 | 126.4 | 116.5 | 114.3 | 105.0 | 108.0 | 119.9 | 121.5 |
| Q4 | 127.4 | 116.7 | 114.4 | 104.0 | 107.8 | 120.2 | 122.9 |
| 2012 | |||||||
| Q1 | 127.4 | 116.7 | 114.7 | 103.0 | 109.1 | 120.7 | 123.7 |
| Q2 | 127.9 | 116.6 | 114.8 | 102.2 | 108.5 | 120.6 | 124.3 |
| Q3 | 128.1 | 116.8 | 115.1 | 101.7 | 108.1 | 122.0 | 124.4 |
| Q4 | 128.3 | 116.7 | 114.6 | 101.1 | 108.2 | 121.7 | 124.5 |
| 2013 | |||||||
| Q1 | 129.6 | 116.7 | 114.3 | 100.0 | 109.6 | 122.5 | 125.3 |
| Q2 | 130.4 | 117.5 | 115.3 | 100.1 | 110.6 | 123.1 | 125.6 |
| Q3 | 131.5 | 117.5 | 115.9 | 100.4 | 111.3 | 124.0 | 126.6 |
| Q4 | 132.8 | 118.0 | 116.4 | 100.3 | 111.2 | 124.6 | 127.8 |
| 2014 | |||||||
| Q1 | 132.9 | 118.1 | 117.4 | 100.4 | 112.4 | 125.7 | 127.5 |
| Q2 | 134.3 | 118.3 | 117.2 | 100.3 | 110.2 | 126.9 | 128.9 |
| Q3 | 134.9 | 119.0 | 117.6 | 100.5 | 110.1 | 127.9 | 130.6 |
| Q4 | 135.7 | 119.0 | 118.6 | 100.4 | 110.9 | 129.0 | 131.2 |
| 2015 | |||||||
| Q1 | 135.4 | 119.4 | 118.8 | 100.7 | 112.2 | 129.3 | 132.3 |
| Q2 | 135.2 | 119.4 | 119.3 | 101.0 | 112.1 | 129.9 | 133.2 |
| Q3 | 136.0 | 119.9 | 119.7 | 101.2 | 112.4 | 130.3 | 133.7 |
| Q4 | 136.2 | 120.2 | 120.2 | 101.4 | 112.1 | 131.2 | 133.9 |
| 2016 | |||||||
| Q1 | 137.1 | 120.9 | 120.9 | 101.7 | 112.8 | 131.4 | 134.1 |
| Q2 | 136.7 | 120.8 | 121.5 | 101.8 | 113.2 | 132.1 | 134.8 |
| Q3 | 138.1 | 121.0 | 121.9 | 102.1 | 113.5 | 132.8 | 135.8 |
| Q4 | 139.0 | 121.6 | 122.4 | 102.5 | 114.0 | 133.7 | 136.3 |
| 2017 | |||||||
| Q1 | 140.3 | 122.2 | 123.3 | 103.0 | 114.4 | 134.0 | 136.8 |
| Q2 | 141.8 | 122.8 | 124.1 | 103.4 | 115.5 | 134.4 | 137.8 |
This follows two years of slower growth in 2015 and 2016

Description for Chart 2
| 2016 | Average 2010-2015 | |
|---|---|---|
| CA | 1.50 | 2.3 |
| NL | 1.9 | 1.0 |
| PE | 2.4 | 1.6 |
| NS | 0.9 | 0.6 |
| NB | 1.4 | 0.4 |
| QC | 1.7 | 1.5 |
| ON | 2.6 | 2.3 |
| MB | 2.4 | 2.3 |
| SK | -1.0 | 3.3 |
| AB | -3.8 | 3.8 |
| BC | 3.7 | 2.8 |
| YT | 8.2 | 1.4 |
| NT | -0.1 | 0.3 |
| NU | 3.9 | 6.1 |
2. Structural changes
The economy is undergoing structural changes

Description for Chart 3
| Goods-producing industries % share of goods |
Service-producing industries % share of services |
|
|---|---|---|
| 2002 | 34.26614 | 65.9046 |
| 2003 | 33.98616 | 66.16253 |
| 2004 | 33.87998 | 66.26058 |
| 2005 | 33.6479 | 66.47458 |
| 2006 | 32.81416 | 67.24476 |
| 2007 | 32.05666 | 67.94334 |
| 2008 | 31.30444 | 68.69556 |
| 2009 | 29.09247 | 70.90753 |
| 2010 | 29.66049 | 70.33951 |
| 2011 | 29.98488 | 70.01512 |
| 2012 | 29.97765 | 70.02235 |
| 2013 | 30.07649 | 69.92351 |
| 2014 | 30.24145 | 69.75855 |
| 2015 | 29.50372 | 70.49628 |
| 2016 | 29.015 | 70.985 |

Description for Chart 4
| Goods | Other current account | Total | |
|---|---|---|---|
| Note(s): Data are seasonally adjusted | |||
| 08 | |||
| Q1 | 11996 | -8,519 | 3477 |
| Q2 | 15660 | -10,409 | 5251 |
| Q3 | 14720 | -10,828 | 3892 |
| Q4 | 1293 | -12,281 | -10988 |
| 09 | |||
| Q1 | -732 | -10,087 | -10819 |
| Q2 | -2122 | -8,995 | -11117 |
| Q3 | -3165 | -9,965 | -13130 |
| Q4 | -753 | -10,372 | -11125 |
| 10 | |||
| Q1 | -801 | -12,710 | -13511 |
| Q2 | -2147 | -12,576 | -14723 |
| Q3 | -6176 | -14,021 | -20197 |
| Q4 | -580 | -10,989 | -11569 |
| 11 | |||
| Q1 | -304 | -13,325 | -13629 |
| Q2 | -2440 | -11,555 | -13995 |
| Q3 | 1455 | -11,621 | -10166 |
| Q4 | 1856 | -13,147 | -11291 |
| 12 | |||
| Q1 | -1198 | -12,297 | -13495 |
| Q2 | -4465 | -13,153 | -17618 |
| Q3 | -5169 | -12,366 | -17535 |
| Q4 | -2456 | -14,576 | -17032 |
| 13 | |||
| Q1 | -1756 | -13,666 | -15422 |
| Q2 | -1417 | -14,511 | -15928 |
| Q3 | -2489 | -11,922 | -14411 |
| Q4 | -2483 | -12,877 | -15360 |
| 14 | |||
| Q1 | 1864 | -13,361 | -11497 |
| Q2 | 2010 | -13,236 | -11226 |
| Q3 | 1952 | -12,729 | -10777 |
| Q4 | -1977 | -12,730 | -14707 |
| 15 | |||
| Q1 | -6670 | -11,518 | -18188 |
| Q2 | -5762 | -10,695 | -16457 |
| Q3 | -5304 | -11,009 | -16313 |
| Q4 | -5266 | -11,329 | -16595 |
| 16 | |||
| Q1 | -6725 | -10,977 | -17702 |
| Q2 | -10983 | -7,860 | -18843 |
| Q3 | -8360 | -10,279 | -18639 |
| Q4 | 68 | -11,852 | -11784 |
| 17 | |||
| Q1 | -1942 | -10,979 | -12921 |
| Q2 | -5199 | -11,120 | -16319 |
Commodity prices, particularly for energy, have become increasingly important for the Canadian economy

Description for Chart 5
| Date | Household consumption | Exports of goods and services | Gross domestic product at market prices | Business Investment |
|---|---|---|---|---|
| Mar-07 | 100 | 100 | 100 | 100 |
| Jun-07 | 101.5019 | 101.5622 | 100.9651 | 100.5669 |
| Sep-07 | 102.4372 | 99.79021 | 101.3847 | 100.7848 |
| Dec-07 | 104.2921 | 97.37741 | 101.5267 | 102.1493 |
| Mar-08 | 105.1203 | 96.0087 | 101.5869 | 104.0147 |
| Jun-08 | 105.2321 | 96.828 | 101.9393 | 103.2733 |
| Sep-08 | 105.2848 | 96.07103 | 102.7897 | 102.247 |
| Dec-08 | 104.0066 | 91.65793 | 101.6008 | 96.84025 |
| Mar-09 | 103.6591 | 83.74415 | 99.2794 | 85.10415 |
| Jun-09 | 104.5435 | 80.35328 | 98.18394 | 83.86597 |
| Sep-09 | 105.6687 | 82.50362 | 98.62823 | 85.5359 |
| Dec-09 | 106.3947 | 84.51893 | 99.79332 | 89.00175 |
| Mar-10 | 107.5911 | 85.65058 | 100.9822 | 92.86752 |
| Jun-10 | 108.4907 | 88.43733 | 101.5014 | 95.12045 |
| Sep-10 | 109.3717 | 88.43325 | 102.2263 | 96.50496 |
| Dec-10 | 110.3634 | 90.60307 | 103.3819 | 98.81497 |
| Mar-11 | 110.5596 | 90.70824 | 104.1463 | 100.7451 |
| Jun-11 | 111.0672 | 89.34789 | 104.3441 | 102.6414 |
| Sep-11 | 111.5266 | 94.3473 | 105.7923 | 104.0925 |
| Dec-11 | 112.226 | 95.5257 | 106.6282 | 106.1056 |
| Mar-12 | 112.8818 | 95.34336 | 106.6622 | 109.1164 |
| Jun-12 | 113.0159 | 95.27362 | 107.0143 | 110.2545 |
| Sep-12 | 113.6978 | 94.5556 | 107.2254 | 110.2263 |
| Dec-12 | 114.3188 | 94.53112 | 107.3561 | 111.3824 |
| Mar-13 | 115.0242 | 96.13725 | 108.4624 | 112.1728 |
| Jun-13 | 116.0446 | 97.77379 | 109.1656 | 113.097 |
| Sep-13 | 116.902 | 97.43769 | 110.0601 | 113.4402 |
| Dec-13 | 117.6526 | 98.5315 | 111.1694 | 114.3949 |
| Mar-14 | 118.1885 | 98.20709 | 111.2252 | 113.3401 |
| Jun-14 | 119.3616 | 103.7539 | 112.376 | 115.0317 |
| Sep-14 | 120.1406 | 105.0573 | 112.9154 | 116.8611 |
| Dec-14 | 120.8674 | 105.3049 | 113.599 | 116.4099 |
| Mar-15 | 120.9438 | 104.9679 | 113.3161 | 111.2906 |
| Jun-15 | 121.5484 | 106.3149 | 113.1917 | 108.7847 |
| Sep-15 | 122.3583 | 107.8055 | 113.8482 | 107.5045 |
| Dec-15 | 122.8879 | 107.2249 | 113.9979 | 105.5613 |
| Mar-16 | 123.6198 | 109.4105 | 114.7746 | 104.9655 |
| Jun-16 | 124.3181 | 105.4757 | 114.3803 | 104.519 |
| Sep-16 | 125.25 | 107.8292 | 115.5491 | 104.7749 |
| Dec-16 | 126.1657 | 108.0486 | 116.3188 | 101.8943 |
| Mar-17 | 127.6491 | 108.4586 | 117.3781 | 105.0935 |
| Jun-17 | 129.0987 | 110.9775 | 118.6631 | 105.6666 |
3. Challenges and opportunities
A number of important sectors are emerging.

Description for Chart 6
| Year | All industries | Service-producing industries | Computer systems design and related services |
|---|---|---|---|
| 2007 | 100 | 100 | 100 |
| 2008 | 100.658 | 101.7724 | 105.0162 |
| 2009 | 97.34405 | 101.5909 | 107.4998 |
| 2010 | 100.4935 | 104.0376 | 107.8179 |
| 2011 | 103.7761 | 106.9405 | 114.4063 |
| 2012 | 105.6556 | 108.8885 | 114.4858 |
| 2013 | 108.2051 | 111.3587 | 121.2271 |
| 2014 | 111.0489 | 114.0158 | 129.7853 |
| 2015 | 112.2767 | 116.4955 | 138.1905 |
| 2016 | 113.9098 | 119.0093 | 148.7184 |

Description for Chart 7
| ICT manufacturing | ICT services | |
|---|---|---|
| 2007 | 5,222 | 57,248 |
| 2008 | 5,145 | 58,333 |
| 2009 | 4,546 | 57,634 |
| 2010 | 4,811 | 59,677 |
| 2011 | 4,712 | 62,355 |
| 2012 | 4,102 | 63,227 |
| 2013 | 3,469 | 64,087 |
| 2014 | 3,449 | 66,058 |
| 2015 | 3,457 | 67,413 |
| 2016 | 3,530 | 69,306 |
- Financial and insurance services
- Clean technology
- Information services
- Disruptive 'digital' goods and services
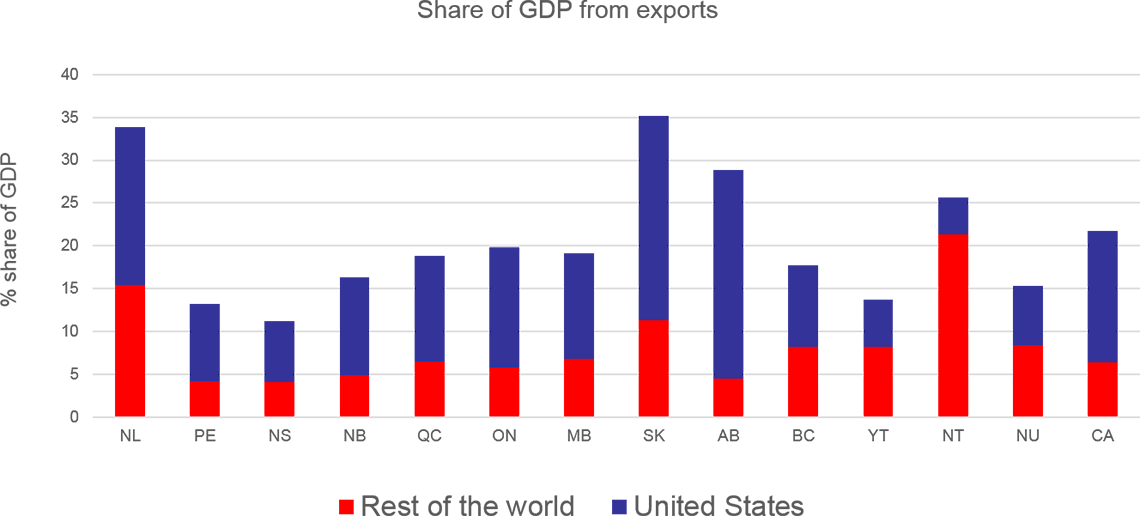
Foreign demand has been on the decline but still accounts for a large share of economic activity

Description for Chart 8
| Geography | Rest of the world | United States |
|---|---|---|
| NL | 15 | 19 |
| PE | 4 | 9 |
| NS | 4 | 7 |
| NB | 5 | 11 |
| QC | 7 | 12 |
| ON | 6 | 14 |
| MB | 7 | 12 |
| SK | 11 | 24 |
| AB | 4 | 24 |
| BC | 8 | 10 |
| YT | 8 | 6 |
| NT | 21 | 4 |
| NU | 8 | 7 |
| CA | 6 | 15 |
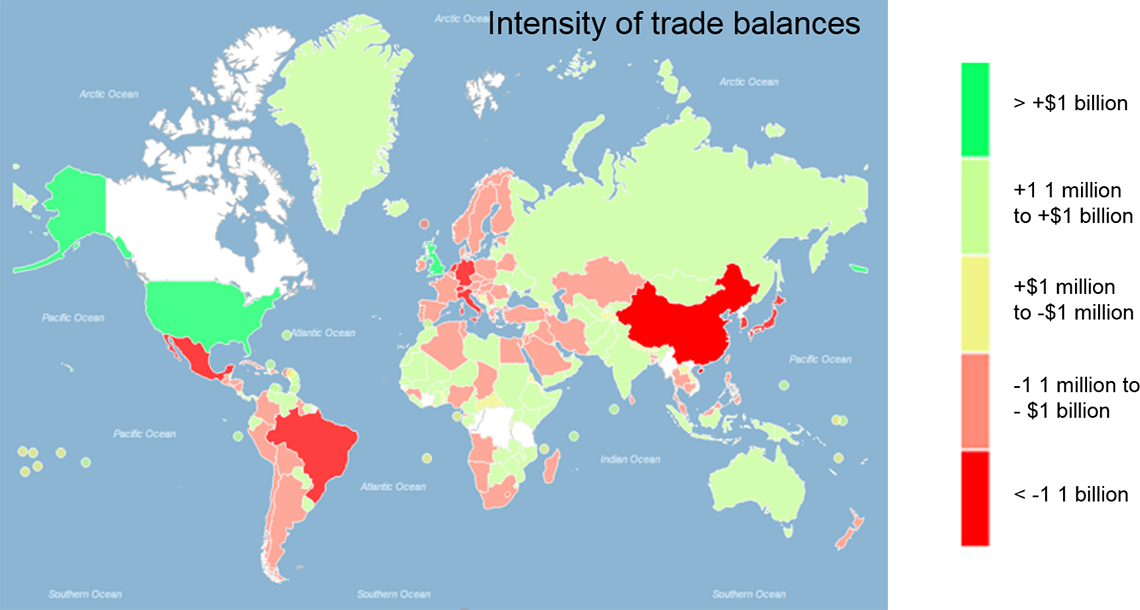
The U.S. dominates trade and investment flows

Description for Chart 9
Intensity of trade balances
Map: The U.S. dominates trade and investment flows. This a map of the world. Regions have been shaded in different colours to show the varying intensity of the trade balances for each region.
- Dark red = Less than -$1 billion
- Light red = -$1 million to -$1 billion
- Yellow = +$1 million to -$1 million
- Light green = +$1 million to +$1 billion
- Dark green = Greater than +$1 billion
Our reliance on the U.S. economy
Canada and the World Statistics Hub – United States — Employment — Activities of majority-owned affiliates

Canada and the World Statistics Hub – United States — Trade — Merchandise, by Ontario and Michigan

Description for Chart 11
Canada and the World Statistics Hub – United States
Trade – Merchandise by province and state: Ontario and Michigan, July 2017
Source(s): CANSIM table 228-0080.
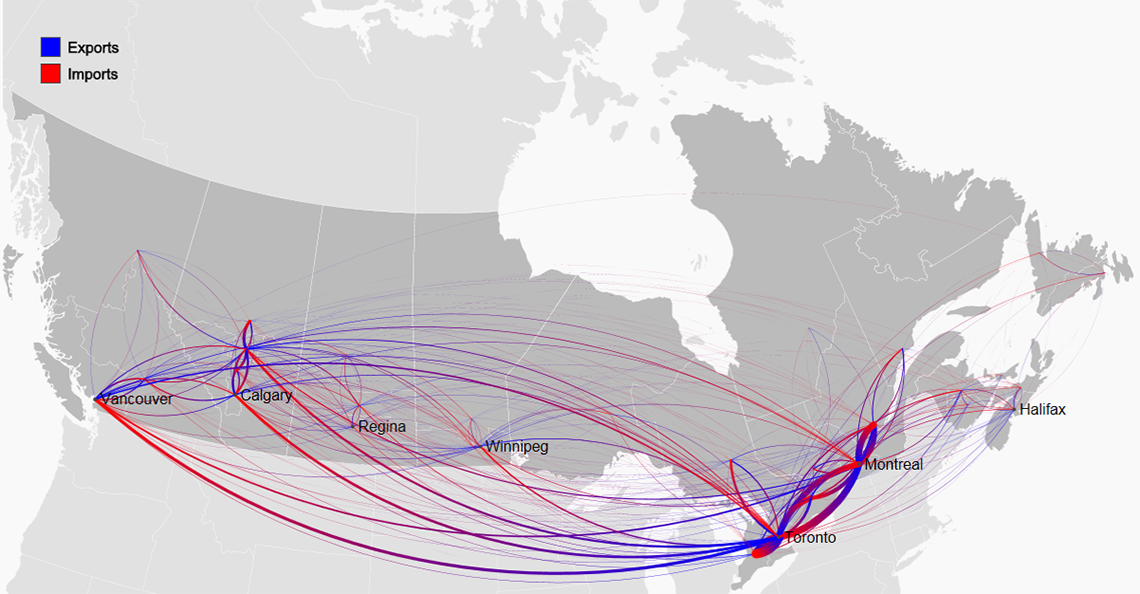
Interprovincial trade is becoming increasingly important
Visualizing domestic regional trade flows in Canada — Domestic trade flow map (divided)

Description for Chart 12
Visualizing domestic regional trade flows in Canada — Domestic trade flow map (divided)
Interprovincial trade is becoming increasingly important
Source: The data for this map references 2012, see CANSIM table 386-0004.
4. The economy and environment
Economic activity and the environment.

Description for Chart 13
| Commodities | GHG emissions |
|---|---|
| Wood pulp and newsprint | 2.44 |
| Livestock and livestock products | 2.40 |
| Paperboard | 2.35 |
| Electricity | 2.10 |
| Ammonia and chemical fertilizers | 1.82 |
| Pesticides and other agricultural chemicals | 1.76 |
| Water freight transportation services | 1.43 |
| Crude oil and natural gas | 1.37 |
| Cement | 1.37 |
| Meat products | 1.34 |
| Iron and steel basic shapes and ferro-alloy products | 1.33 |
| Grains | 1.32 |
5. What it means for Canadians
Employment growth has been in step with economic growth in recent years

Description for Chart 14
| Geography | Average annual rate of employment growth, 2010-2015 | Annual employment growth, 2016 |
|---|---|---|
| Source: Statistics Canada, CANSIM table: 282-0002. | ||
| Canada | 1.2 | 0.7 |
| NL | 1.6 | -1.5 |
| PE | 1.2 | -2.3 |
| NS | 0.0 | -0.4 |
| NB | -0.4 | -0.1 |
| QC | 1.0 | 0.9 |
| ON | 1.2 | 1.1 |
| MB | 1.0 | -0.4 |
| SK | 1.5 | -0.9 |
| AB | 2.1 | -1.6 |
| BC | 0.9 | 3.2 |
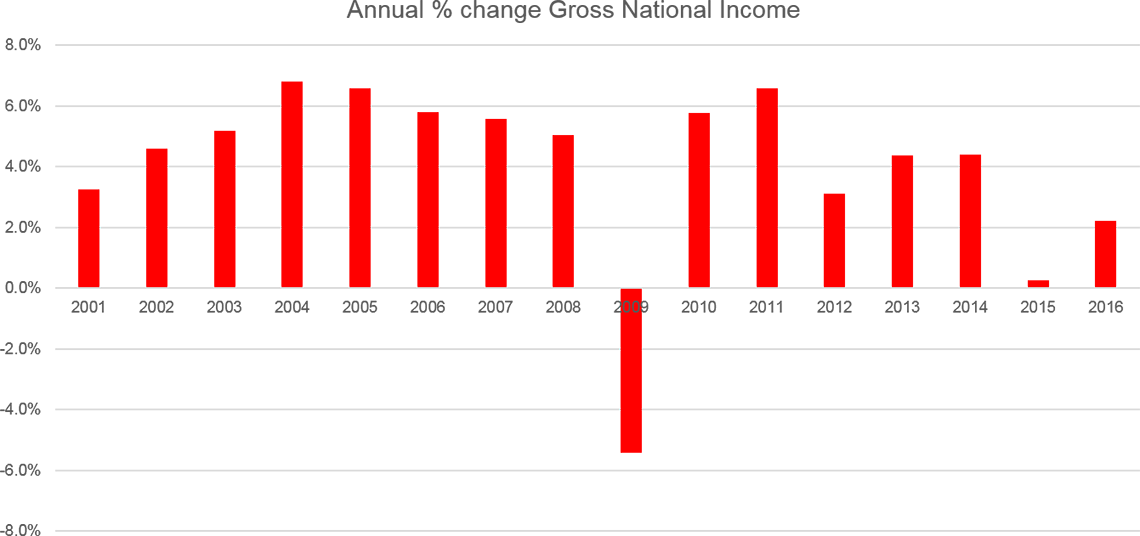
The impact of commodity prices on national income

Description for Chart 15
| Year | Annual % Change Gross National Income |
|---|---|
| 2001 | 3.3% |
| 2002 | 4.6% |
| 2003 | 5.2% |
| 2004 | 6.8% |
| 2005 | 6.6% |
| 2006 | 5.8% |
| 2007 | 5.6% |
| 2008 | 5.0% |
| 2009 | -5.4% |
| 2010 | 5.8% |
| 2011 | 6.6% |
| 2012 | 3.1% |
| 2013 | 4.4% |
| 2014 | 4.4% |
| 2015 | 0.3% |
| 2016 | 2.2% |
Households are taking on more debt, but debt service costs are significantly lower than previous decades

Description for Chart 16
| Geography | 1991 | 2015 |
|---|---|---|
| Canada | 10.8 | 6.39 |
| Newfoundland and Labrador | 8.21 | 4.96 |
| Prince Edward Island | 10.6 | 5.41 |
| Nova Scotia | 10.74 | 5.81 |
| New Brunswick | 9.41 | 4.9 |
| Quebec | 10.24 | 5.78 |
| Ontario | 11.42 | 6.9 |
| Manitoba | 9.54 | 5.27 |
| Saskatchewan | 10.87 | 5.64 |
| Alberta | 10.13 | 6 |
| British Columbia | 11.47 | 7.21 |
| Yukon | 8.21 | 4.87 |
| Northwest Territories | 3.81 | |
| Nunavut | 1.91 | |
| Northwest Territories Inc. Nunavut | 5.11 |
The distribution of national net worth by net worth quintile

Description for Chart 17
| Quintile | Canada (1999) | U.S. (1998) |
|---|---|---|
| Quintile 1 | -0.30% | |
| Quintile 2 | 2.60% | 1.40% |
| Quintile 3 | 8.80% | 5.10% |
| Quintile 4 | 20.10% | 12.40% |
| Quintile 5 | 68.60% | 81.40% |
| Quintile | Canada (2012) | U.S. (2013) |
|---|---|---|
| Quintile 1 | -0.10% | -0.70% |
| Quintile 2 | 2.20% | 0.60% |
| Quintile 3 | 9.00% | 3.20% |
| Quintile 4 | 21.50% | 9.80% |
| Quintile 5 | 67.40% | 87.00% |
6. Moving forward
Statistics Canada is responding to complex demands of the economy and society
- Greater access to data
- More detailed data
- More responsive data
- Greater capacity to use data
- Foreign ownership of residential housing
- Detailed geographic information on housing values and financing
- Clean technology and the transition towards a low-carbon economy
- Non-medical consumption of cannabis
- The emerging 'digital' economy
- Culture and tourism
- The size, value and state of Canada's infrastructure
- Foreign investment and trade business dynamics and productivity
- Date modified:
