
Satisfaction with time use, 2022
Release date: March 19, 2026
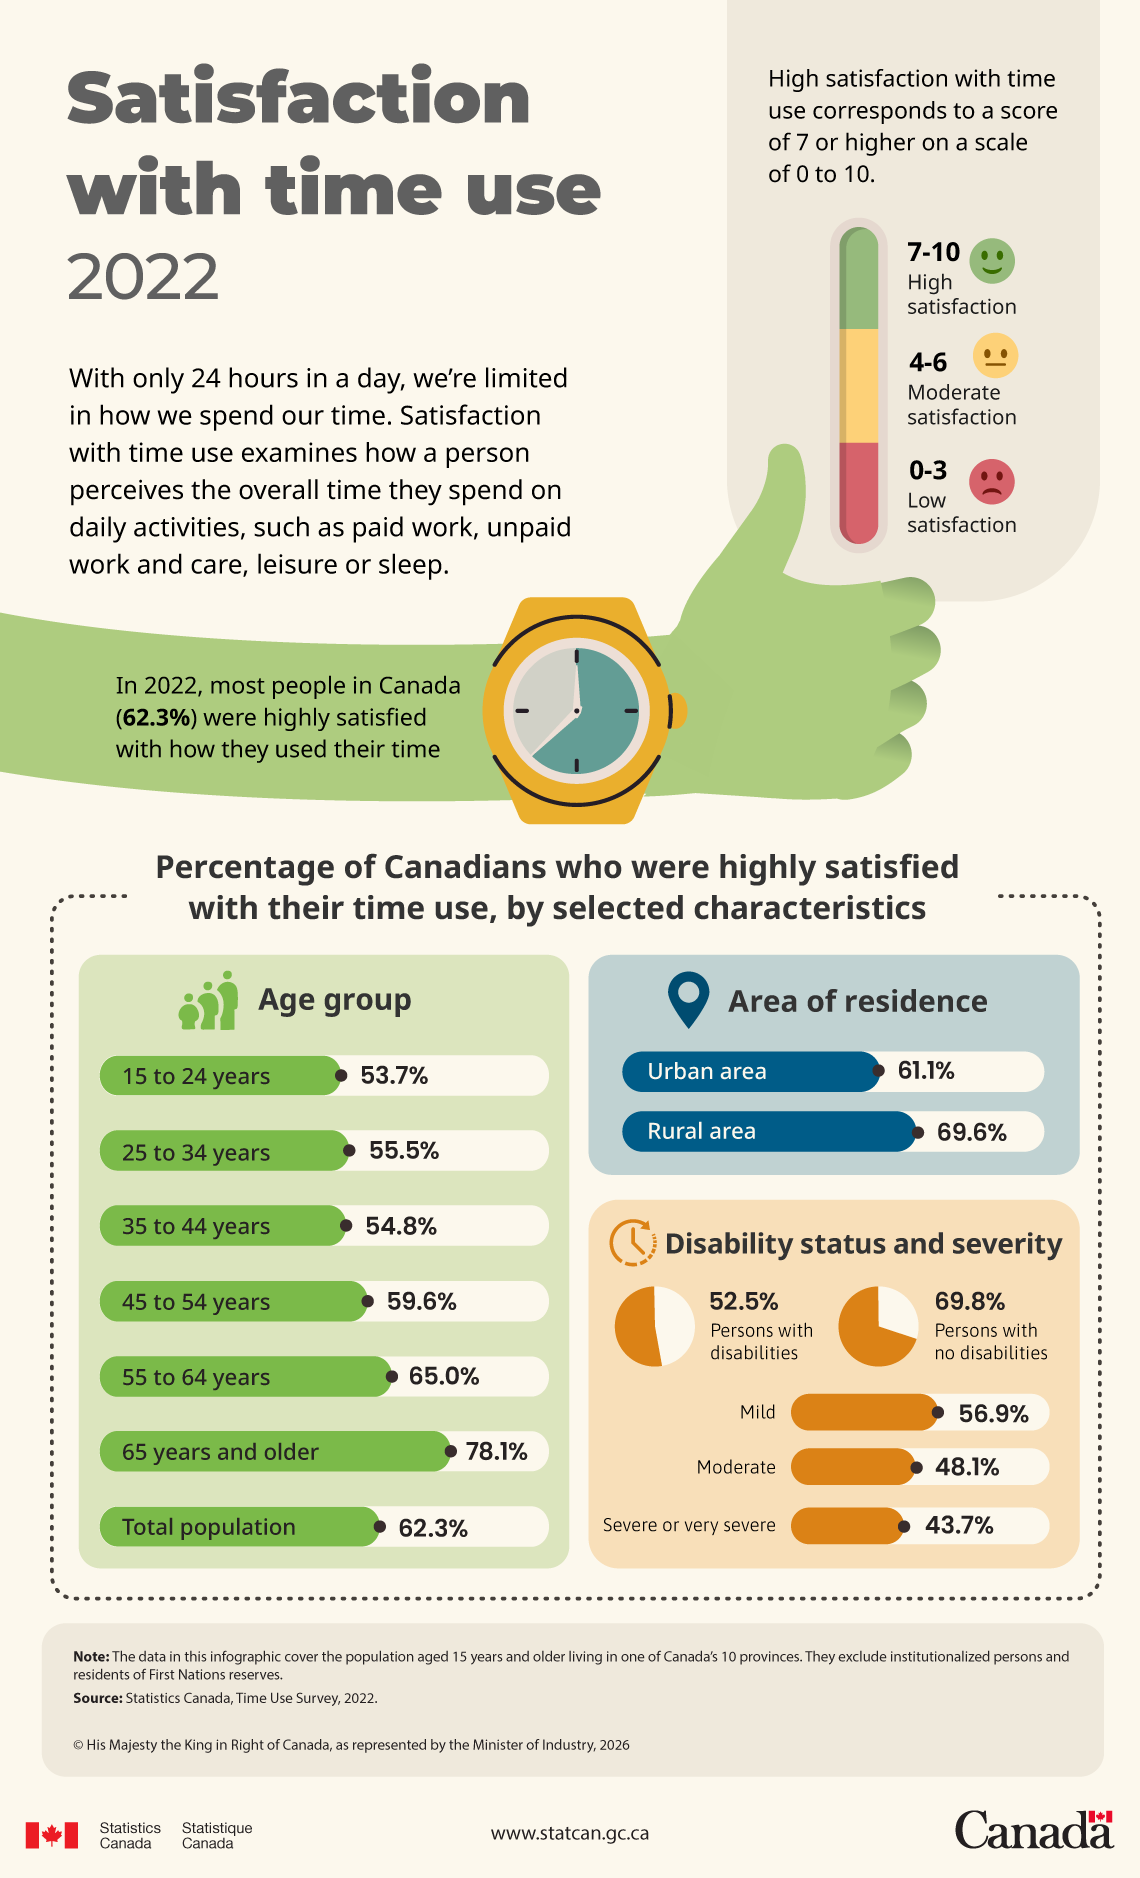
Description: Satisfaction with time use, 2022
With only 24 hours in a day, we’re limited in how we spend our time. Satisfaction with time use examines how a person perceives the overall time they spend on daily activities, such as paid work, unpaid work and care, leisure or sleep.
High satisfaction with time use corresponds to a score of 7 or higher on a scale of 0 to 10.
| 7 – 10 | High satisfaction |
|---|---|
| 4 – 6 | Moderate satisfaction |
| 0 – 3 | Low satisfaction |
In 2022, most people in Canada (62.3%) were highly satisfied with how they used their time.
| Age group | % |
|---|---|
| 15 to 24 years | 53.7% |
| 25 to 34 years | 55.5% |
| 35 to 44 years | 54.8% |
| 45 to 54 years | 59.6% |
| 55 to 64 years | 65.0% |
| 65 years and older | 78.1% |
| Total population | 62.3% |
| Area of residence | % |
|---|---|
| Urban area | 61.1% |
| Rural area | 69.6% |
| Disability status and severity | % |
|---|---|
| Persons with no disabilities | 69.8% |
| Persons with disabilities | 52.5% |
| Mild | 56.9% |
| Moderate | 48.1% |
| Severe or very severe | 43.7% |
Note: The data in this infographic cover the population aged 15 years and older living in one of Canada’s 10 provinces. They exclude institutionalized persons and residents of First Nations reserves.
Source: Statistics Canada, Time Use Survey, 2022.
- Date modified: