
Life satisfaction in Canada, 2023

Archived Content
Information identified as archived is provided for reference, research or recordkeeping purposes. It is not subject to the Government of Canada Web Standards and has not been altered or updated since it was archived. Please "contact us" to request a format other than those available.
Description: Life satisfaction in Canada, 2023
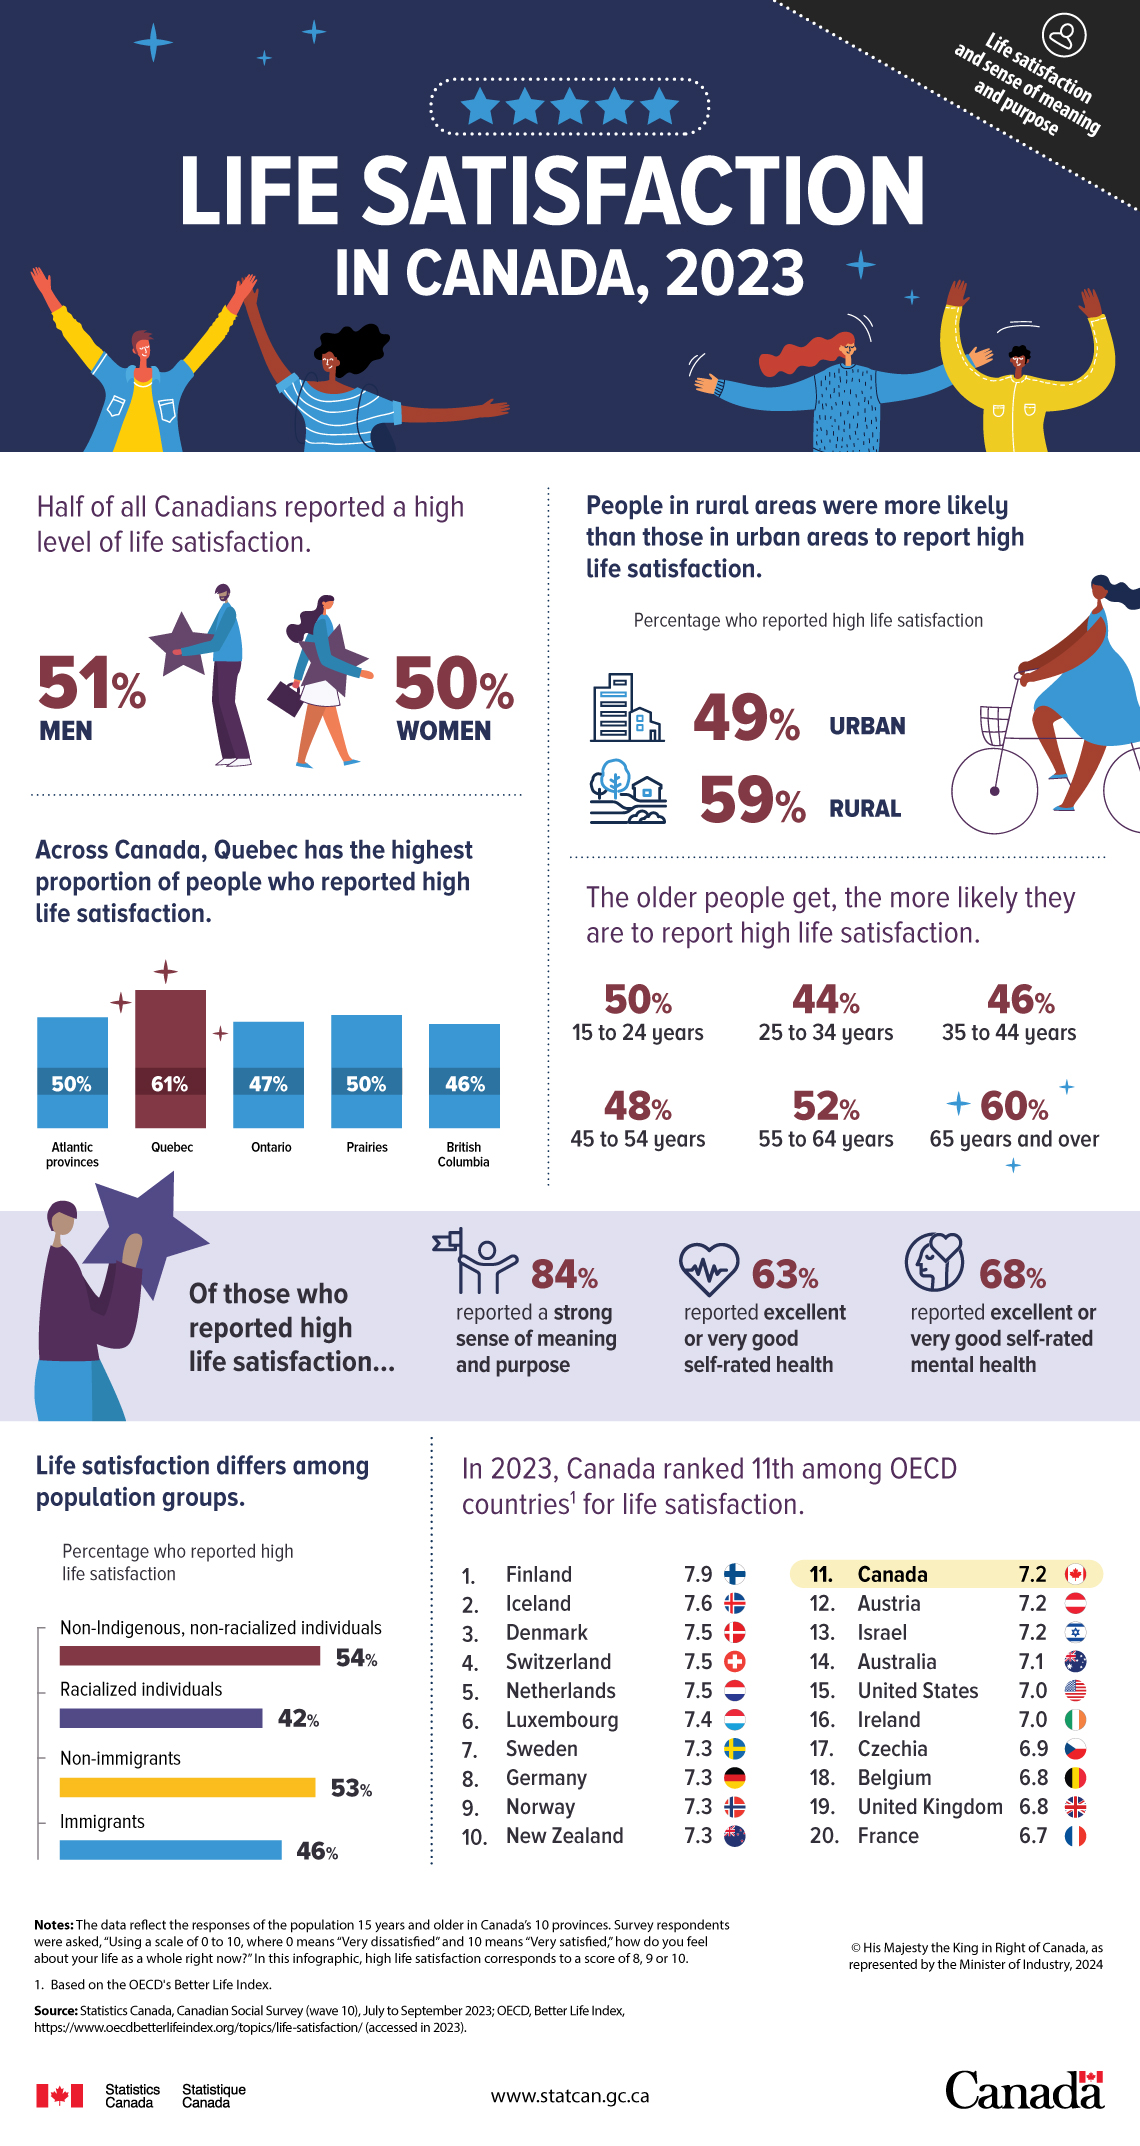
Half of all Canadians reported a high level of life satisfaction.
| Percentage who reported high life satisfaction | |
|---|---|
| Men | 51% |
| Women | 50% |
Across Canada, Quebec has the highest proportion of people who reported high life satisfaction.
| Percentage who reported high life satisfaction | |
|---|---|
| Atlantic provinces | 50% |
| Quebec | 61% |
| Ontario | 47% |
| Prairies | 50% |
| British Columbia | 46% |
People in rural areas were more likely than those in urban areas to report high life satisfaction.
| Percentage who reported high life satisfaction | |
|---|---|
| Urban | 49% |
| Rural | 59% |
The older people get, the more likely they are to report high life satisfaction.
| Percentage who reported high life satisfaction | |
|---|---|
| 15 to 24 years | 50% |
| 25 to 34 years | 44% |
| 35 to 44 years | 46% |
| 45 to 54 years | 48% |
| 55 to 64 years | 52% |
| 65 years and over | 60% |
Of those who reported high life satisfaction…
- 84% reported a strong sense of meaning and purpose
- 63% reported excellent or very good self-rated health
- 68% reported excellent or very good self-rated mental health
Life satisfaction differs among population groups.
| Percentage who reported high life satisfaction | |
|---|---|
| Non-Indigenous, non-racialized individuals | 54% |
| Racialized individuals | 42% |
| Non-immigrants | 53% |
| Immigrants | 46% |
In 2023, Canada ranked 11th among OECD countriesNote 1 for life satisfaction.
| Average life satisfaction score | |
|---|---|
| Finland | 7.9 |
| Iceland | 7.6 |
| Denmark | 7.5 |
| Switzerland | 7.5 |
| Netherlands | 7.5 |
| Luxembourg | 7.4 |
| Sweden | 7.3 |
| Germany | 7.3 |
| Norway | 7.3 |
| New Zealand | 7.3 |
| Canada | 7.2 |
| Austria | 7.2 |
| Israel | 7.2 |
| Australia | 7.1 |
| United States | 7 |
| Ireland | 7 |
| Czechia | 6.9 |
| Belgium | 6.8 |
| United Kingdom | 6.8 |
| France | 6.7 |
Notes: The data reflect the responses of the population 15 years and older in Canada’s 10 provinces. Survey respondents were asked, “Using a scale of 0 to 10, where 0 means “Very dissatisfied” and 10 means “Very satisfied,” how do you feel about your life as a whole right now?” In this infographic, high life satisfaction corresponds to a score of 8, 9 or 10.
Source: Statistics Canada, Canadian Social Survey (wave 10), July to September 2023; OECD, Better Life Index (accessed in 2023).
- Date modified: