
Gender representation among Canadian members of Parliament and Cabinet

Archived Content
Information identified as archived is provided for reference, research or recordkeeping purposes. It is not subject to the Government of Canada Web Standards and has not been altered or updated since it was archived. Please "contact us" to request a format other than those available.
Description: Gender representation among Canadian members of Parliament and Cabinet
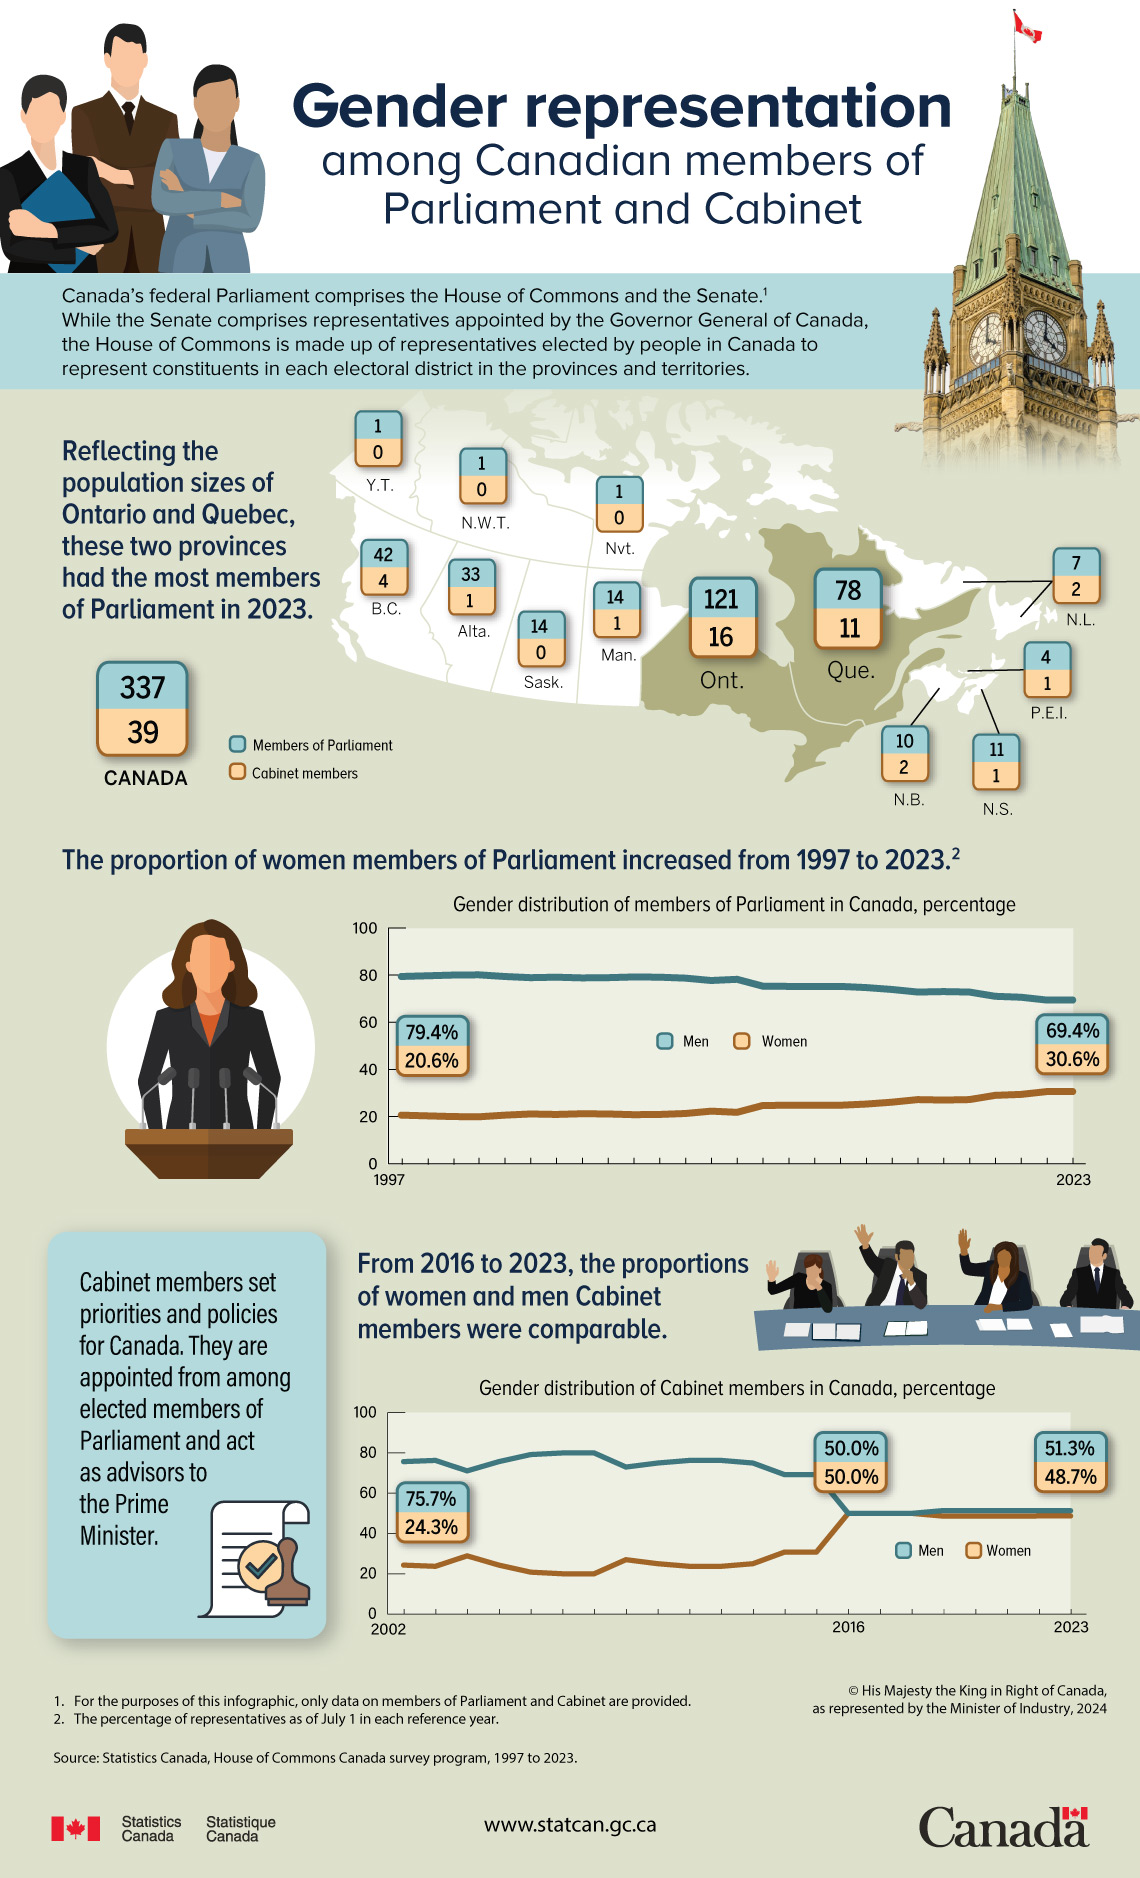
Canada’s federal Parliament comprises the House of Commons and the Senate.Note 1 While the Senate comprises representatives appointed by the Governor General of Canada, the House of Commons is made up of representatives elected by people in Canada to represent constituents in each electoral district in the provinces and territories.
| Region | Members of Parliament | Cabinet members |
|---|---|---|
| Canada | 337 | 39 |
| Newfoundland and Labrador | 7 | 2 |
| Prince Edward Island | 4 | 1 |
| Nova Scotia | 11 | 1 |
| New Brunswick | 10 | 2 |
| Quebec | 78 | 11 |
| Ontario | 121 | 16 |
| Manitoba | 14 | 1 |
| Saskatchewan | 14 | 0 |
| Alberta | 33 | 1 |
| British Columbia | 42 | 4 |
| Yukon | 1 | 0 |
| Northwest Territories | 1 | 0 |
| Nunavut | 1 | 0 |
| 0 true zero or a value rounded to zero | ||
The proportion of women members of Parliament has increased from 1997 to 2023.Note 2
| Year | Men | Women |
|---|---|---|
| 1997 | 79.4 | 20.6 |
| 1998 | 79.7 | 20.3 |
| 1999 | 80.0 | 20.0 |
| 2000 | 80.1 | 19.9 |
| 2001 | 79.4 | 20.6 |
| 2002 | 78.9 | 21.1 |
| 2003 | 79.1 | 20.9 |
| 2004 | 78.8 | 21.2 |
| 2005 | 78.9 | 21.1 |
| 2006 | 79.2 | 20.8 |
| 2007 | 79.1 | 20.9 |
| 2008 | 78.7 | 21.3 |
| 2009 | 77.7 | 22.3 |
| 2010 | 78.2 | 21.8 |
| 2011 | 75.3 | 24.7 |
| 2012 | 75.2 | 24.8 |
| 2013 | 75.2 | 24.8 |
| 2014 | 75.2 | 24.8 |
| 2015 | 74.7 | 25.3 |
| 2016 | 73.9 | 26.1 |
| 2017 | 72.8 | 27.2 |
| 2018 | 73.0 | 27.0 |
| 2019 | 72.8 | 27.2 |
| 2020 | 71.0 | 29.0 |
| 2021 | 70.6 | 29.4 |
| 2022 | 69.4 | 30.6 |
| 2023 | 69.4 | 30.6 |
Cabinet members set priorities and policies for Canada. They are appointed from among the elected members of Parliament and act as advisors to the Prime Minister.
From 2016 to 2023, the proportions of women and men Cabinet members were comparable.
| Year | Men | Women |
|---|---|---|
| 2002 | 75.7 | 24.3 |
| 2003 | 76.3 | 23.7 |
| 2004 | 71.1 | 28.9 |
| 2005 | 75.7 | 24.3 |
| 2006 | 79.2 | 20.8 |
| 2007 | 80.0 | 20.0 |
| 2008 | 80.0 | 20.0 |
| 2009 | 73.0 | 27.0 |
| 2010 | 75.0 | 25.0 |
| 2011 | 76.3 | 23.7 |
| 2012 | 76.3 | 23.7 |
| 2013 | 75.0 | 25.0 |
| 2014 | 69.2 | 30.8 |
| 2015 | 69.2 | 30.8 |
| 2016 | 50.0 | 50.0 |
| 2017 | 50.0 | 50.0 |
| 2018 | 50.0 | 50.0 |
| 2019 | 51.4 | 48.6 |
| 2020 | 51.4 | 48.6 |
| 2021 | 51.4 | 48.6 |
| 2022 | 51.3 | 48.7 |
| 2023 | 51.3 | 48.7 |
Source: Statistics Canada, House of Commons Canada survey program, 1997 to 2023.
- Date modified: