
Interprovincial Trade in Canada, third quarter of 2023

Archived Content
Information identified as archived is provided for reference, research or recordkeeping purposes. It is not subject to the Government of Canada Web Standards and has not been altered or updated since it was archived. Please "contact us" to request a format other than those available.
Description: Interprovincial Trade in Canada, third quarter of 2023
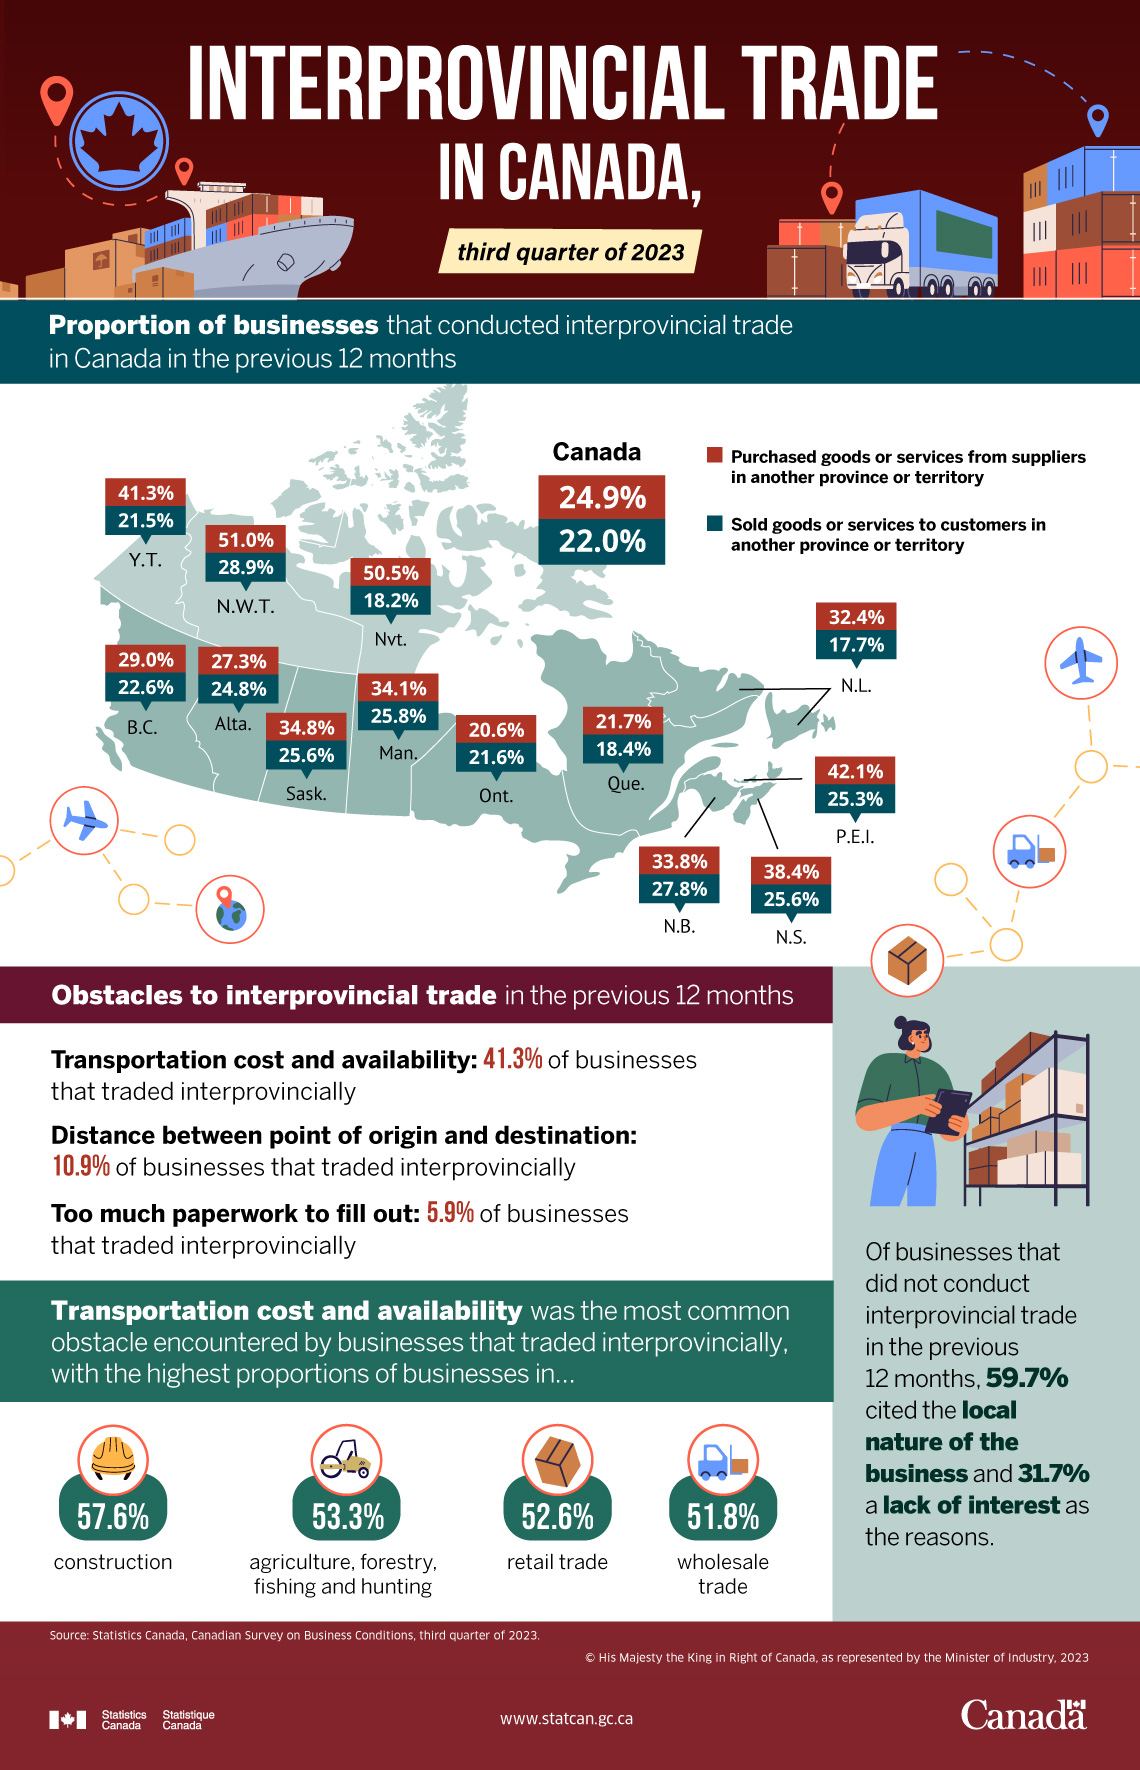
| Purchased goods or services from suppliers in another province or territory | Sold goods or services to customers in another province or territory | |
|---|---|---|
| % of businesses | ||
| Canada | 24.9% | 22.0% |
| Newfoundland and Labrador | 32.4% | 17.7% |
| Prince Edward Island | 42.1% | 25.3% |
| Nova Scotia | 38.4% | 25.6% |
| New Brunswick | 33.8% | 27.8% |
| Quebec | 21.7% | 18.4% |
| Ontario | 20.6% | 21.6% |
| Manitoba | 34.1% | 25.8% |
| Saskatchewan | 34.8% | 25.6% |
| Alberta | 27.3% | 24.8% |
| British Columbia | 29.0% | 22.6% |
| Yukon | 41.3% | 21.5% |
| Northwest Territories | 51.0% | 28.9% |
| Nunavut | 50.5% | 18.2% |
Obstacles to interprovincial trade in the previous 12 months
- Transportation cost and availability: 41.3% of businesses that traded interprovincially
- Distance between point of origin and destination: 10.9% of businesses that traded interprovincially
- Too much paperwork to fill out: 5.9% of businesses that traded interprovincially
Transportation cost and availability was the most common obstacle encountered by businesses that traded interprovincially, with the highest proportions of businesses in…
- Construction: 57.6%
- Agriculture, forestry, fishing and hunting: 53.3%
- Retail trade: 52.6%
- Wholesale trade: 51.8%
Of businesses that did not conduct interprovincial trade in the previous 12 months, 59.7% cited the local nature of the business and 31.7% a lack of interest as the reasons.
Source: Statistics Canada, Canadian Survey on Business Conditions, third quarter of 2023.
- Date modified: