Intersectional perspective on the gender wage gap in Canada, 2007 to 2022

Description: Intersectional perspective on the gender wage gap in Canada, 2007 to 2022
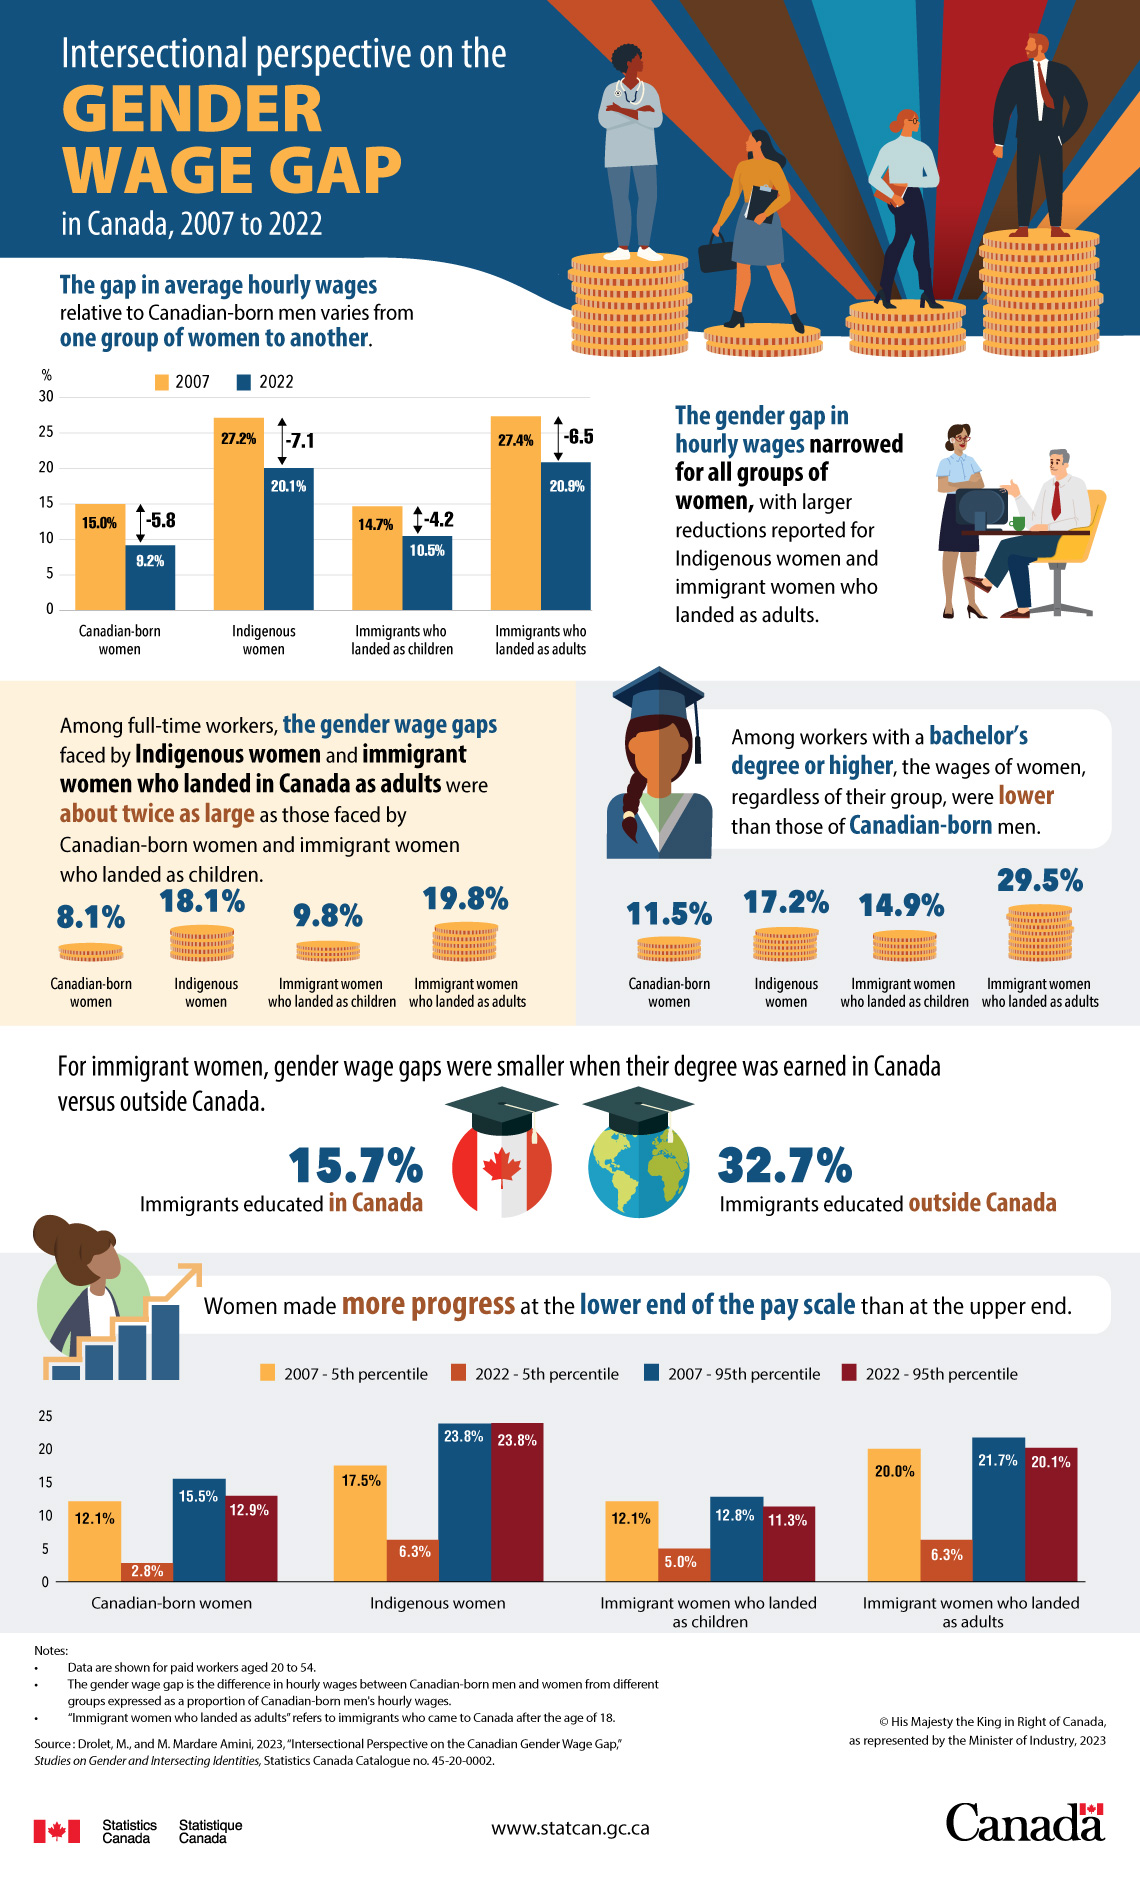
The gap in average hourly wages relative to Canadian-born men varies from one group of women to another.
| 2007 | 2022 | Change in percentage points | |
|---|---|---|---|
| Canadian-born women | 15.0% | 9.2% | -5.8 |
| Indigenous women | 27.2% | 20.1% | -7.1 |
| Immigrant women who landed as children | 14.7% | 10.5% | -4.2 |
| Immigrant women who landed as adults | 27.4% | 20.9% | -6.5 |
The gender gap in hourly wages narrowed for all groups of women, with larger reductions reported for Indigenous women and immigrant women who landed as adults.
Among full-time workers, the gender wage gaps faced by Indigenous women and immigrant women who landed in Canada as adults were about twice as large as those faced by Canadian-born women and immigrant women who landed as children.
- Canadian-born women: 8.1%
- Indigenous women: 18.1%
- Immigrant women who landed as children: 9.8%
- Immigrant women who landed as adults: 19.8%
Among workers with a bachelor’s degree or higher, the wages of women, regardless of their group, were lower than those of Canadian-born men.
- Canadian-born women: 11.5%
- Indigenous women: 17.2%
- Immigrant women who landed as children: 14.9%
- Immigrant women who landed as adults: 29.5%
For immigrant women, gender wage gaps were smaller when their degree was earned in Canada versus outside Canada.
- Immigrant women educated in Canada: 15.7%
- Immigrant women educated outside Canada: 32.7%
Women made more progress at the lower end of the pay scale than at the upper end.
| Canadian-born women | Indigenous women | Immigrant women who landed as children | Immigrant women who landed as adults | |
|---|---|---|---|---|
| 2007 | ||||
| 5th percentile | 12.1% | 17.5% | 12.1% | 20.0% |
| 95th percentile | 15.5% | 23.8% | 12.8% | 21.7% |
| 2022 | ||||
| 5th percentile | 2.8% | 6.3% | 5.0% | 6.3% |
| 95th percentile | 12.9% | 23.8% | 11.3% | 20.1% |
Notes: Data are shown for paid workers aged 20 to 54.
The gender wage gap is the difference in hourly wages between Canadian-born men and women from different groups expressed as a proportion of Canadian-born men’s hourly wages. “Immigrants who landed as adults” are immigrants who came to Canada after the age of 18.
Source:Drolet, M., and M. Mardare Amini, 2023, “Intersectional Perspective on the Canadian Gender Wage Gap,” Studies on Gender and Intersecting Identities, Statistics Canada, Catalogue no: 45200002.
- Date modified: