
Police-reported crime in Canada, 2022

Archived Content
Information identified as archived is provided for reference, research or recordkeeping purposes. It is not subject to the Government of Canada Web Standards and has not been altered or updated since it was archived. Please "contact us" to request a format other than those available.
Description: Police-reported crime in Canada, 2022
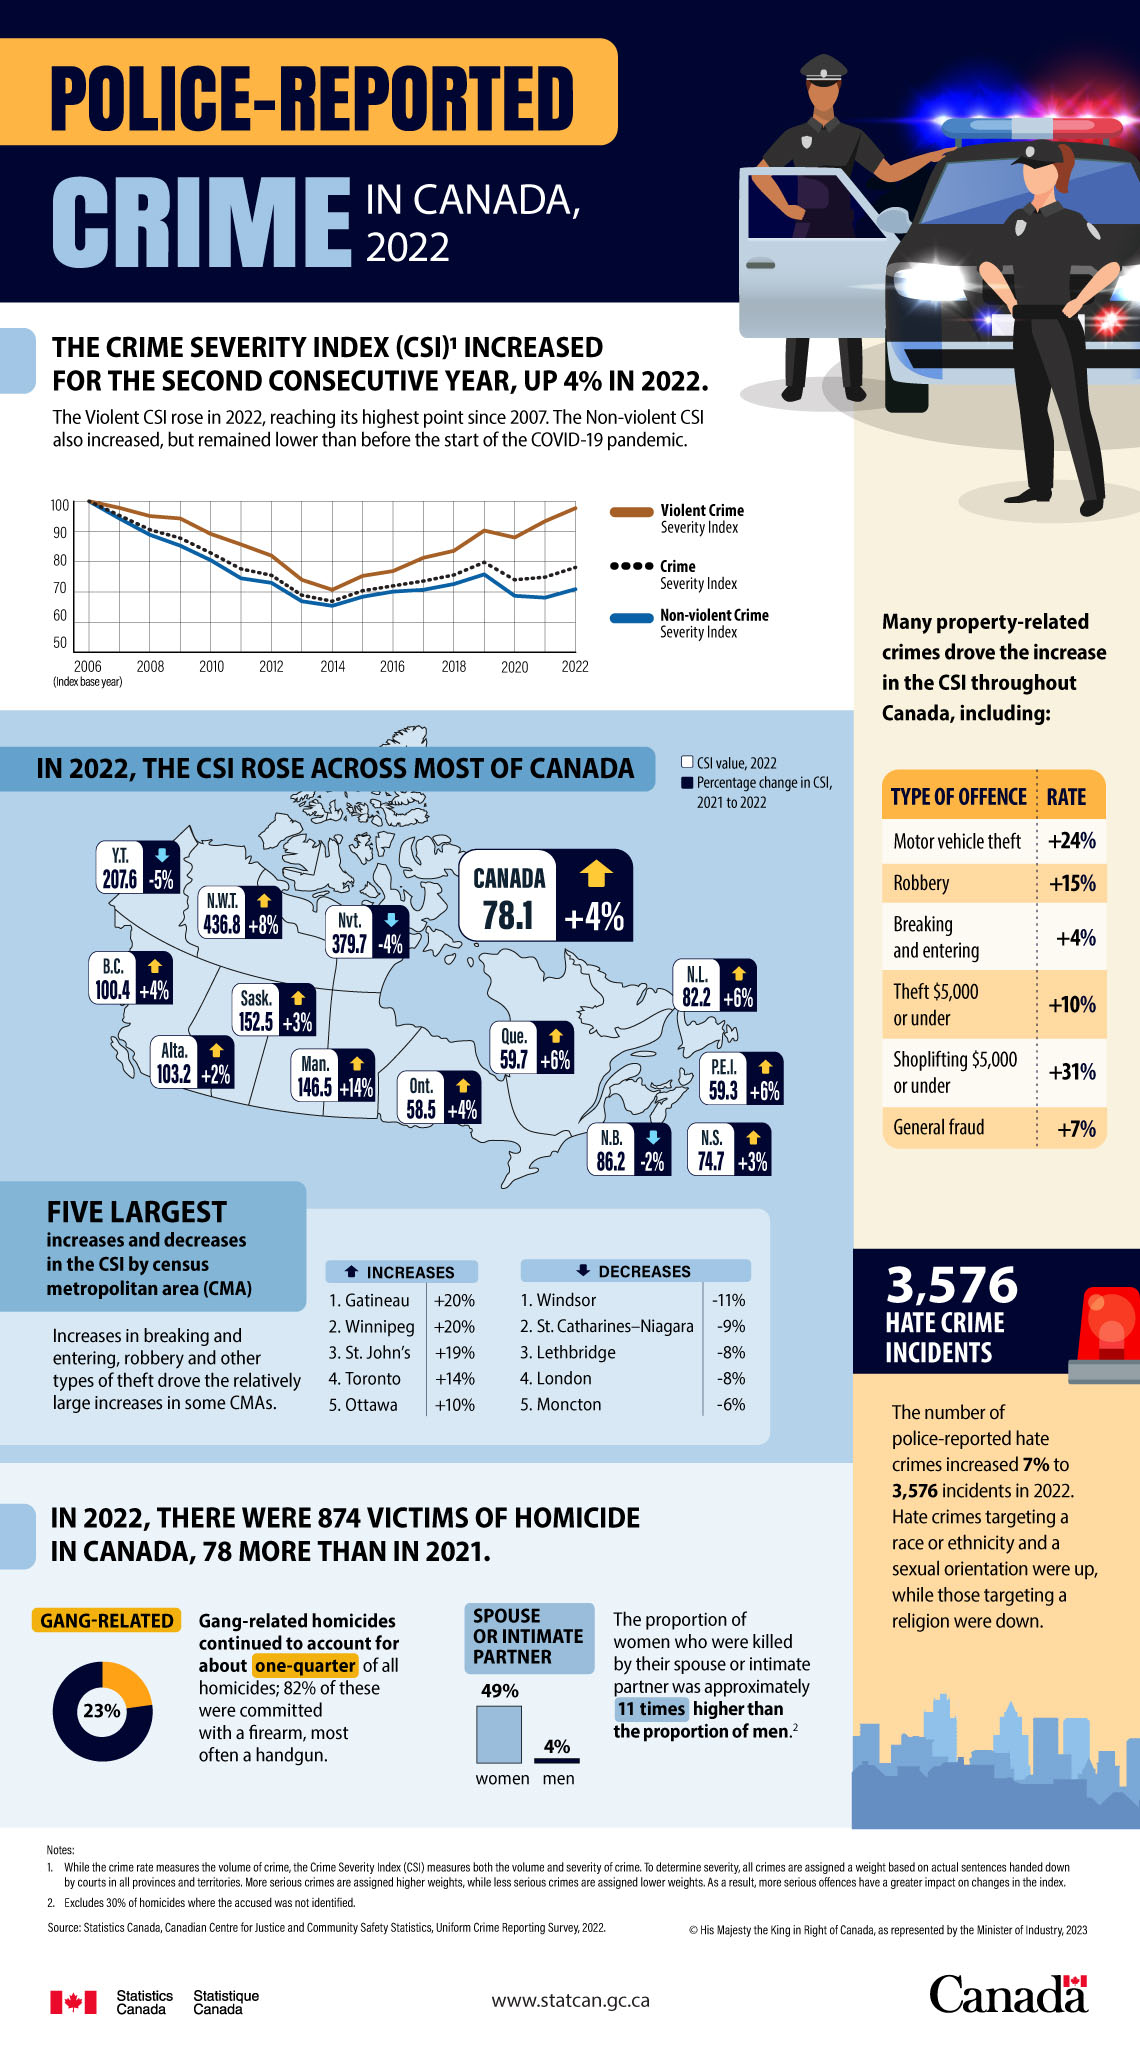
The Crime Severity Index (CSI)Note 1 increased for the second consecutive year, up 4% in 2022. The Violent CSI rose in 2022, reaching its highest point since 2007. The Non-violent CSI also increased, but remained lower than before the start of the COVID-19 pandemic.
| Year | Crime Severity IndexTable 1 Note 1 | Violent Crime Severity IndexTable 1 Note 1 | Non-violent Crime Severity IndexTable 1 Note 1 |
|---|---|---|---|
| 2006 *Index base year | 100 | 100 | 100 |
| 2007 | 95.3 | 97.8 | 94.3 |
| 2008 | 90.6 | 95.1 | 88.9 |
| 2009 | 87.8 | 94.3 | 85.3 |
| 2010 | 82.9 | 89.2 | 80.5 |
| 2011 | 77.6 | 85.7 | 74.5 |
| 2012 | 75.5 | 82 | 73 |
| 2013 | 68.9 | 74 | 66.9 |
| 2014 | 66.9 | 70.7 | 65.4 |
| 2015 | 70.4 | 75.3 | 68.4 |
| 2016 | 72 | 76.9 | 70.1 |
| 2017 | 73.6 | 81.3 | 70.7 |
| 2018 | 75.6 | 83.6 | 72.6 |
| 2019 | 79.8 | 90.3 | 75.8 |
| 2020 | 74 | 88 | 68.7 |
| 2021 | 74.9 | 93.4 | 68.1 |
| 2022 | 78.1 | 97.7 | 70.9 |
In 2022, the CSI rose across most of Canada
| Province or territory | CSI value, 2022 | Percentage change in CSI, 2021 to 2022 |
|---|---|---|
| Newfoundland and Labrador | 82.2 | +6% |
| Prince Edward Island | 59.3 | +6% |
| Nova Scotia | 74.7 | +3% |
| New Brunswick | 86.2 | -2% |
| Quebec | 59.7 | +6% |
| Ontario | 58.5 | +4% |
| Manitoba | 146.5 | +14% |
| Saskatchewan | 152.5 | +3% |
| Alberta | 103.2 | +2% |
| British Columbia | 100.4 | +4% |
| Yukon | 207.6 | -5% |
| Northwest Territories | 436.8 | +8% |
| Nunavut | 379.7 | -4% |
| Canada | 78.1 | +4% |
Many property-related crimes drove the increase in the CSI throughout Canada, including:
| Type of offence | Rate |
|---|---|
| Motor vehicle theft | Rate +24% |
| Robbery | Rate +15% |
| Breaking and entering | Rate +4% |
| Theft $5,000 or under | Rate +10% |
| Shoplifting $5,000 or under | Rate +31% |
| General fraud | Rate +7% |
3,576 hate crime incidents
- The number of police-reported hate crimes increased 7% to 3,576 incidents in 2022. Hate crimes targeting a race or ethnicity and a sexual orientation were up, while those targeting a religion were down.
In 2022, there were 874 victims of homicide in Canada, 78 more than in 2021.
Gang-related 23%: Gang-related homicides continued to account for about one-quarter of all homicides; 82% of these were committed with a firearm, most often a handgun.
Spouse or intimate partner, women (49%) versus men (4%): The proportion of women who were killed by their spouse or intimate partner was approximately 11 times higher than the proportion of men.Note 2
Five largest increases and decreases in the CSI by census metropolitan area (CMA)
| Census metropolitan area | Percentage change in CSI, 2021 to 2022 |
|---|---|
| Top 5 increases by CMA | |
| Gatineau | +20% |
| Winnipeg | +20% |
| St. John’s | +19% |
| Toronto | +14% |
| Ottawa | +10% |
| Top 5 decreases by CMA | |
| Windsor | -11% |
| St. Catharines-Niagara | -9% |
| Lethbridge | -8% |
| London | -8% |
| Moncton | -6% |
Increases in breaking and entering, robbery and other types of theft drove the relatively large increases in some CMAs.
Source: Statistics Canada, Canadian Centre for Justice and Community Safety Statistics, Uniform Crime Reporting Survey, 2022.
- Date modified: