A portrait of non-permanent residents in Canada

Infographic: A portrait of non-permanent residents in Canada
Description: A portrait of non-permanent residents in Canada


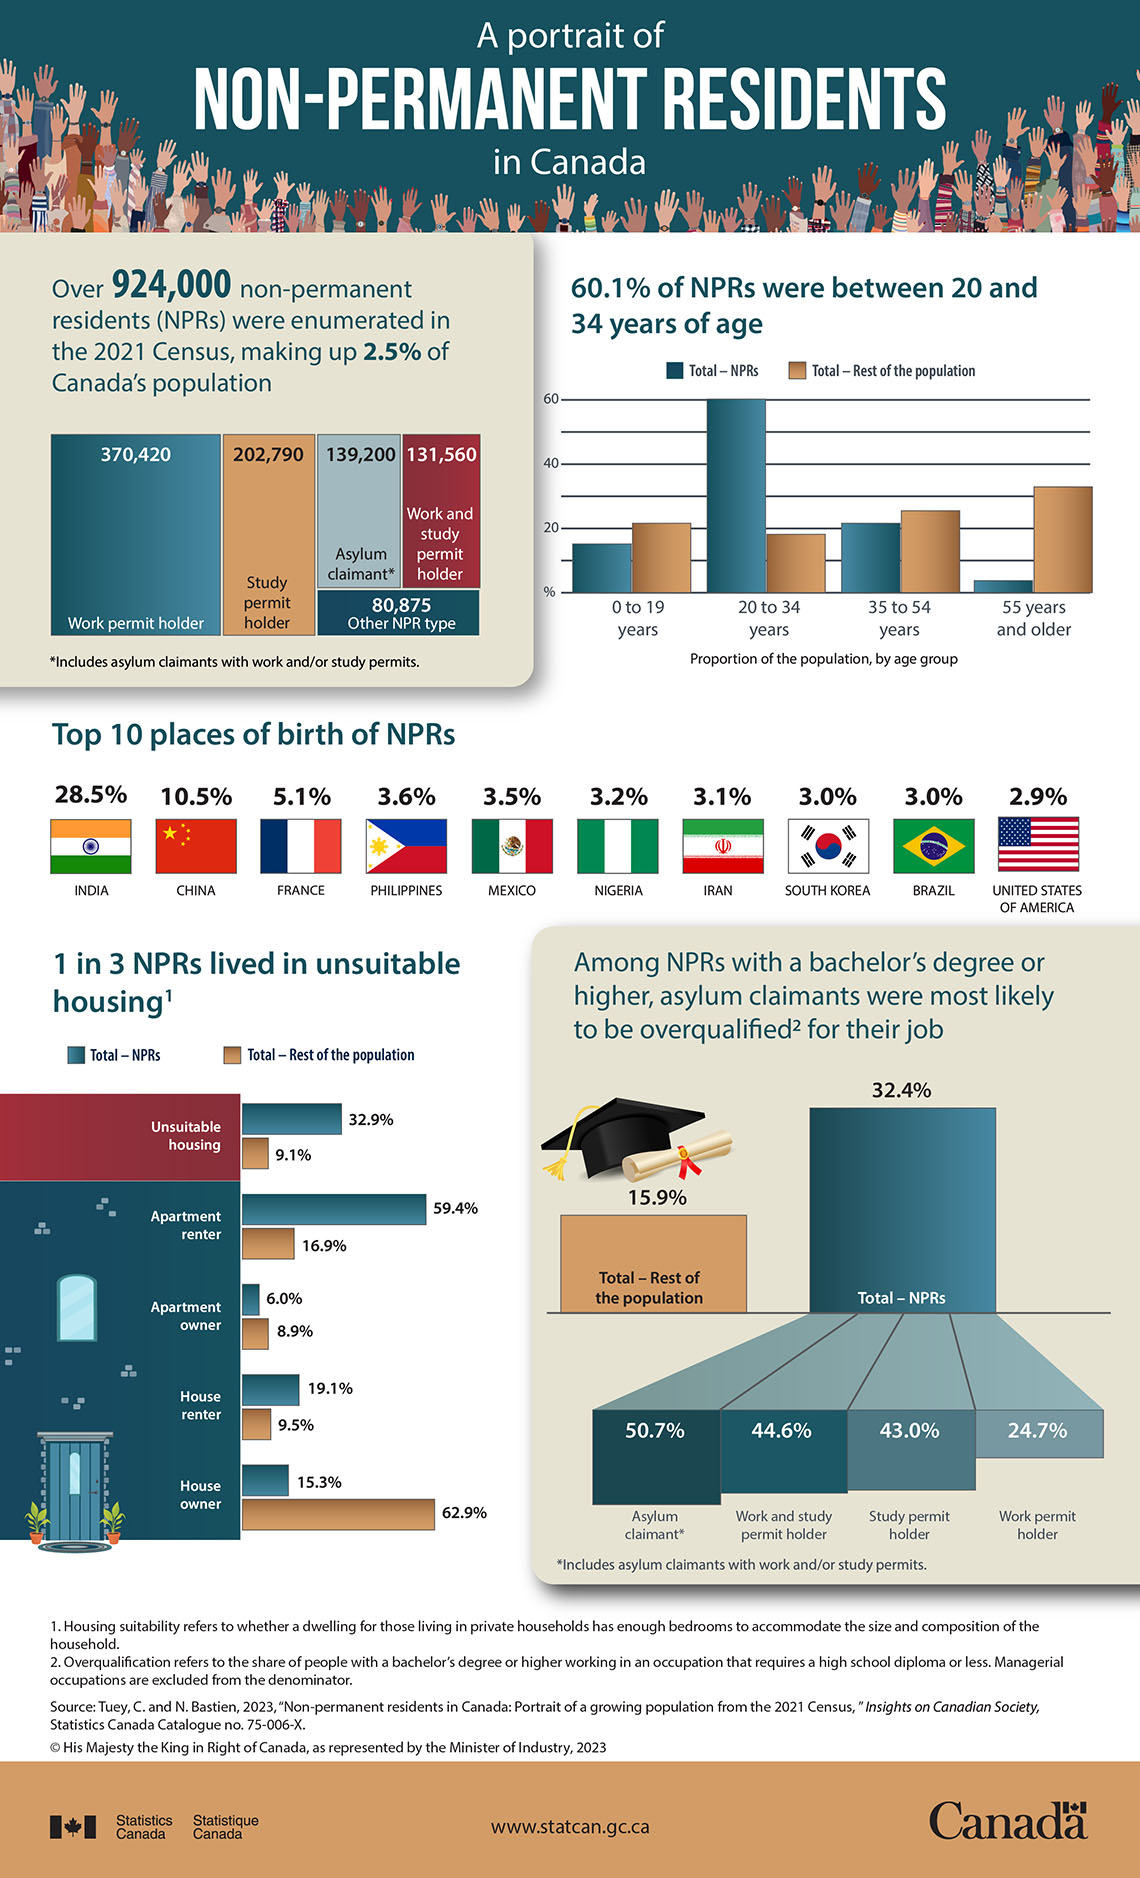
Over 924,000 non-permanent residents (NPRs) were enumerated in the 2021 Census, making up 2.5% of Canada’s population
Table summary
This table displays the results of Over 924. The information is grouped by Resident type (appearing as row headers), Number of non-permanents (appearing as column headers).
Non-permanent resident type Number of non-permanent residents
Work permit holder 370,420
Study permit holder 202,790
Asylum claimantNote * 139,200
Work and study permit holder 131,560
Other NPR type 80,875

60.1% of NPRs were between 20 and 34 years of age


Proportion of the population, by age group
Table summary
This table displays the results of Proportion of the population. The information is grouped by Age group (appearing as row headers), Total – NPRs and Total - Rest of the population (appearing as column headers).
Age group Total – NPRs Total - Rest of the population
0 to 19 years 15.4% 22.2%
20 to 34 years 60.1% 18.4%
35 to 54 years 21.8% 26.3%
55 years and older 2.7% 33.1%

Top 10 places of birth of NPRs
Table summary
This table displays the results of Top 10 places of birth of NPRs. The information is grouped by Country of birth (appearing as row headers), Proportion of NPRs (%) (appearing as column headers).
Country of birth Proportion of NPRs (%)
India 28.5%
China 10.5%
France 5.1%
Philippines 3.6%
Mexico 3.5%
Nigeria 3.2%
Iran 3.1%
South Korea 3.0%
Brazil 3.0%
United States of America 2.9%

1 in 3 NPRs lived in unsuitable housingNote 1
Table summary
This table displays the results of 1 in 3 NPRs lived in unsuitable housing. The information is grouped by  Type of dwelling (appearing as row headers), Total – NPRs and Total - Rest of the population (appearing as column headers).
 Type of dwelling Total – NPRs Total - Rest of the population
Unsuitable housing 32.9% 9.1%
Apartment renter 59.4% 16.9%
Apartment owner 6.0% 8.9%
House renter 19.1% 9.5%
House owner 15.3% 62.9%

Among NPRs with a bachelor’s degree or higher, asylum claimants were most likely to be overqualifiedNote 2 for their job
Table summary
This table displays the results of Among NPRs with a bachelor’s degree or higher. The information is grouped by NPR type (appearing as row headers), Overqualification rate (appearing as column headers).
NPR type Overqualification rate
Total - Rest of the population 15.9%
Total – NPRs 32.4%
Asylum claimantNote * 50.7%
Work and study permit holder 44.6%
Study permit holder 43.0%
Work permit holder 24.7%

Source: Tuey, C. and N. Bastien, 2023, “Non-permanent residents in Canada: Portrait of a growing population from the 2021 Census,” Insights on Canadian Society, Statistics Canada Catalogue no. 75-006-X.

Date modified: