
Federal business innovation and growth support for clean technology, 2020

Archived Content
Information identified as archived is provided for reference, research or recordkeeping purposes. It is not subject to the Government of Canada Web Standards and has not been altered or updated since it was archived. Please "contact us" to request a format other than those available.
Description: Federal business innovation and growth support for clean technology, 2020
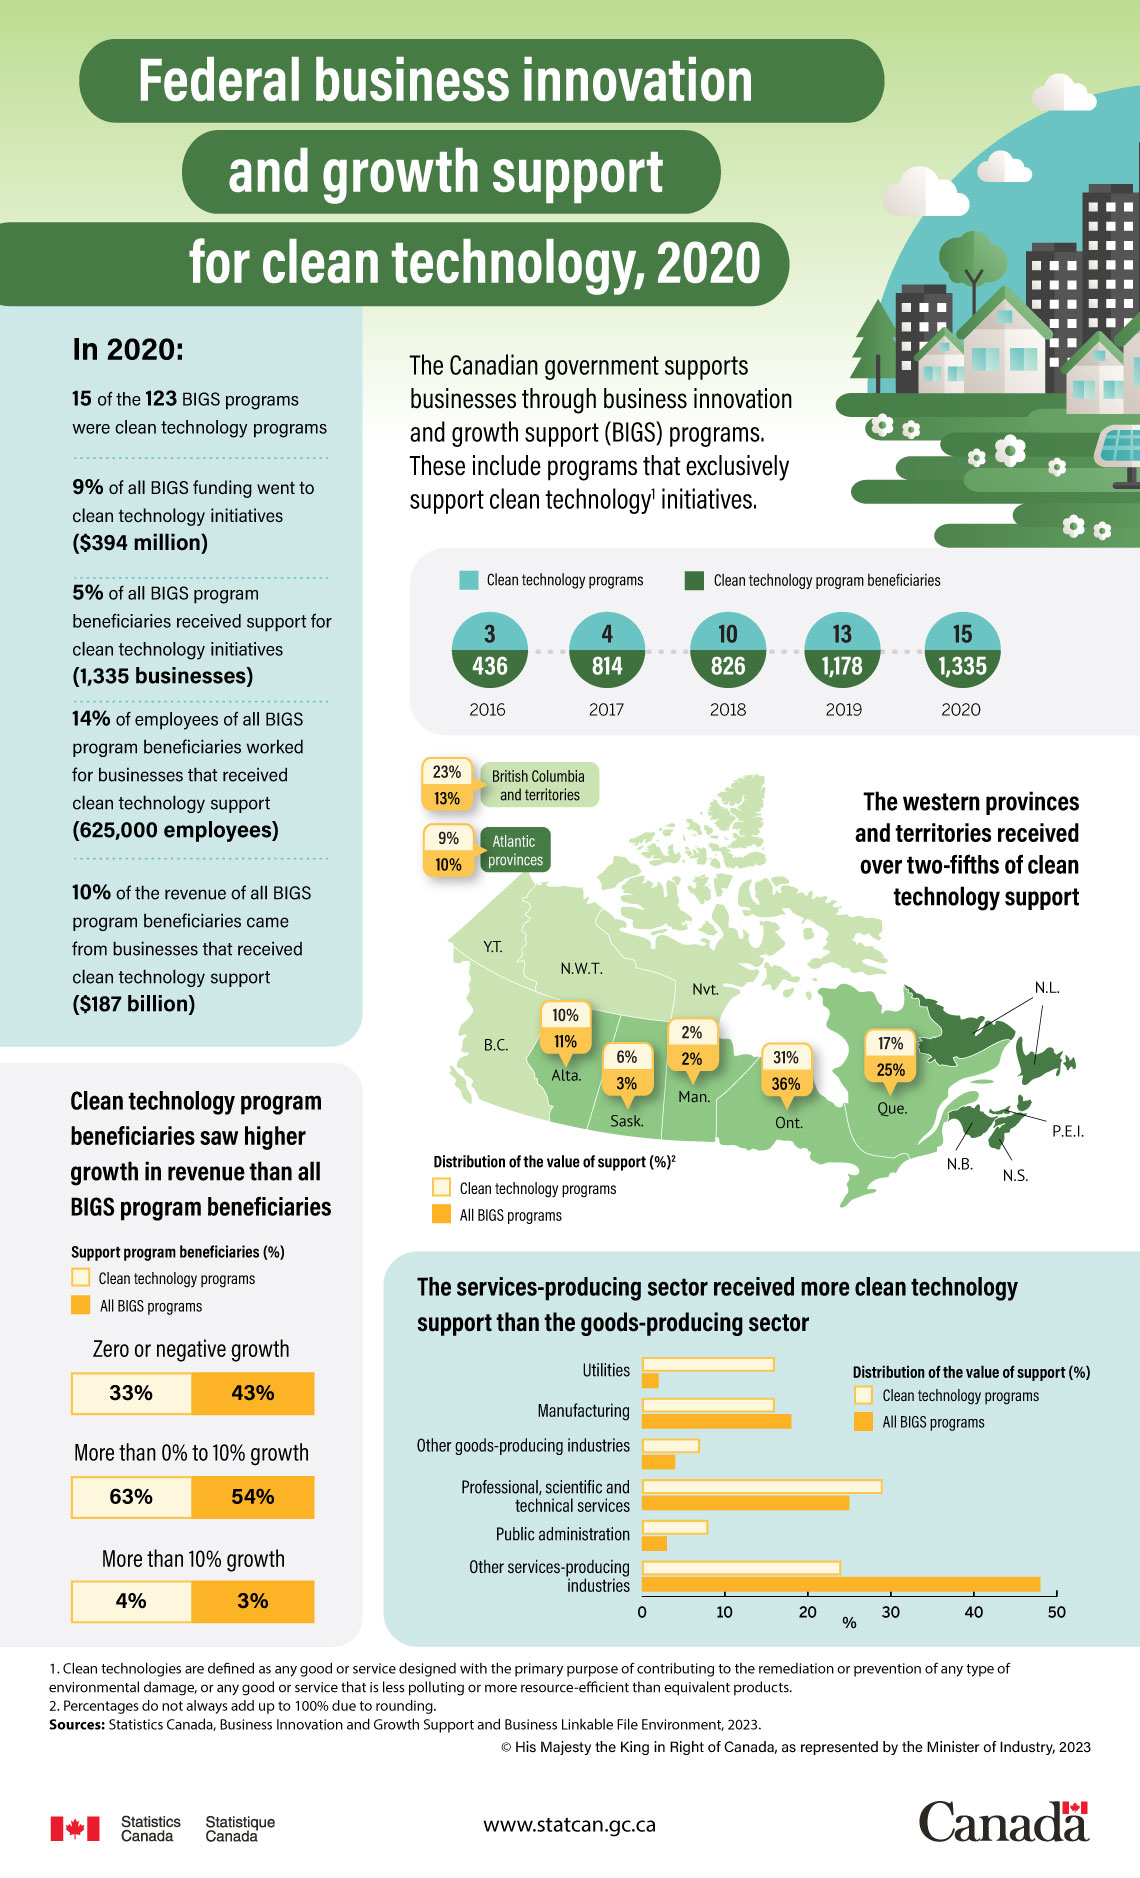
The Canadian government supports businesses through business innovation and growth support (BIGS) programs. These include programs that exclusively support clean technologyNote 1 initiatives.
| 2016 | 2017 | 2018 | 2019 | 2020 | |
|---|---|---|---|---|---|
| Clean technology programs | 3 | 4 | 10 | 13 | 15 |
| Clean technology program beneficiaries | 436 | 814 | 826 | 1,178 | 1,335 |
In 2020:
15 of the 123 BIGS programs were clean technology programs
9% of all BIGS funding went to clean technology initiatives ($394 million)
5% of all BIGS program beneficiaries received support for clean technology initiatives (1,335 businesses)
14% of employees of all BIGS program beneficiaries worked for businesses that received clean technology support (625,000 employees)
10% of the revenue of all BIGS program beneficiaries came from businesses that received clean technology support ($187 billion)
| Province or territory | Distribution of the value of support (%)Note 2 | |
|---|---|---|
| Clean technology programs | All BIGS programs | |
| Atlantic provinces | 9% | 10% |
| Quebec | 17% | 25% |
| Ontario | 31% | 36% |
| Manitoba | 2% | 2% |
| Saskatchewan | 6% | 3% |
| Alberta | 10% | 11% |
| British Columbia and territories | 23% | 13% |
| Industry | Distribution of the value of support (%) | |
|---|---|---|
| Clean technology programs | All BIGS programs | |
| Utilities | 16% | 2% |
| Manufacturing | 16% | 18% |
| Other goods-producing industries | 7% | 4% |
| Professional, scientific and technical services | 29% | 25% |
| Public administration | 8% | 3% |
| Other services-producing industries | 24% | 48% |
| Support program beneficiaries (%) | ||
|---|---|---|
| Clean technology programs | All BIGS programs | |
| Zero or negative growth | 33% | 43% |
| More than 0% to 10% growth | 63% | 54% |
| More than 10% growth | 4% | 3% |
Sources: Statistics Canada, Business Innovation and Growth Support and Business Linkable File Environment, 2023.
- Date modified: