Child and spousal support payments during the pandemic

Description: Child and spousal support payments during the pandemic
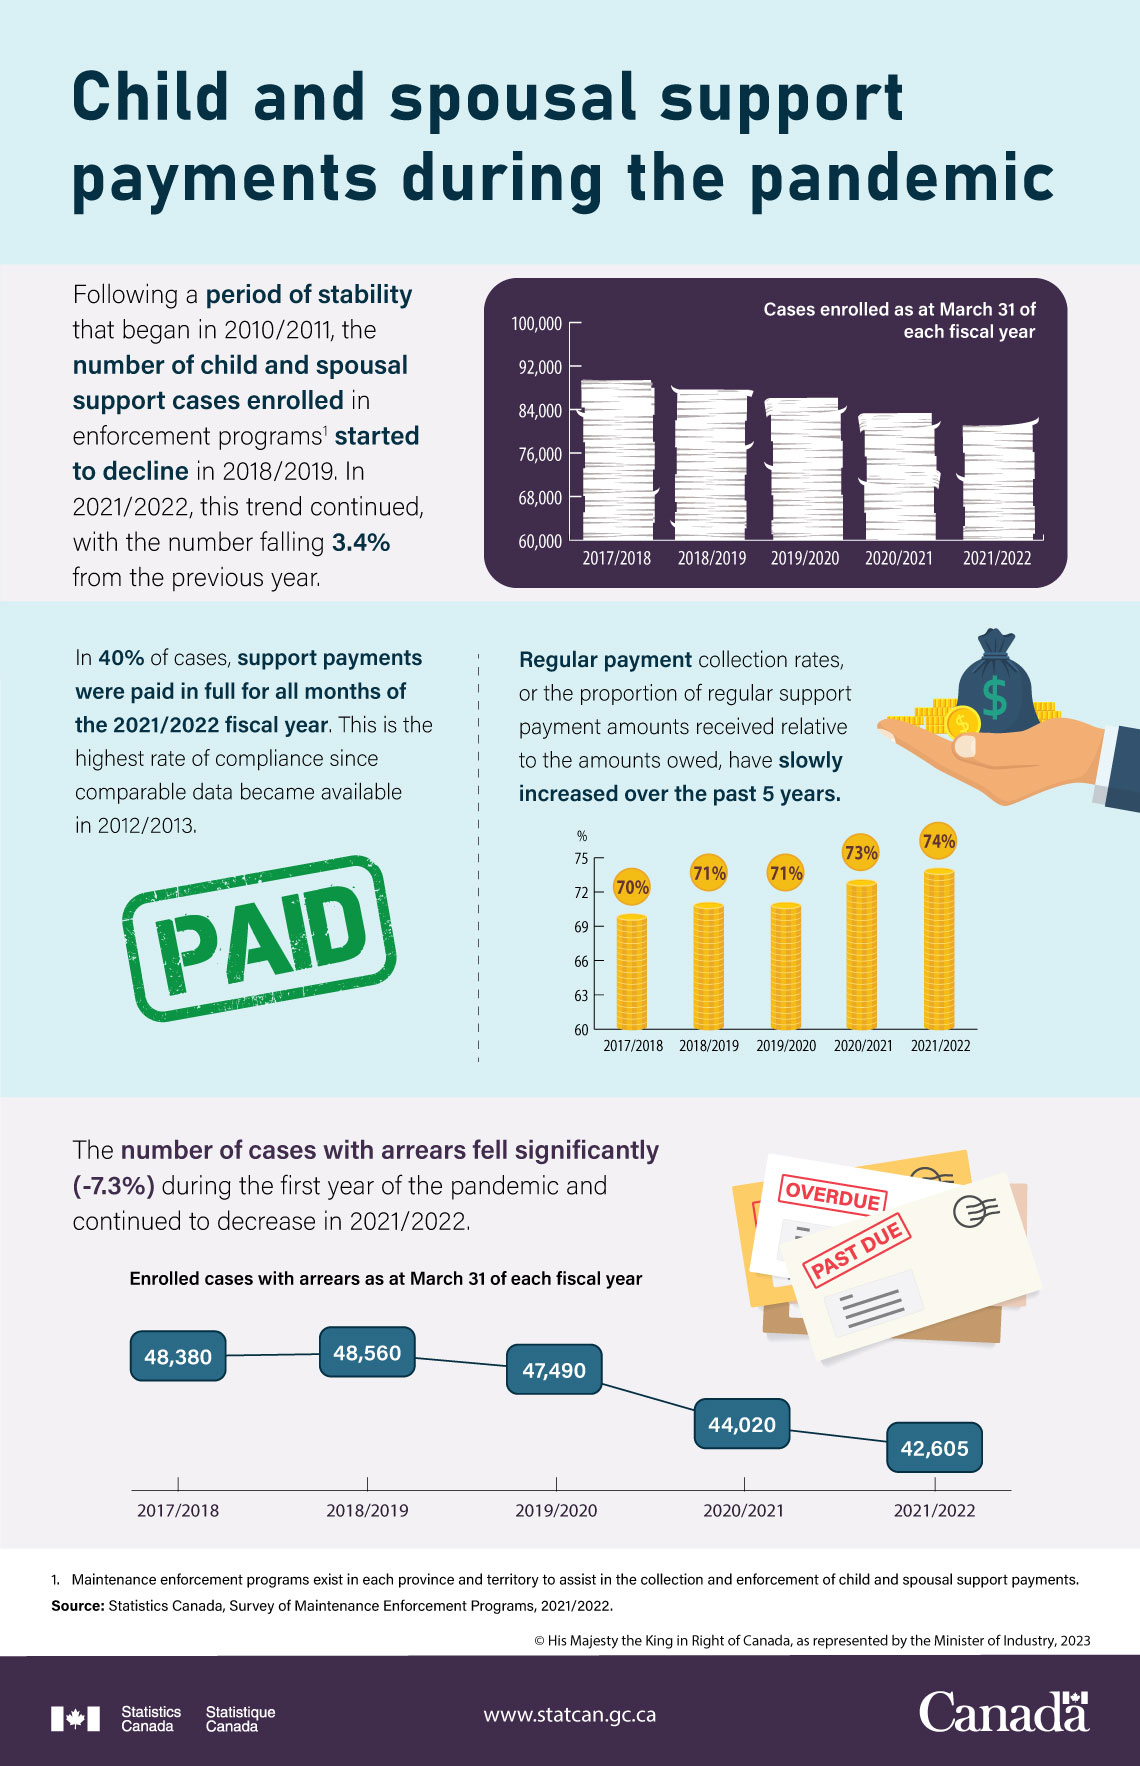
Following a period of stability that began in 2010/2011, the number of child and spousal support cases enrolled in enforcement programsNote started to decline in 2018/2019. In 2021/2022, this trend continued, with the number falling 3.4% from the previous year.
| 2017/2018 | 2018/2019 | 2019/2020 | 2020/2021 | 2021/2022 | |
|---|---|---|---|---|---|
| Cases enrolled as at March 31 of each fiscal year | 89,045 | 87,555 | 86,235 | 83,265 | 80,450 |
In 40% of cases, support payments were paid in full for all months of the 2021/2022 fiscal year. This is the highest rate of compliance since comparable data became available in 2012/2013.
Regular payment collection rates, or the proportion of regular support payment amounts received relative to the amounts owed, have slowly increased over the past 5 years.
| 2017/2018 | 2018/2019 | 2019/2020 | 2020/2021 | 2021/2022 | |
|---|---|---|---|---|---|
| Regular Payment Collection Rates | 70% | 71% | 71% | 73% | 74% |
The number of cases with arrears fell significantly (-7.3%) during the year of the pandemic and continued to decrease in 2021/2022.
| 2017/2018 | 2018/2019 | 2019/2020 | 2020/2021 | 2021/2022 | |
|---|---|---|---|---|---|
| Enrolled cases with arrears as at March 31 of each fiscal year | 48,380 | 48,560 | 47,490 | 44,020 | 42,605 |
Source: Statistics Canada, Survey of Maintenance Enforcement Programs, 2021/2022
- Date modified: