
Alcohol and cannabis sales in Canada, April 2021 to March 2022
Release date: February 24, 2023
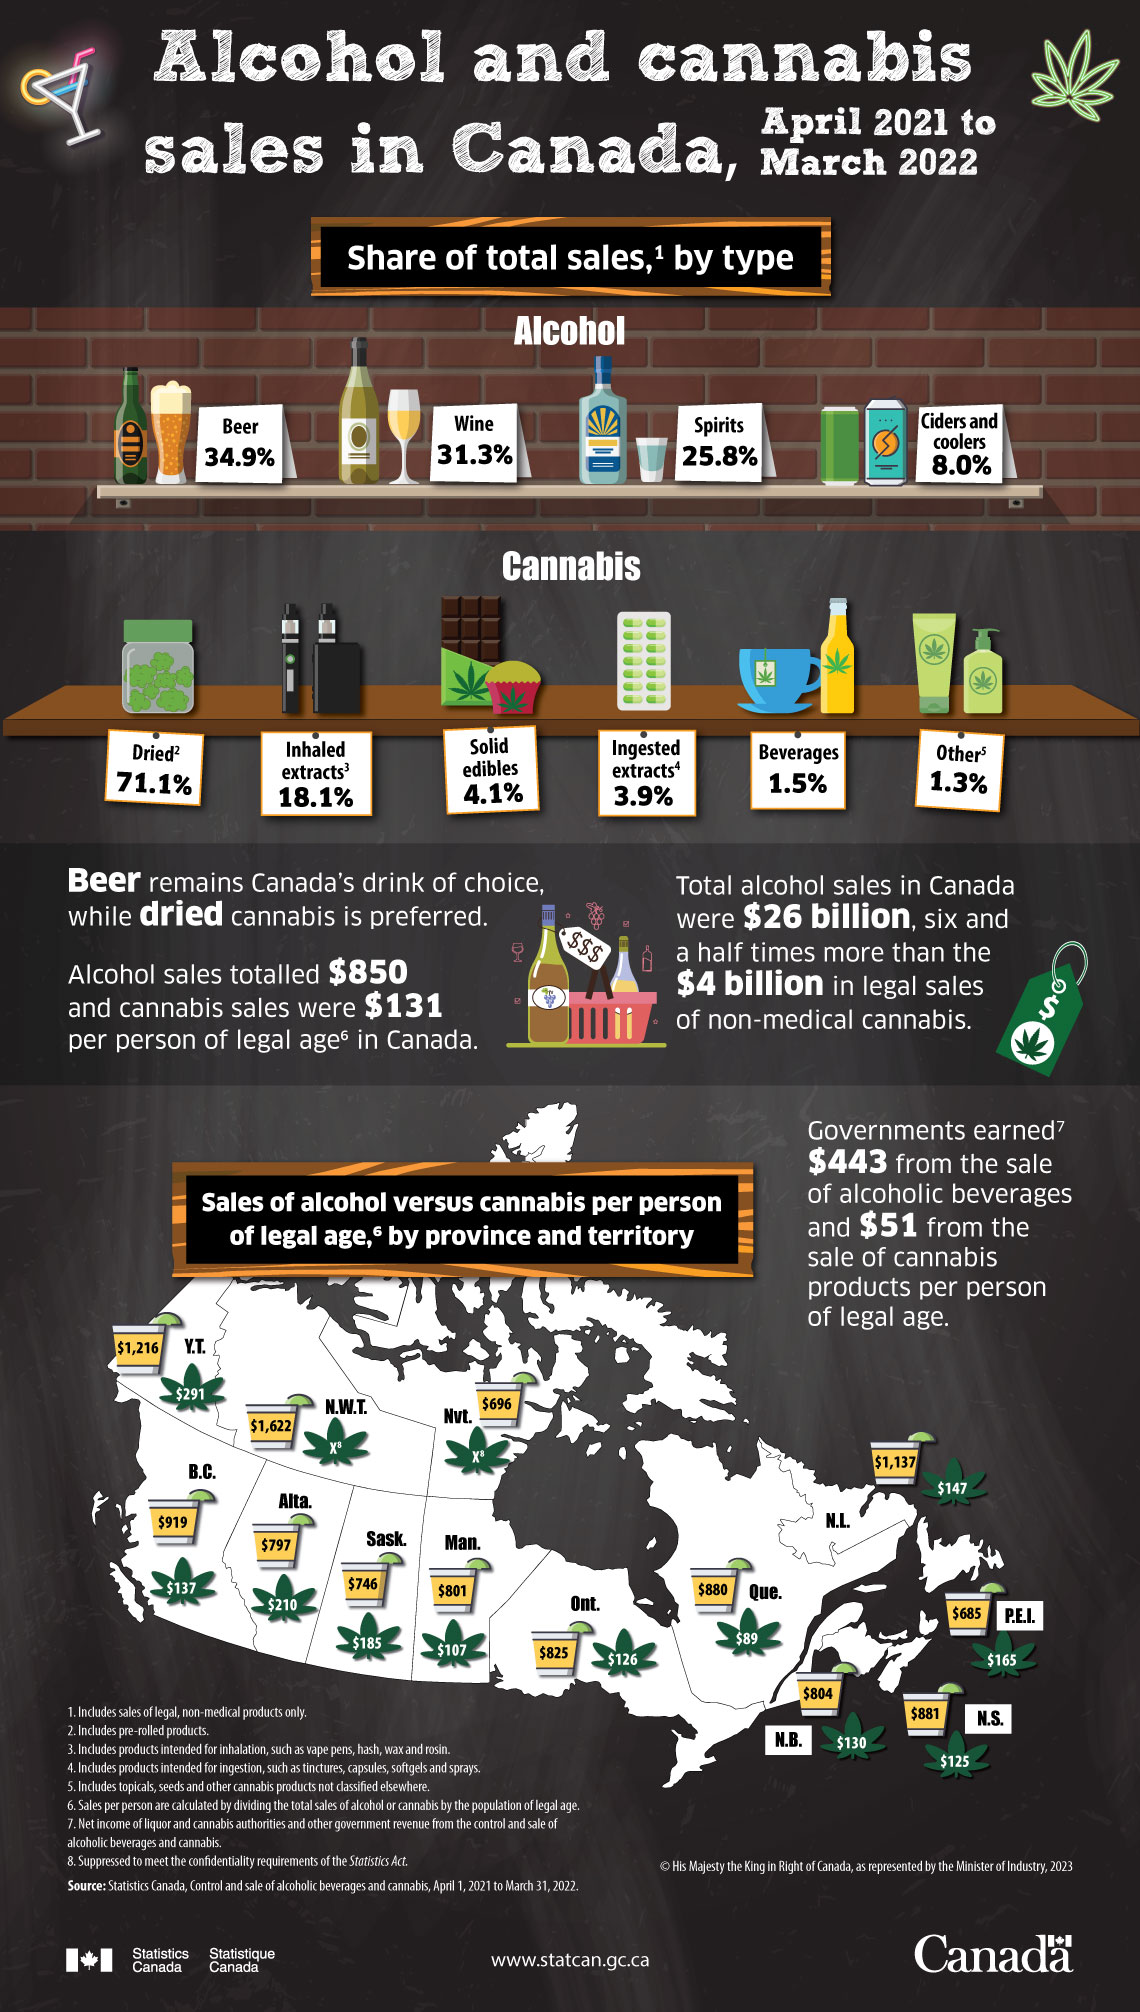
Description: Alcohol and cannabis sales in Canada, April 2021 to March 2022
| percent | |
|---|---|
| Alcohol | |
| Beer | 34.9% |
| Wine | 31.3% |
| Spirits | 25.8% |
| Ciders and coolers | 8.0% |
| Cannabis | |
| DriedNote 2 | 71.1% |
| Inhaled extractsNote 3 | 18.1% |
| Solid edibles | 4.1% |
| Ingested extractsNote 4 | 3.9% |
| Beverages | 1.5% |
| OtherNote 5 | 1.3% |
Beer remains Canada’s drink of choice, while dried cannabis is preferred by Canadians.
Alcohol sales totalled $850 and cannabis sales were $131 per person of legal ageNote 6 in Canada.
Total alcohol sales in Canada were $26 billion, six and a half times more than the $4 billion in legal sales of non-medical cannabis.
Governments earnedNote 7 $443 from the sale of alcoholic beverages and $51 from the sale of cannabis products per person of legal age.
| Alcohol | Cannabis | |
|---|---|---|
| N.L. | $1,137 | $147 |
| P.E.I. | $685 | $165 |
| N.S. | $881 | $125 |
| N.B. | $804 | $130 |
| Que. | $880 | $89 |
| Ont. | $825 | $126 |
| Man. | $801 | $107 |
| Sask. | $746 | $185 |
| Alta. | $797 | $210 |
| B.C. | $919 | $137 |
| Y.T. | $1,216 | $291 |
| N.W.T. | $1,622 | XNote 8 |
| Nvt. | $696 | XNote 8 |
Source: Statistics Canada, Control and sale of alcoholic beverages and cannabis, April 1, 2021 to March 31, 2022.
- Date modified: