
Active enterprises in Canada, 2020
Release date: January 12, 2023
Description: Active enterprises in Canada, 2020
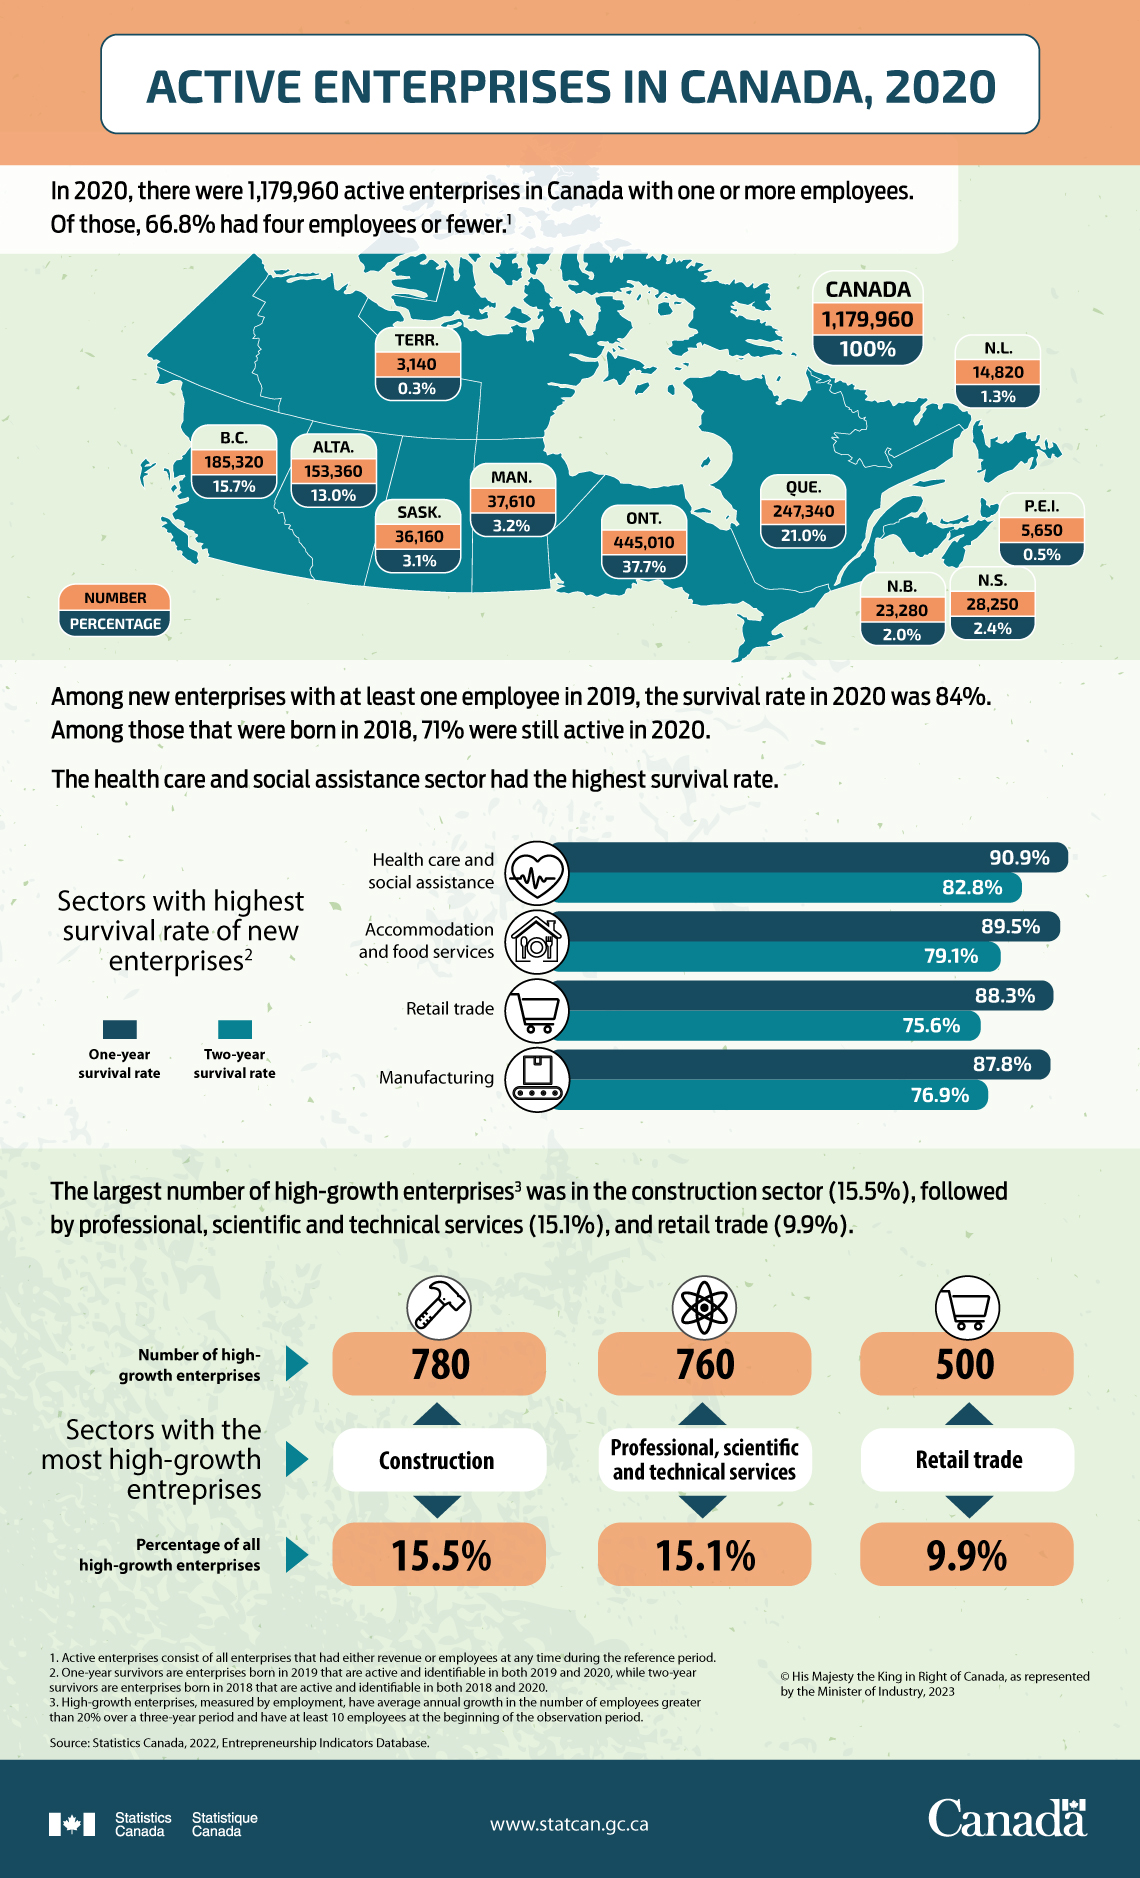
In 2020, there were 1,179,960 active enterprises in Canada with one or more employees. Of those, 66.8% had four employees or fewer.Note 1
| Province or Territory | Number | Percent (%) |
|---|---|---|
| Canada (Total) | 1,179,960 | 100.0 |
| Newfoundland and Labrador | 14,820 | 1.3 |
| Prince Edward Island | 5,650 | 0.5 |
| Nova Scotia | 28,250 | 2.4 |
| New Brunswick | 23,280 | 2.0 |
| Quebec | 247,340 | 21.0 |
| Ontario | 445,010 | 37.7 |
| Manitoba | 37,610 | 3.2 |
| Saskatchewan | 36,160 | 3.1 |
| Alberta | 153,360 | 13.0 |
| British Columbia | 185,320 | 15.7 |
| Territories | 3,140 | 0.3 |
Among new enterprises with at least one employee in 2019, the survival rate in 2020 was 84%. Among those that were born in 2018, 71% were still active in 2020.
The health care and social assistance sector had the highest survival rate.
| Sector | One-year survival rate | Two-year survival rate |
|---|---|---|
| Health care and social assistance | 90.90% | 82.80% |
| Accommodation and food services | 89.50% | 79.10% |
| Retail trade | 88.30% | 75.60% |
| Manufacturing | 87.80% | 76.90% |
The largest number of high-growth enterprisesNote 3 was in the construction sector (15.5%), followed by professional, scientific and technical services (15.1%), and retail trade (9.9%).
| Sector | Number | Percent (%) |
|---|---|---|
| Construction | 780 | 15.5 |
| Professional, scientific and technical services | 760 | 15.1 |
| Retail trade | 500 | 9.9 |
- Date modified: