
Diversity of Canada’s Veterans and military population

Archived Content
Information identified as archived is provided for reference, research or recordkeeping purposes. It is not subject to the Government of Canada Web Standards and has not been altered or updated since it was archived. Please "contact us" to request a format other than those available.
Description: Diversity of Canada’s Veterans and military population
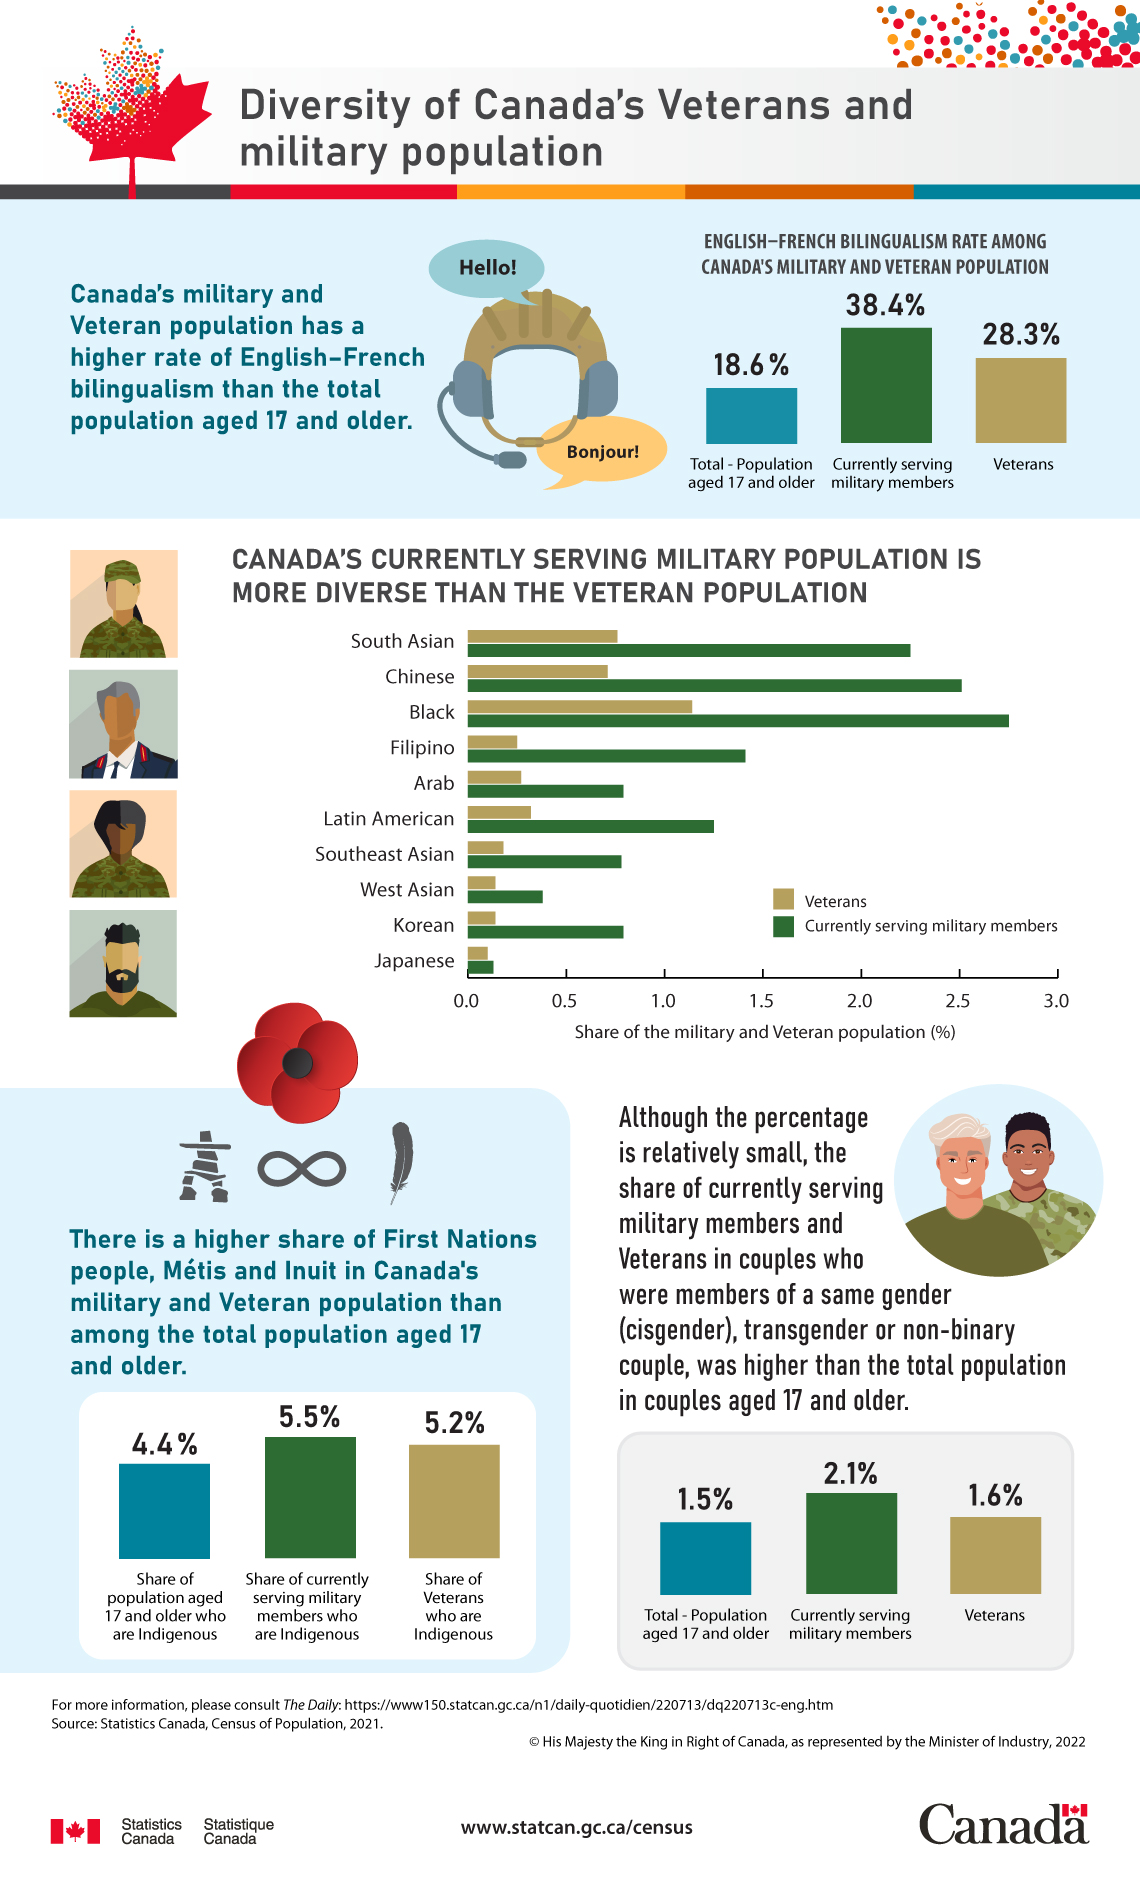
Canada’s military and Veteran population has a higher rate of English–French bilingualism than the total population aged 17 and older.
| English–French bilingualism rate among Canada’s military and Veteran population | |
|---|---|
| Total – Population aged 17 and older | 18.6% |
| Currently serving military members | 38.4% |
| Veterans | 28.3% |
Canada’s currently serving military population is more diverse than the Veteran population
| Visible minority | Currently serving military members | Veterans |
|---|---|---|
| South Asian | 2.25% | 0.76% |
| Chinese | 2.51% | 0.71% |
| Black | 2.75% | 1.14% |
| Filipino | 1.41% | 0.25% |
| Arab | 0.79% | 0.27% |
| Latin American | 1.25% | 0.32% |
| Southeast Asian | 0.78% | 0.18% |
| West Asian | 0.38% | 0.14% |
| Korean | 0.79% | 0.14% |
| Japanese | 0.13% | 0.10% |
There is a higher share of First Nations people, Métis and Inuit in Canada’s military and Veteran population than among the total population aged 17 and over.
| Indigenous Identity | |
|---|---|
| Share of population aged 17 and older who are Indigenous | 4.4% |
| Share of currently serving military members who are Indigenous | 5.5% |
| Share of Veterans who are Indigenous | 5.2% |
Although the percentage is relatively small, the share of currently serving military members and Veterans in couples who were members of a same-gender (cisgender), transgender or non-binary couple, was higher than the total population in couples aged 17 and older.
| Members of a same-gender (cisgender), transgender or non-binary couple | |
|---|---|
| Total – Population in couples aged 17 and older | 1.5% |
| Currently serving military members | 2.1% |
| Veterans | 1.6% |
For more information, please consult The Daily: https://www150.statcan.gc.ca/n1/daily-quotidien/220713/dq220713c-eng.htm
Source: Statistics Canada, Census of Population, 2021.
- Date modified: