
Portrait of environmental and clean technology jobs in Canada, 2019

Archived Content
Information identified as archived is provided for reference, research or recordkeeping purposes. It is not subject to the Government of Canada Web Standards and has not been altered or updated since it was archived. Please "contact us" to request a format other than those available.
Description: Portrait of environmental and clean technology jobs in Canada, 2019
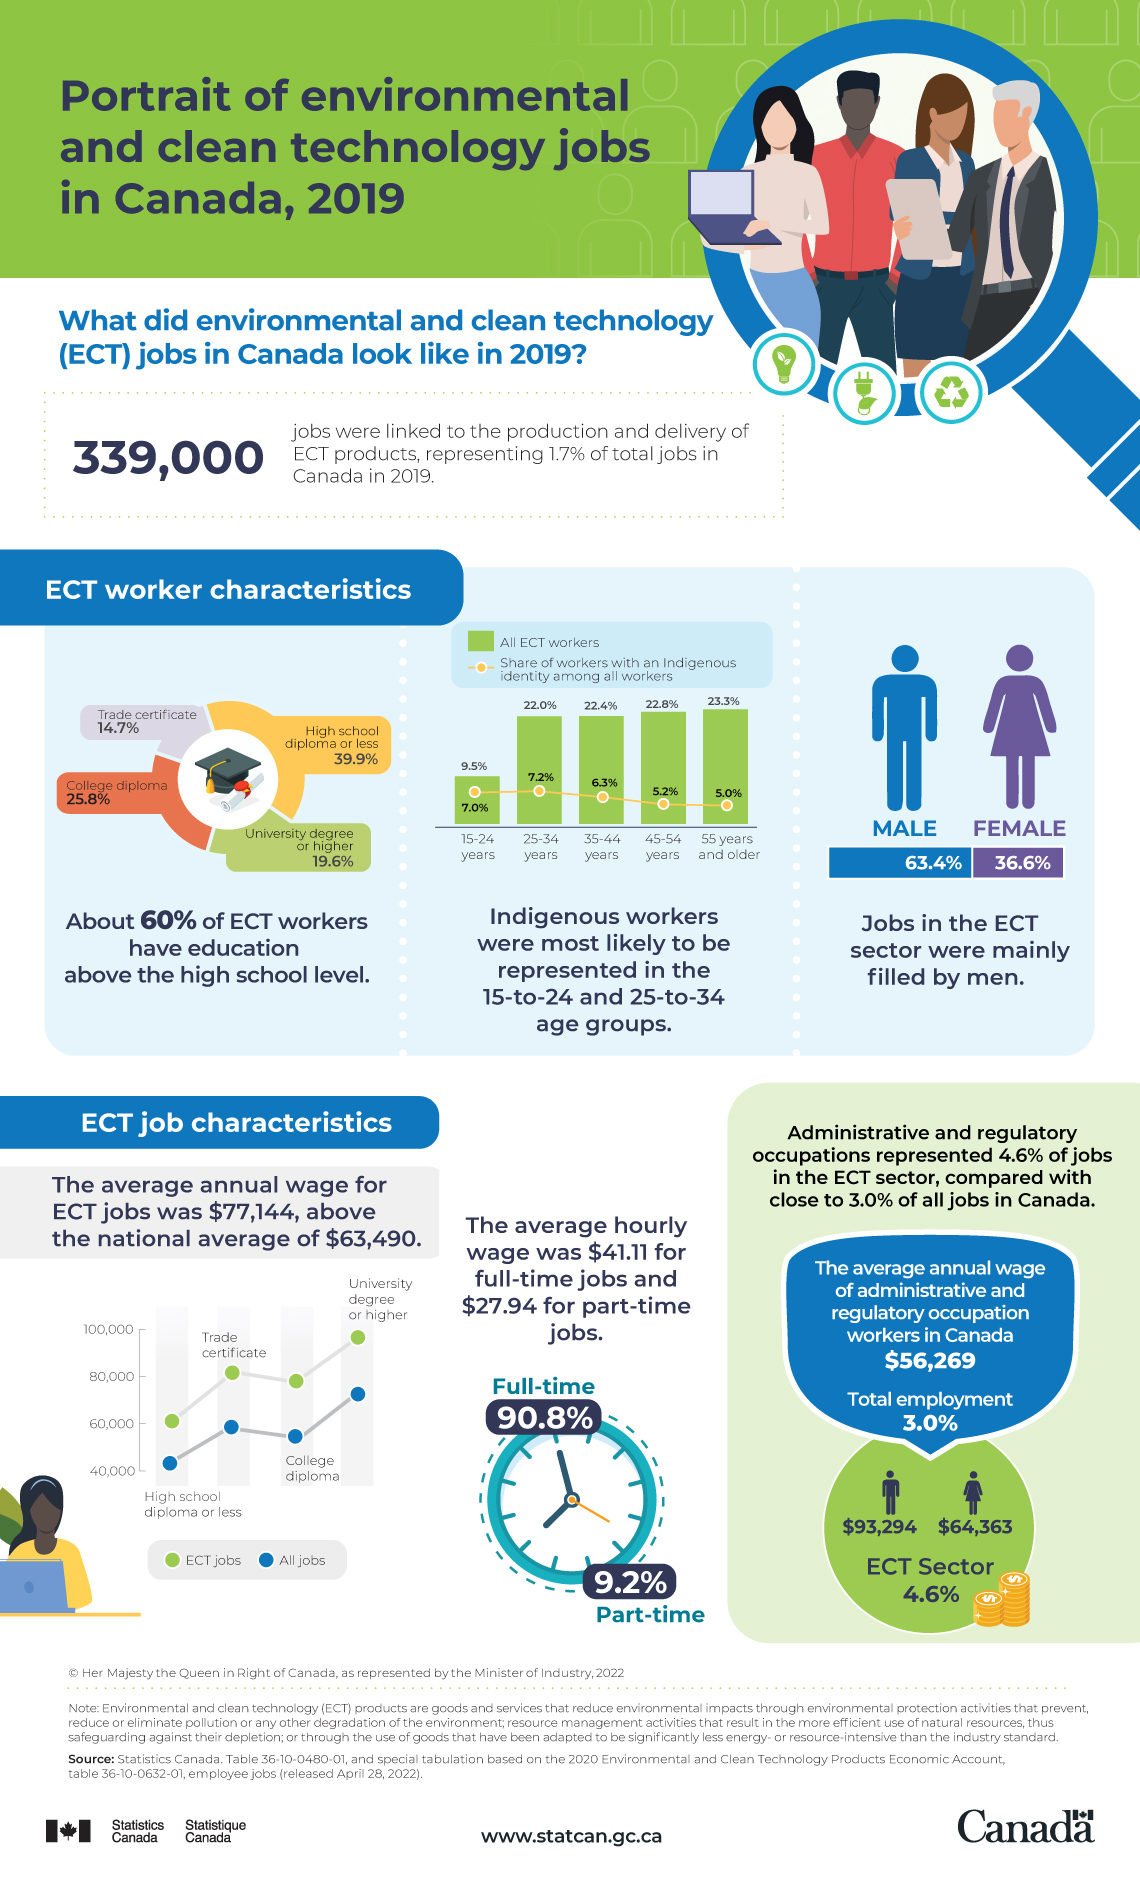
What did environmental and clean technology (ECT) jobs in Canada look like in 2019?
339,000 jobs were linked to the production and delivery of ECT products,Note 1 representing 1.7% of total jobs in Canada in 2019.
ECT worker characteristics
About 60% of ECT workers have education above the high school level.
| Education level | Percentage |
|---|---|
| High school diploma or less | 39.9% |
| Trade certificate | 14.7% |
| College diploma | 25.8% |
| University degree or higher | 19.6% |
Indigenous workers were most likely to be represented in the 15-to-24 and 25-to-34 age groups.
| Age group | All ECT workers | Share of workers with an Indigenous identity among all workers |
|---|---|---|
| Percentage | ||
| 15 to 24 years | 9.5% | 7.0% |
| 25 to 34 years | 22.0% | 7.2% |
| 35 to 44 years | 22.4% | 6.3% |
| 45 to 54 years | 22.8% | 5.2% |
| 55 years and older | 23.3% | 5.0% |
Jobs in the ECT sector were mainly filled by men.
| Gender | Percentage |
|---|---|
| Male | 63.4% |
| Female | 36.6% |
ECT job characteristics
The average annual wage for ECT jobs was $77,144, above the national average of $63,490.
| Education level | ECT jobs | All jobs |
|---|---|---|
| Wage | ||
| High school diploma or less | $63,255 | $45,790 |
| Trade certificate | $82,124 | $59,170 |
| College diploma | $78,748 | $56,600 |
| University degree or higher | $99,389 | $73,270 |
The average hourly wage was $41.11 for full-time jobs and $27.94 for part-time jobs.
| Status | Percentage |
|---|---|
| Full-time | 90.8% |
| Part-time | 9.2% |
Administrative and regulatory occupations represented 4.6% of jobs in the ECT sector, compared with close to 3.0% of all jobs in Canada.
The average annual wage of administrative and regulatory occupation workers in Canada was $56,269. For the ECT sector, the annual average wage was $93,294 for men, and $64,363 for women.
Source: Statistics Canada. Table 36-10-0480-01, and special tabulation based on the 2020 Environmental and Clean Technology Products Economic Account, table 36-10-0632-01, employee jobs (released April 28, 2022).
- Date modified: