
Unravelling the story about household textile and e-waste disposal in Canada

Archived Content
Information identified as archived is provided for reference, research or recordkeeping purposes. It is not subject to the Government of Canada Web Standards and has not been altered or updated since it was archived. Please "contact us" to request a format other than those available.
Description: Unravelling the story about household textile and e-waste disposal in Canada
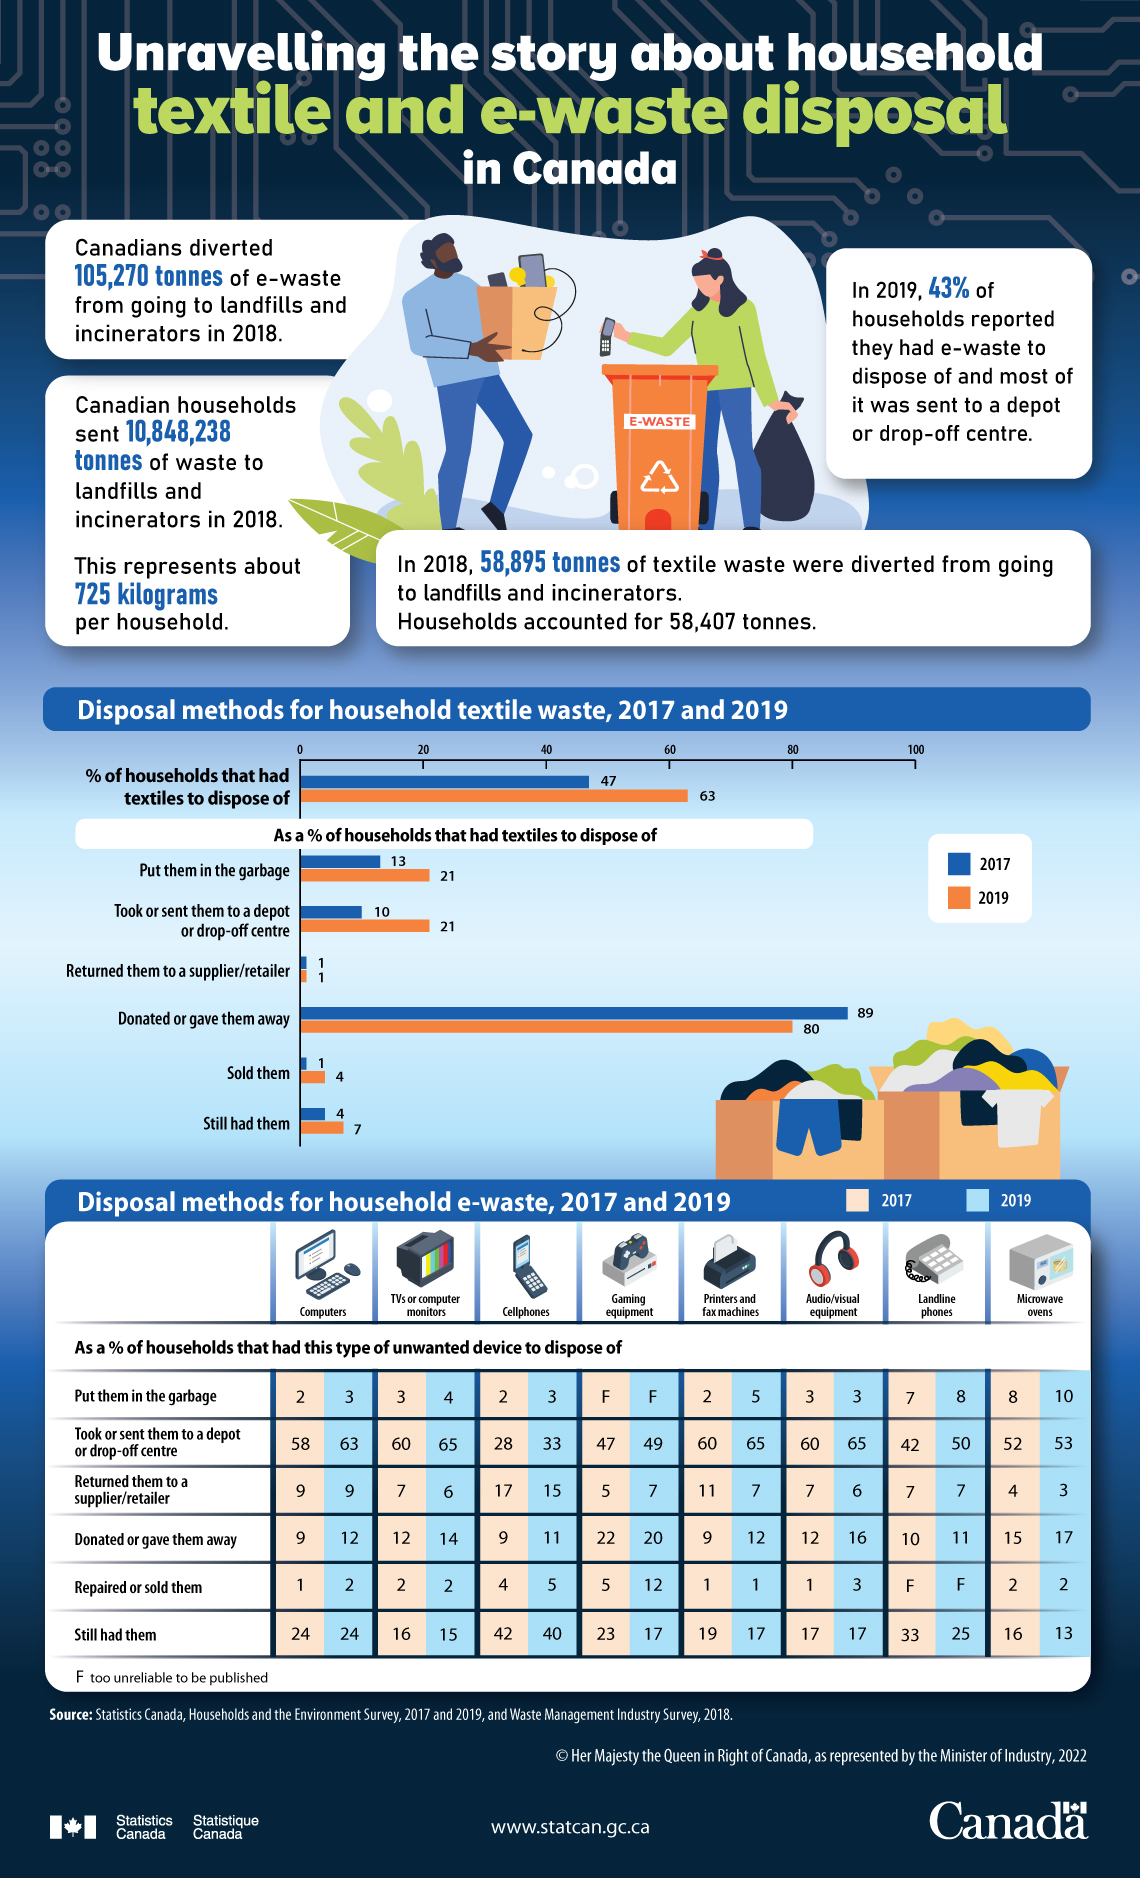
Canadians diverted 105,270 tonnes of e-waste from going to landfills and incinerators in 2018.
Canadian households sent 10,848,238 tonnes of waste to landfills and incinerators in 2018. This represents about 725 kilograms per household.
In 2018, 58,895 tonnes of textile waste were diverted from going to landfills and incinerators. Households accounted for 58,407 tonnes.
In 2019, 43% of households reported they had e-waste to dispose of and most of it was sent to a depot or drop-off centre.
| 2017 | 2019 | |
|---|---|---|
| % of households that had textiles to dispose of | 47 | 63 |
| As a % of households that had textiles to dispose of | ||
| Put them in the garbage | 13 | 21 |
| Took or sent them to a depot or drop-off centre | 10 | 21 |
| Returned them to a supplier/retailer | 1 | 1 |
| Donated or gave them away | 89 | 80 |
| Sold them | 1 | 4 |
| Still had them | 4 | 7 |
| Computers | TVs or computer monitors | Cell phones | Gaming equipment | Printers and fax machines | Audio/visual equipment | Landline phones | Microwave ovens | |||||||||
|---|---|---|---|---|---|---|---|---|---|---|---|---|---|---|---|---|
| 2017 | 2019 | 2017 | 2019 | 2017 | 2019 | 2017 | 2019 | 2017 | 2019 | 2017 | 2019 | 2017 | 2019 | 2017 | 2019 | |
| As a % of households that had this type of unwanted device to dispose of | ||||||||||||||||
| Put them in the garbage | 2 | 3 | 3 | 4 | 2 | 3 | Note F: too unreliable to be published | Note F: too unreliable to be published | 2 | 5 | 3 | 3 | 7 | 8 | 8 | 10 |
| Took or sent them to a depot or drop-off centre | 58 | 63 | 60 | 65 | 28 | 33 | 47 | 49 | 60 | 65 | 60 | 65 | 42 | 50 | 52 | 53 |
| Returned them to a supplier/retailer | 9 | 9 | 7 | 6 | 17 | 15 | 5 | 7 | 11 | 7 | 7 | 6 | 7 | 7 | 4 | 3 |
| Donated or gave them away | 9 | 12 | 12 | 14 | 9 | 11 | 22 | 20 | 9 | 12 | 12 | 16 | 10 | 11 | 15 | 17 |
| Repaired or sold them | 1 | 2 | 2 | 2 | 4 | 5 | 5 | 12 | 1 | 1 | 1 | 3 | Note F: too unreliable to be published | Note F: too unreliable to be published | 2 | 2 |
| Still had them | 24 | 24 | 16 | 15 | 42 | 40 | 23 | 17 | 19 | 17 | 17 | 17 | 33 | 25 | 16 | 13 |
| F too unreliable to be published | ||||||||||||||||
Source: Statistics Canada, Households and the Environment Survey, 2017 and 2019, and Waste Management Industry Survey, 2018.
- Date modified: