
Earnings and mobility of journeypersons in Canada, 2019

Archived Content
Information identified as archived is provided for reference, research or recordkeeping purposes. It is not subject to the Government of Canada Web Standards and has not been altered or updated since it was archived. Please "contact us" to request a format other than those available.
Description: Earnings and mobility of journeypersons in Canada, 2019
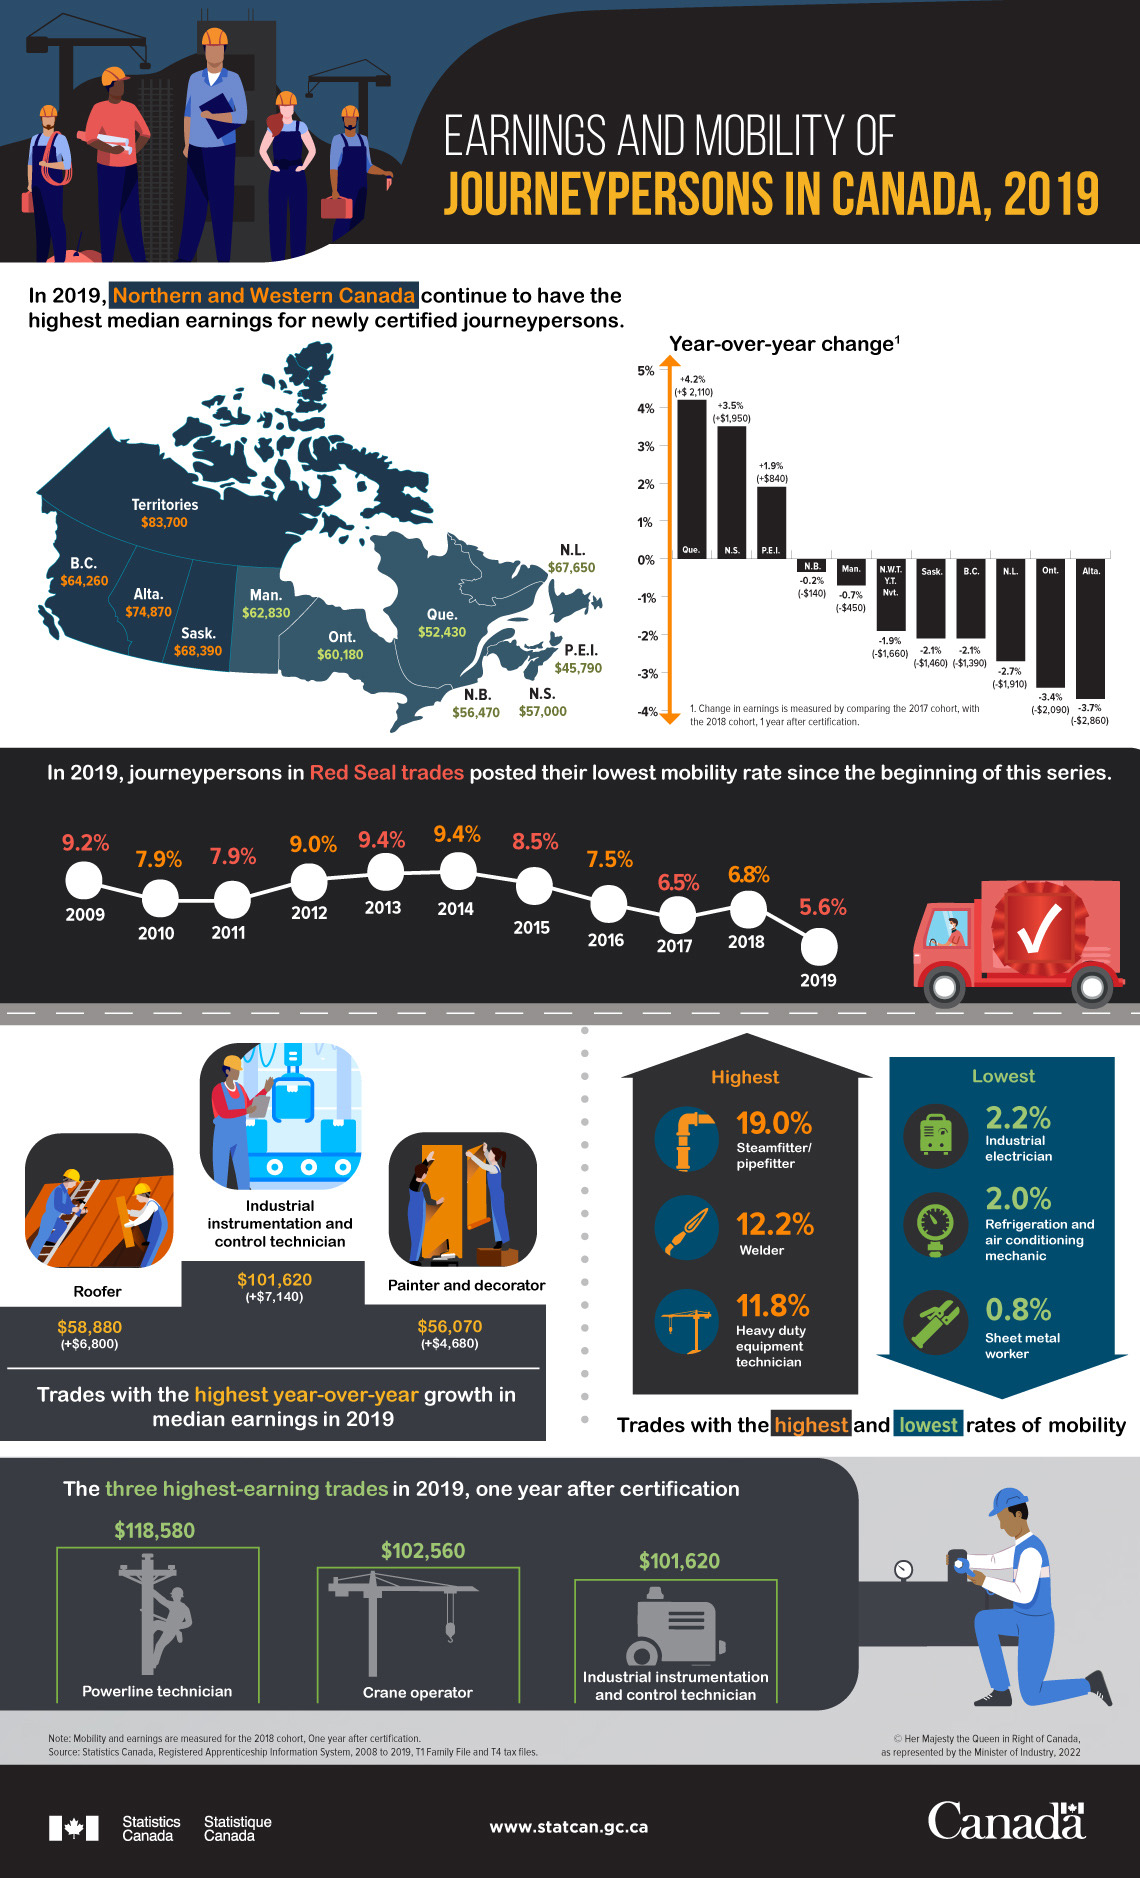
In 2019, Northern and Western Canada continue to have the highest median earnings for newly certified journeypersons.
| Jurisdiction | Median income in 2019, after being certified for 1 year. | Year-over-year change |
|---|---|---|
| Territories | $83,700 | -$ 1,660 (-1.9%) |
| Alberta | $74,870 | -$ 2,860 (-3.7%) |
| Saskatchewan | $68,390 | -$ 1,460 (-2.1%) |
| Newfoundland and Labrador | $67,650 | -$ 1,910 (-2.7%) |
| British Columbia | $64,260 | -$ 1,390 (-2.1%) |
| Manitoba | $62,830 | -$ 450 (-0.7%) |
| Ontario | $60,180 | -$ 2,090 (-3.4%) |
| Nova Scotia | $57,000 | $ 1,950 (+3.5%) |
| New Brunswick | $56,470 | -$ 140 (-0.2%) |
| Quebec | $52,430 | $ 2,110 (+4.2%) |
| Prince Edward Island | $45,790 | $ 840 (+1.9%) |
Note: Change in earnings is measured by comparing the 2017 cohort, with the 2018 cohort, 1 year after certification.
In 2019, journeypersons in Red Seal trades posted their lowest mobility rate since the beginning of series.
| Year of certification | Mobility rate, after one year of certification |
|---|---|
| 2009 | 9.20% |
| 2010 | 7.90% |
| 2011 | 7.90% |
| 2012 | 9.00% |
| 2013 | 9.40% |
| 2014 | 9.40% |
| 2015 | 8.50% |
| 2016 | 7.50% |
| 2017 | 6.50% |
| 2018 | 6.80% |
| 2019 | 5.60% |
Trades with the highest and lowest rates of mobility
| Trade | Mobility rate |
|---|---|
| Steamfitter/pipefitter | 19.00% |
| Welder | 12.20% |
| Heavy duty equipment technician | 11.80% |
| - | - |
| Sheet metal worker | 0.80% |
| Refrigeration and air conditioning mechanic | 2.00% |
| Industrial electrician | 2.20% |
Trades with the highest year-over-year growth in median earnings, in 2019
| Trade | Median earnings |
|---|---|
| Industrial instrumentation and control technician | $101,620 (+$7,140) |
| Roofer | $58,880 (+$6,800) |
| Painter and decorator | $56,070 (+$4,680) |
The three highest-earning trades in 2019, one year after certification
| Trade | Median earnings |
|---|---|
| Powerline technician | $118,580 |
| Crane operator | $102,560 |
| Industrial instrumentation and control technician | $101,620 |
Note: Mobility and earnings are measured for the 2018 cohort, 1 year after certification.
Source: Statistics Canada, Registered Apprenticeship Information System, 2008 to 2019. T1 family (T1FF) and T4 tax files
- Date modified: