
Government Spending by Function, 2020/2021

Archived Content
Information identified as archived is provided for reference, research or recordkeeping purposes. It is not subject to the Government of Canada Web Standards and has not been altered or updated since it was archived. Please "contact us" to request a format other than those available.
Release date: November 26, 2021
Description: Government Spending by Function, 2020/2021
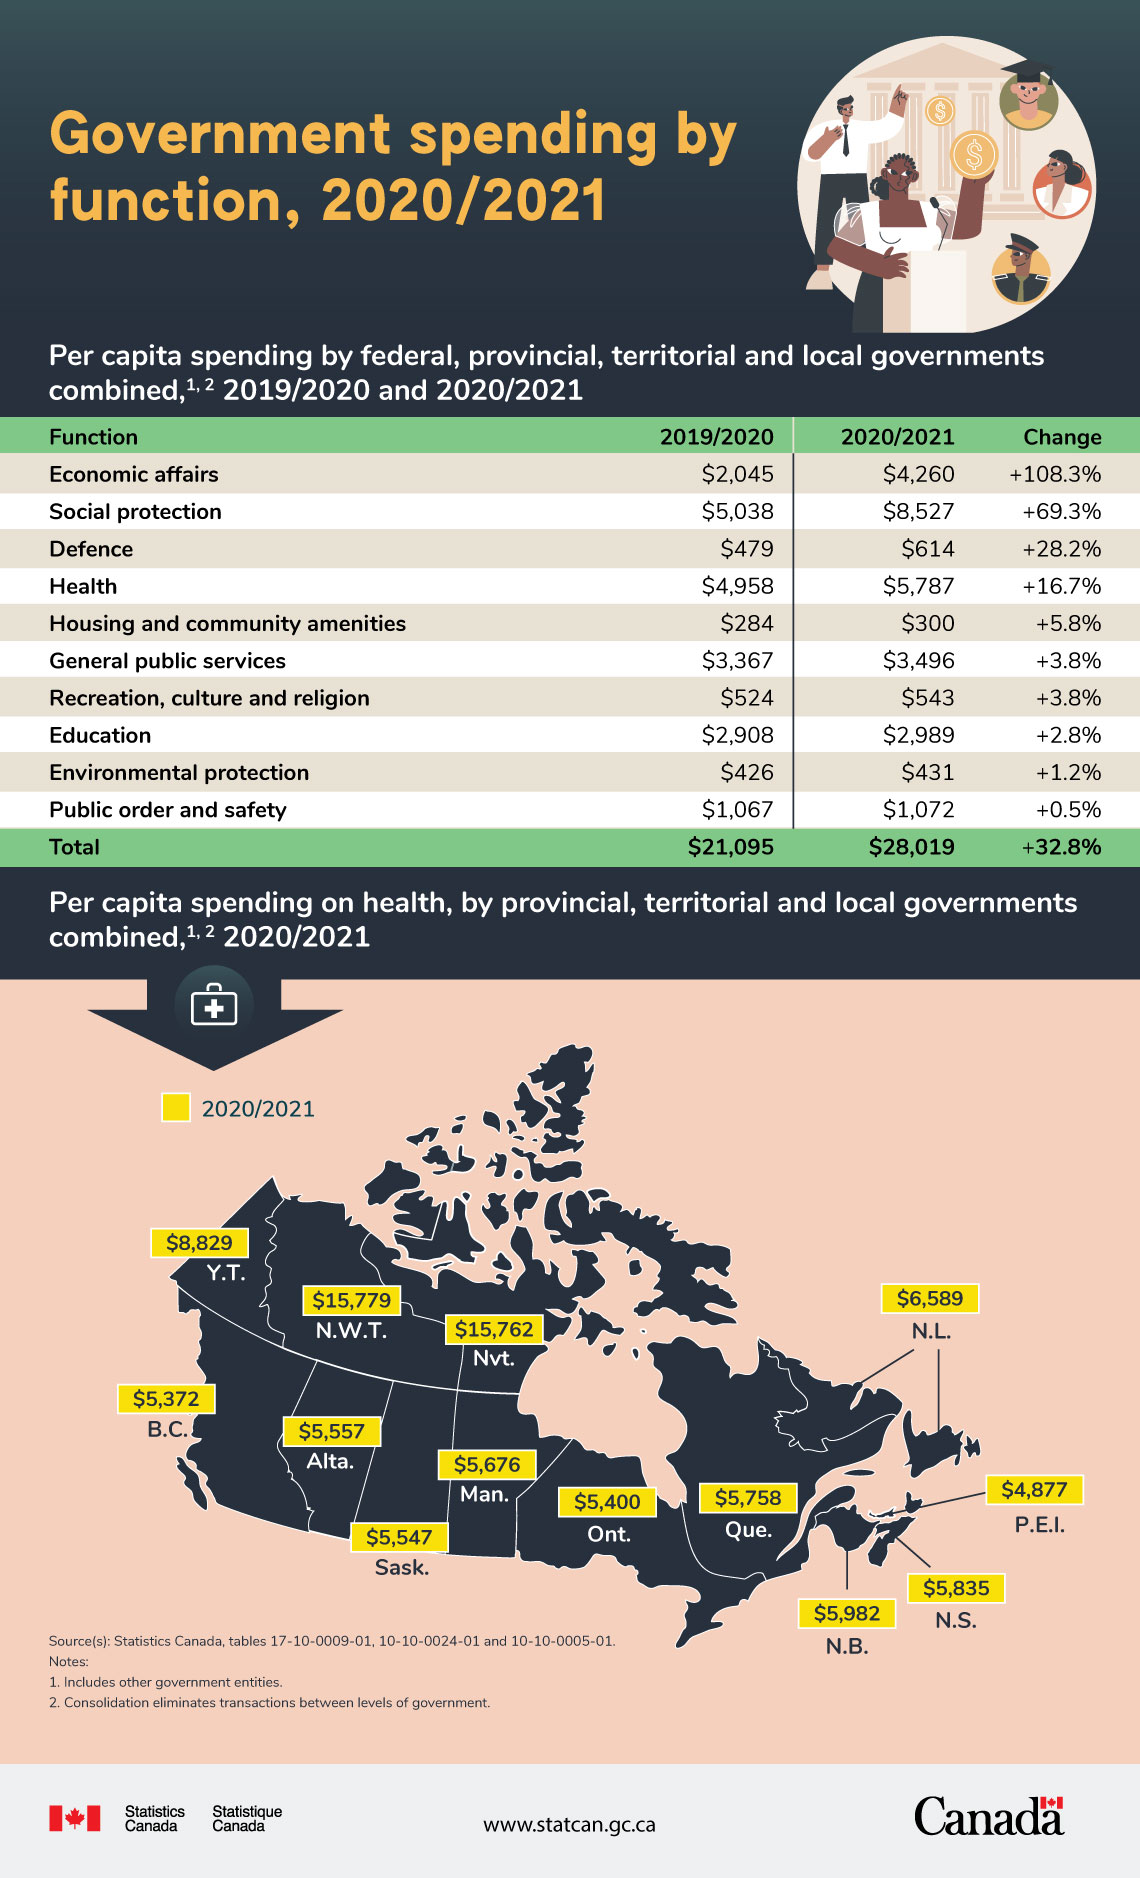
| 2019/2020 | 2020/2021 | Change | |
|---|---|---|---|
| Economic affairs | $2,045 | $4,260 | +108.30% |
| Social protection | $5,038 | $8,527 | +69.30% |
| Defence | $479 | $614 | +28.20% |
| Health | $4,958 | $5,787 | +16.70% |
| Housing and community amenities | $284 | $300 | +5.80% |
| General public services | $3,367 | $3,496 | +3.80% |
| Recreation, culture and religion | $524 | $543 | +3.80% |
| Education | $2,908 | $2,989 | +2.80% |
| Environmental protection | $426 | $431 | +1.20% |
| Public order and safety | $1,067 | $1,072 | +0.50% |
| Total | $21,095 | $28,019 | +32.80% |
| 2020/2021 | |
|---|---|
| Alberta | $5,557 |
| British Columbia | $5,372 |
| Manitoba | $5,676 |
| New Brunswick | $5,982 |
| Newfoundland and Labrador | $6,589 |
| Northwest Territories | $15,779 |
| Nova Scotia | $5,835 |
| Nunavut | $15,762 |
| Ontario | $5,400 |
| Prince Edward Island | $4,877 |
| Quebec | $5,758 |
| Saskatchewan | $5,547 |
| Yukon | $8,829 |
Sources: Statistics Canada, tables 17-10-0009-01, 10-10-0024-01 and 10-10-0005-01.
- Date modified: