
Active enterprises in Canada, 2019

Archived Content
Information identified as archived is provided for reference, research or recordkeeping purposes. It is not subject to the Government of Canada Web Standards and has not been altered or updated since it was archived. Please "contact us" to request a format other than those available.
Description: Active enterprises in Canada, 2019
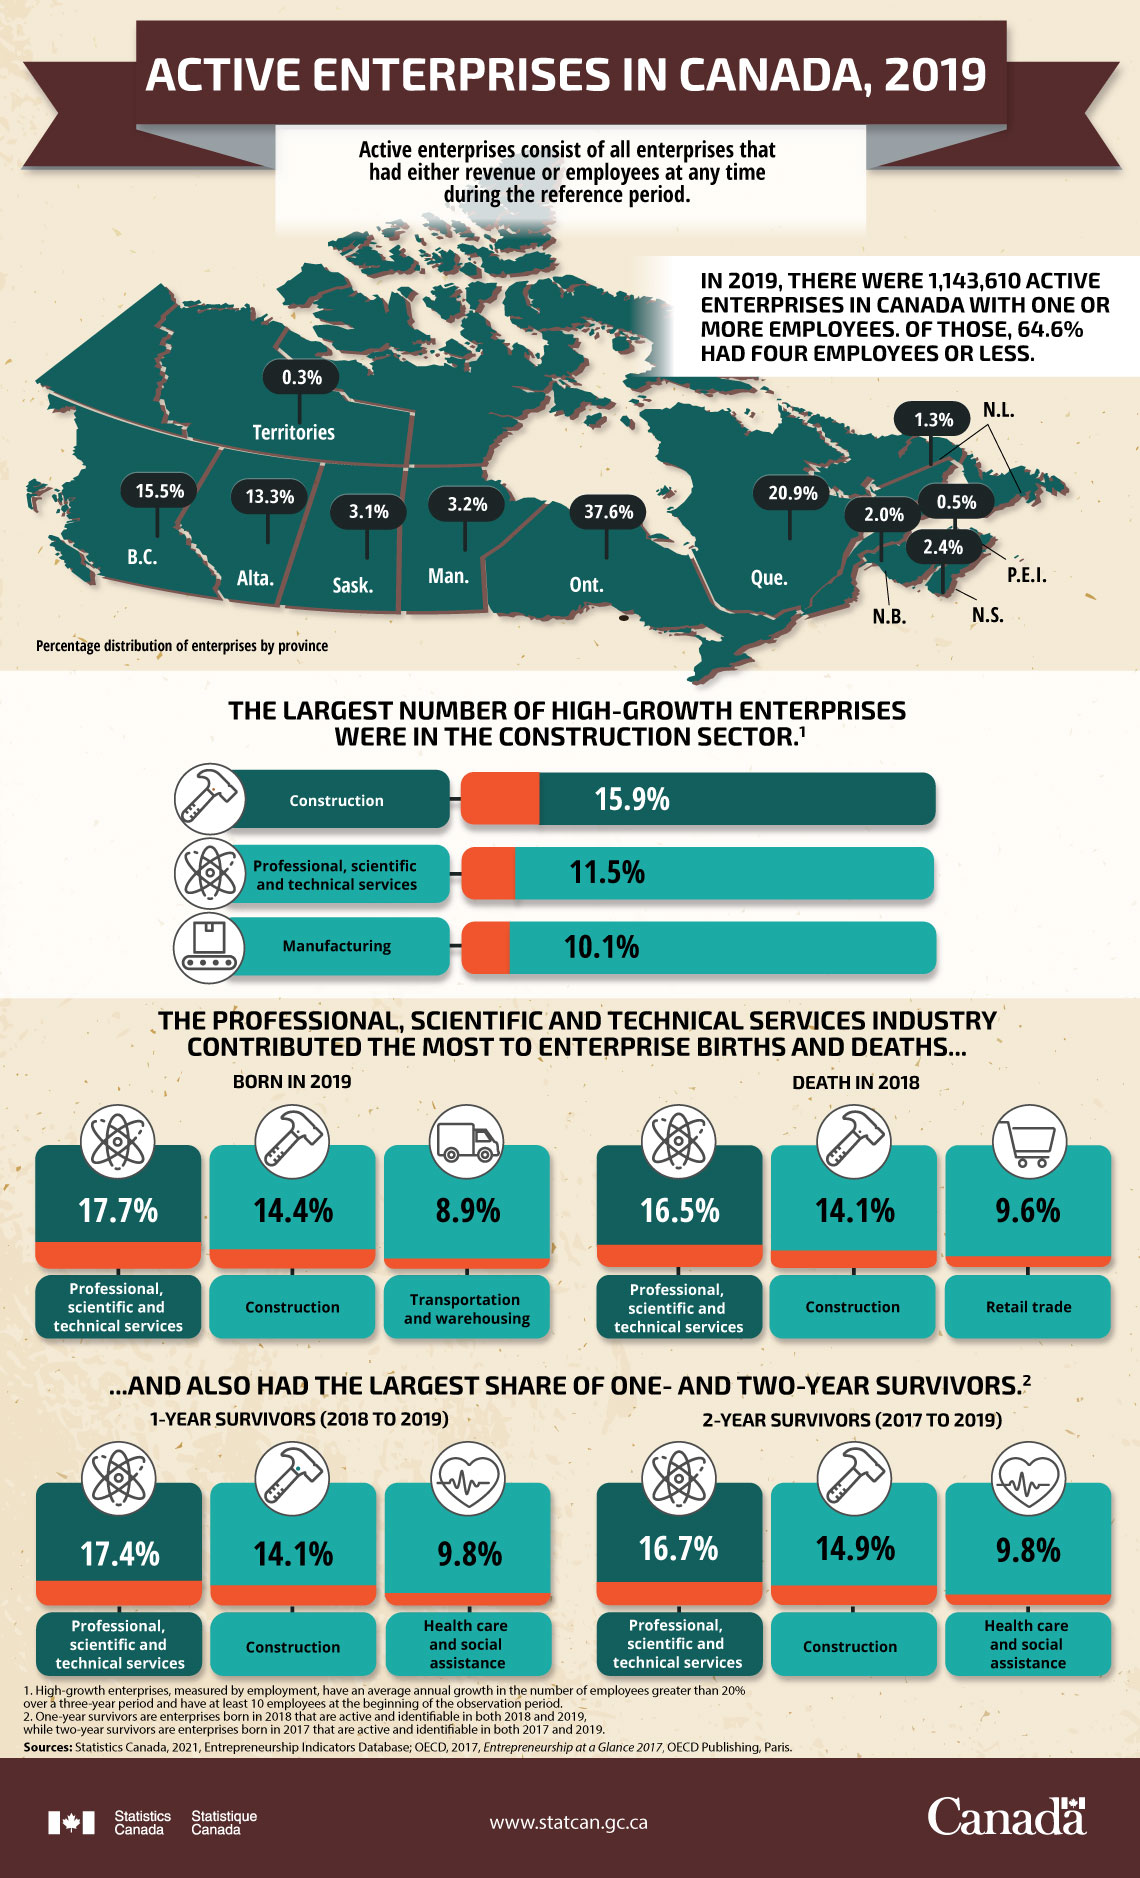
Active enterprises consist of all enterprises that had either revenue or employees at any time during the reference period.
In 2019, there were 1,143,610 active enterprises in Canada with one or more employees. Of those, 64.6% had four employees or less.
| Province or Territory | Percent (%) |
|---|---|
| Newfoundland and Labrador | 1.3 |
| Prince Edward Island | 0.5 |
| Nova Scotia | 2.4 |
| New Brunswick | 2.0 |
| Quebec | 20.9 |
| Ontario | 37.6 |
| Manitoba | 3.2 |
| Saskatchewan | 3.1 |
| Alberta | 13.3 |
| British Columbia | 15.5 |
| Territories | 0.3 |
The largest number of high-growth enterprises were in the construction sector.Note 1
| Sector | Percent (%) |
|---|---|
| Construction | 15.9 |
| Professional, scientific and technical services | 11.5 |
| Manufacturing | 10.1 |
The professional, scientific and technical services industry contributed the most to enterprise births and deaths...
| Sector | Births in 2019 (%) |
|---|---|
| Professional, scientific and technical services | 17.7 |
| Construction | 14.4 |
| Transportation and warehousing | 8.9 |
| Sector | Deaths in 2018 (%) |
|---|---|
| Professional, scientific and technical services | 16.5 |
| Construction | 14.1 |
| Retail trade | 9.6 |
...and also had the largest share of one- and two-year survivors.Note 2
| Sector | One-year survivors (2018 to 2019) |
Two-year survivors (2017 to 2019) |
|---|---|---|
| Percent (%) | ||
| Professional, scientific and technical services | 17.4 | 16.7 |
| Construction | 14.1 | 14.9 |
| Health care and social assistance | 9.8 | 9.8 |
Sources: Statistics Canada, 2021, Entrepreneurship Indicators Database; OECD, 2017, Entrepreneurship at a Glance 2017, OECD Publishing, Paris.
- Date modified: