
Religion in Canada

Archived Content
Information identified as archived is provided for reference, research or recordkeeping purposes. It is not subject to the Government of Canada Web Standards and has not been altered or updated since it was archived. Please "contact us" to request a format other than those available.
Description: Religion in Canada
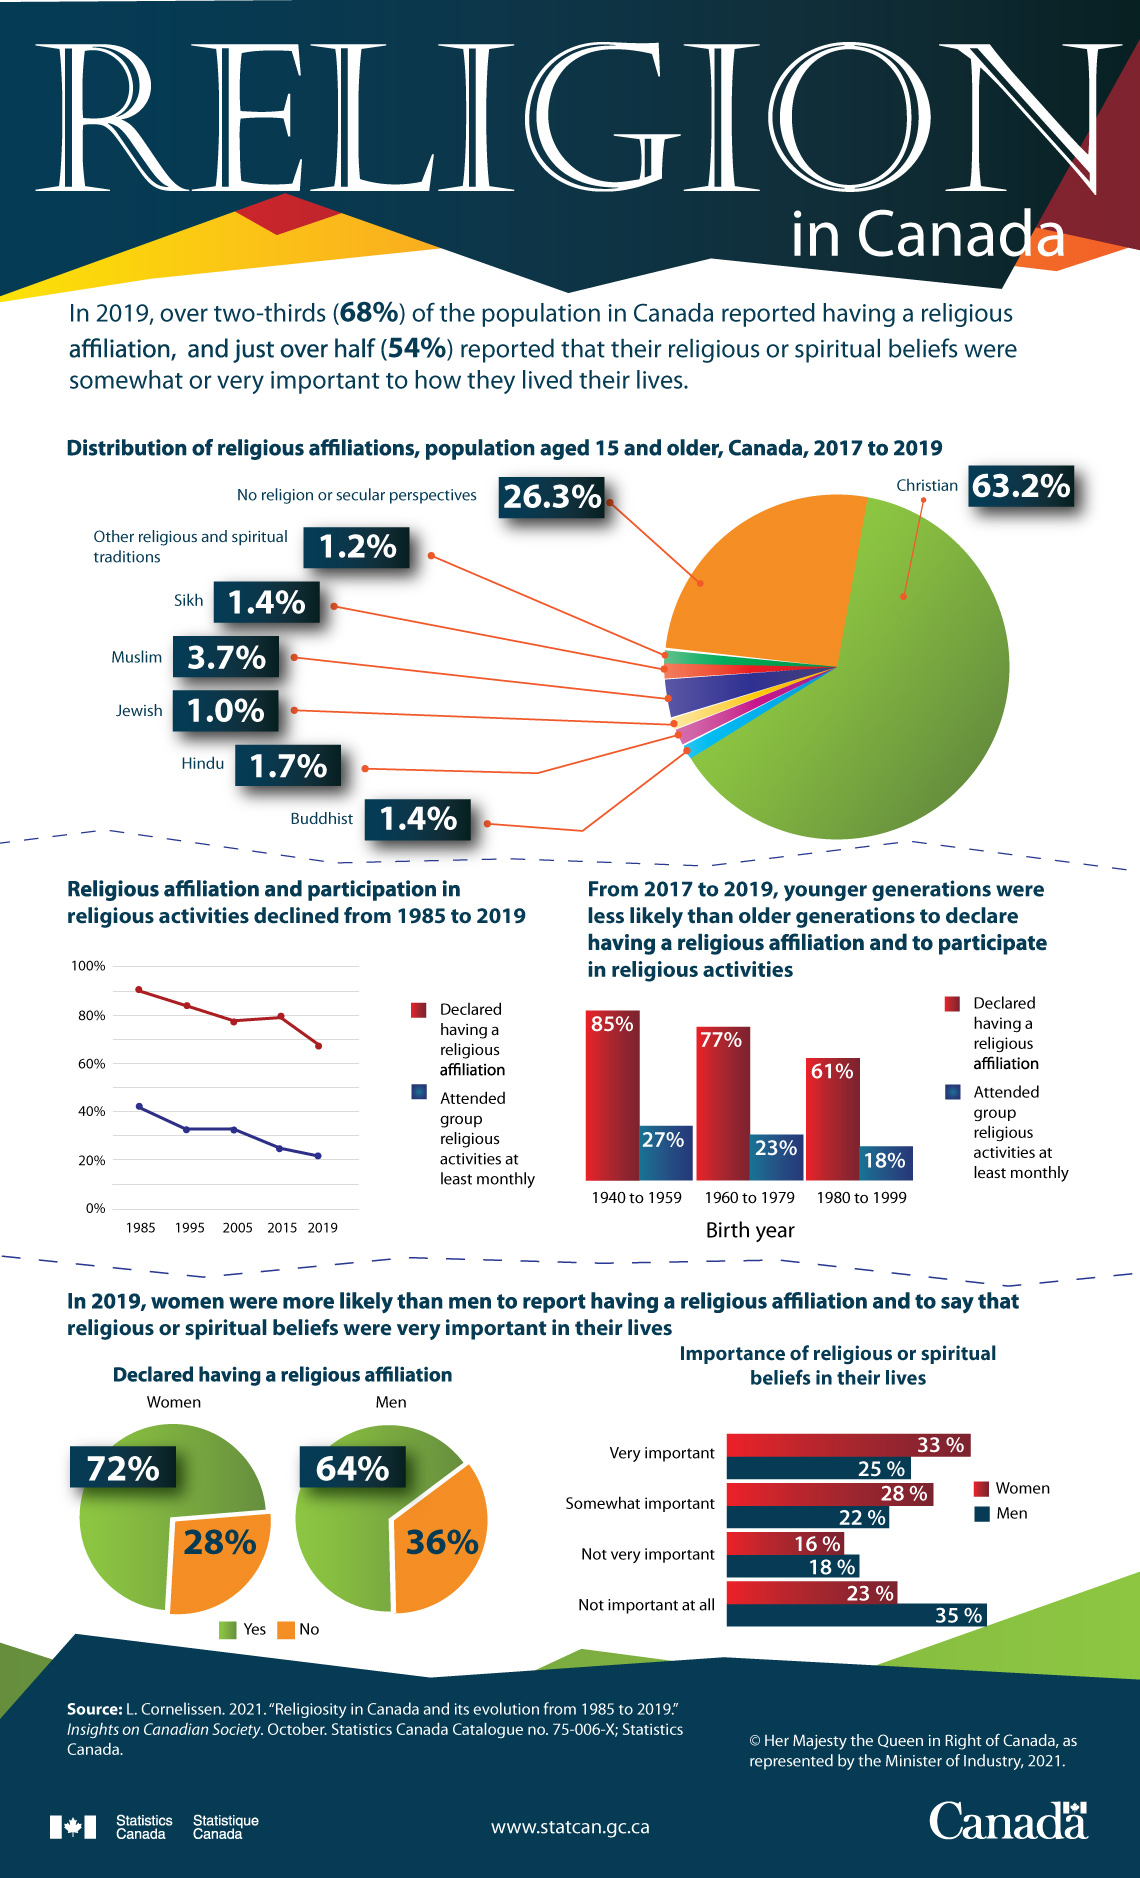
In 2019, over two-thirds (68%) of the population in Canada reported having a religious affiliation, and just over half (54%) reported that their religious or spiritual beliefs were somewhat or very important to how they lived their lives.
Distribution of religious affiliations, population aged 15 and older, Canada, 2017 to 2019
| Religious affiliation groupings | Total population aged 15 and older |
|---|---|
| % | |
| Christian | 63.2 |
| Buddhist | 1.4 |
| Hindu | 1.7 |
| Jewish | 1.0 |
| Muslim | 3.7 |
| Sikh | 1.4 |
| Other religious and spiritual traditions | 1.2 |
| No religion or secular perspectives | 26.3 |
Religious affiliation and participation in religious activities declined from 1985 to 2019
| Declared having a religious affiliation | Attended group religious activities at least monthly | |
|---|---|---|
| % | ||
| 1985 | 90 | 43 |
| 1995 | 84 | 34 |
| 2005 | 78 | 34 |
| 2015 | 79 | 26 |
| 2019 | 68 | 23 |
From 2017 to 2019, younger generations were less likely than older generations to declare having a religious affiliation and to participate in religious activities
| Birth year | Declared having a religious affiliation | Attended group religious activities at least monthly |
|---|---|---|
| % | ||
| 1940 to 1959 | 85 | 27 |
| 1960 to 1979 | 77 | 23 |
| 1980 to 1999 | 61 | 18 |
In 2019, women were more likely than men to report having a religious affiliation and to say that religious or spiritual beliefs were very important in their lives
| Women | Men | |
|---|---|---|
| % | ||
| Declared having a religious affiliation | ||
| Yes | 72 | 64 |
| No | 28 | 36 |
| Importance of religious or spiritual beliefs in their lives | ||
| Very important | 33 | 25 |
| Somewhat important | 28 | 22 |
| Not very important | 16 | 18 |
| Not important at all | 23 | 35 |
Source: L. Cornelissen. 2021. “Religiosity in Canada and its evolution from 1985 to 2019.” Insights on Canadian Society. October. Statistics Canada Catalogue no. 75-006-X; Statistics Canada.
- Date modified: