
The overqualification of French and English-speaking university graduates working in the Montréal census metropolitan area, 2016

Archived Content
Information identified as archived is provided for reference, research or recordkeeping purposes. It is not subject to the Government of Canada Web Standards and has not been altered or updated since it was archived. Please "contact us" to request a format other than those available.
Description: The overqualification of French and English-speaking university graduates working in the Montréal census metropolitan area, 2016
The overqualification of French and English-speakingNote university graduates working in the Montréal census metropolitan area, 2016
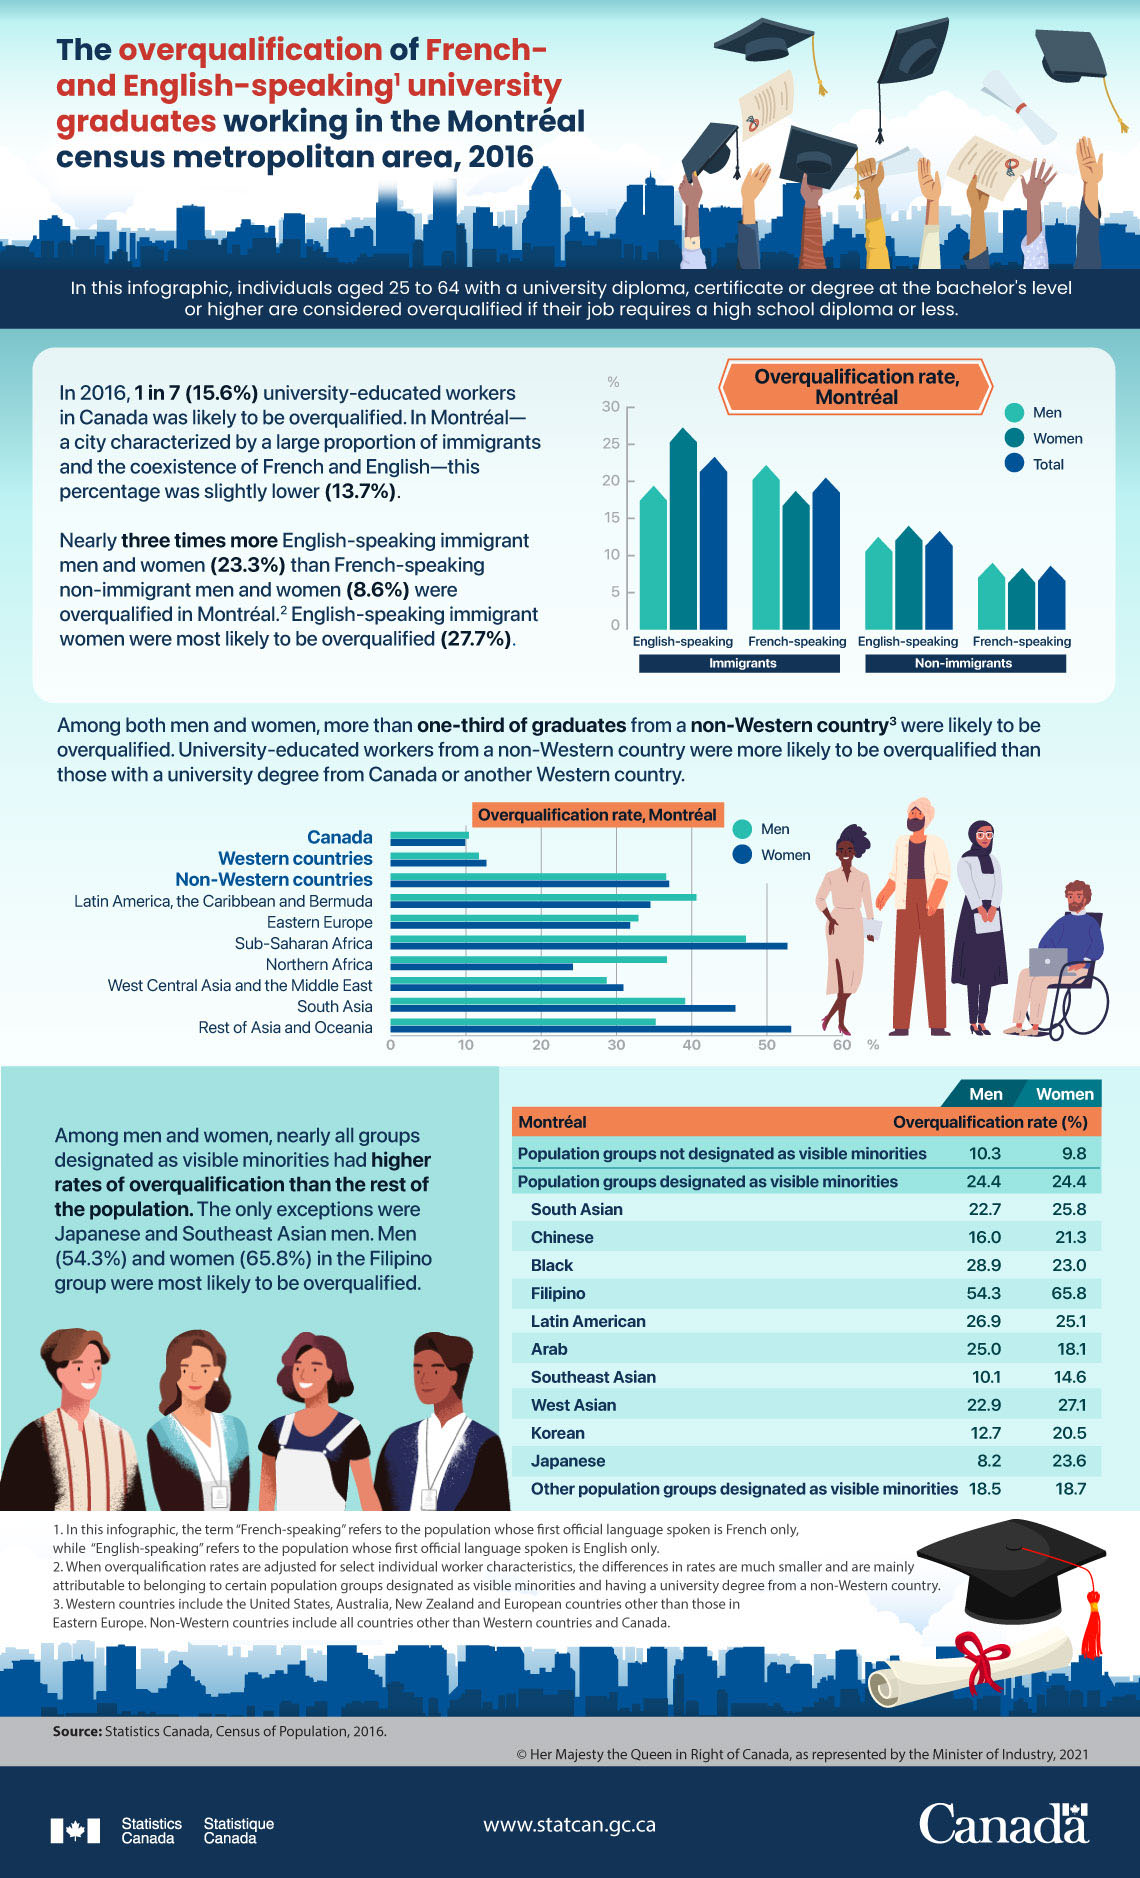
In this infographic, individuals aged 25 to 64 with a university diploma, certificate or degree at the bachelor’s level or higher are considered overqualified if their job requires a high school diploma or less.
In 2016, 1 in 7 (15.6%) university-educated workers in Canada was likely to be overqualified. In Montréal— a city characterized by a large proportion of immigrants and the coexistence of French and English—this percentage was slightly lower (13.7%).
Nearly three times more English-speaking immigrant men and women (23.3%) than French-speaking non-immigrant men and women (8.6%) were overqualified in Montréal.Note English-speaking immigrant women were most likely to be overqualified (27.7%).
Overqualification rate by first official language spoken and immigrant status, Montréal
| Total | Men | Women | |
|---|---|---|---|
| percent | |||
| English-speaking immigrants | 23.3 | 19.4 | 27.7 |
| French-speaking immigrants | 20.5 | 22.2 | 18.7 |
| English-speaking non-immigrants | 13.3 | 12.5 | 14.0 |
| French-speaking non-immigrants | 8.6 | 9.0 | 8.3 |
Among both men and women, more than one-third of graduates from a non-Western countryNote were likely to be overqualified. University-educated workers from a non-Western country were more likely to be overqualified than those with a university degree from Canada or another Western country.
Overqualification rate by place where the highest certificate, diploma or degree was obtained, Montréal
| Men | Women | |
|---|---|---|
| percent | ||
| Canada | 10.4 | 9.9 |
| Western countries | 11.7 | 12.7 |
| Non-Western countries | 36.6 | 37.0 |
| Latin America, the Caribbean and Bermuda | 40.6 | 34.5 |
| Eastern Europe | 32.9 | 31.8 |
| Sub-Saharan Africa | 47.2 | 52.7 |
| Northern Africa | 36.7 | 24.2 |
| West Central Asia and the Middle East | 28.7 | 30.9 |
| South Asia | 39.1 | 45.8 |
| Rest of Asia and Oceania | 35.2 | 53.2 |
Among men and women, nearly all population groups designated as visible minorities had higher rates of overqualification than the rest of the population. The only exceptions were Japanese and Southeast Asian men. Men (54.3%) and women (65.8%) in the Filipino group were most likely to be overqualified.
Overqualification rates by population groups designated as visible minorities, Montréal
| Men | Women | |
|---|---|---|
| percent | ||
| Montréal | ||
| Population groups not designated as visible minorities | 10.3 | 9.8 |
| Population groups designated as visible minorities | 24.4 | 24.4 |
| South Asian | 22.7 | 25.8 |
| Chinese | 16.0 | 21.3 |
| Black | 28.9 | 23.0 |
| Filipino | 54.3 | 65.8 |
| Latin American | 26.9 | 25.1 |
| Arab | 25.0 | 18.1 |
| Southeast Asian | 10.1 | 14.6 |
| West Asian | 22.9 | 27.1 |
| Korean | 12.7 | 20.5 |
| Japanese | 8.2 | 23.6 |
| Other population groups designated as visible minorities | 18.5 | 18.7 |
Source: Statistics Canada, Census of Population, 2016.
- Date modified: