
Heard on the Radio and seen on TV: Radio and TV Broadcasting, 2020

Archived Content
Information identified as archived is provided for reference, research or recordkeeping purposes. It is not subject to the Government of Canada Web Standards and has not been altered or updated since it was archived. Please "contact us" to request a format other than those available.
Description: Heard on the Radio and seen on TV: Radio and TV Broadcasting, 2020
Heard on the Radio and seen on TV: Radio and TV Broadcasting, 2020
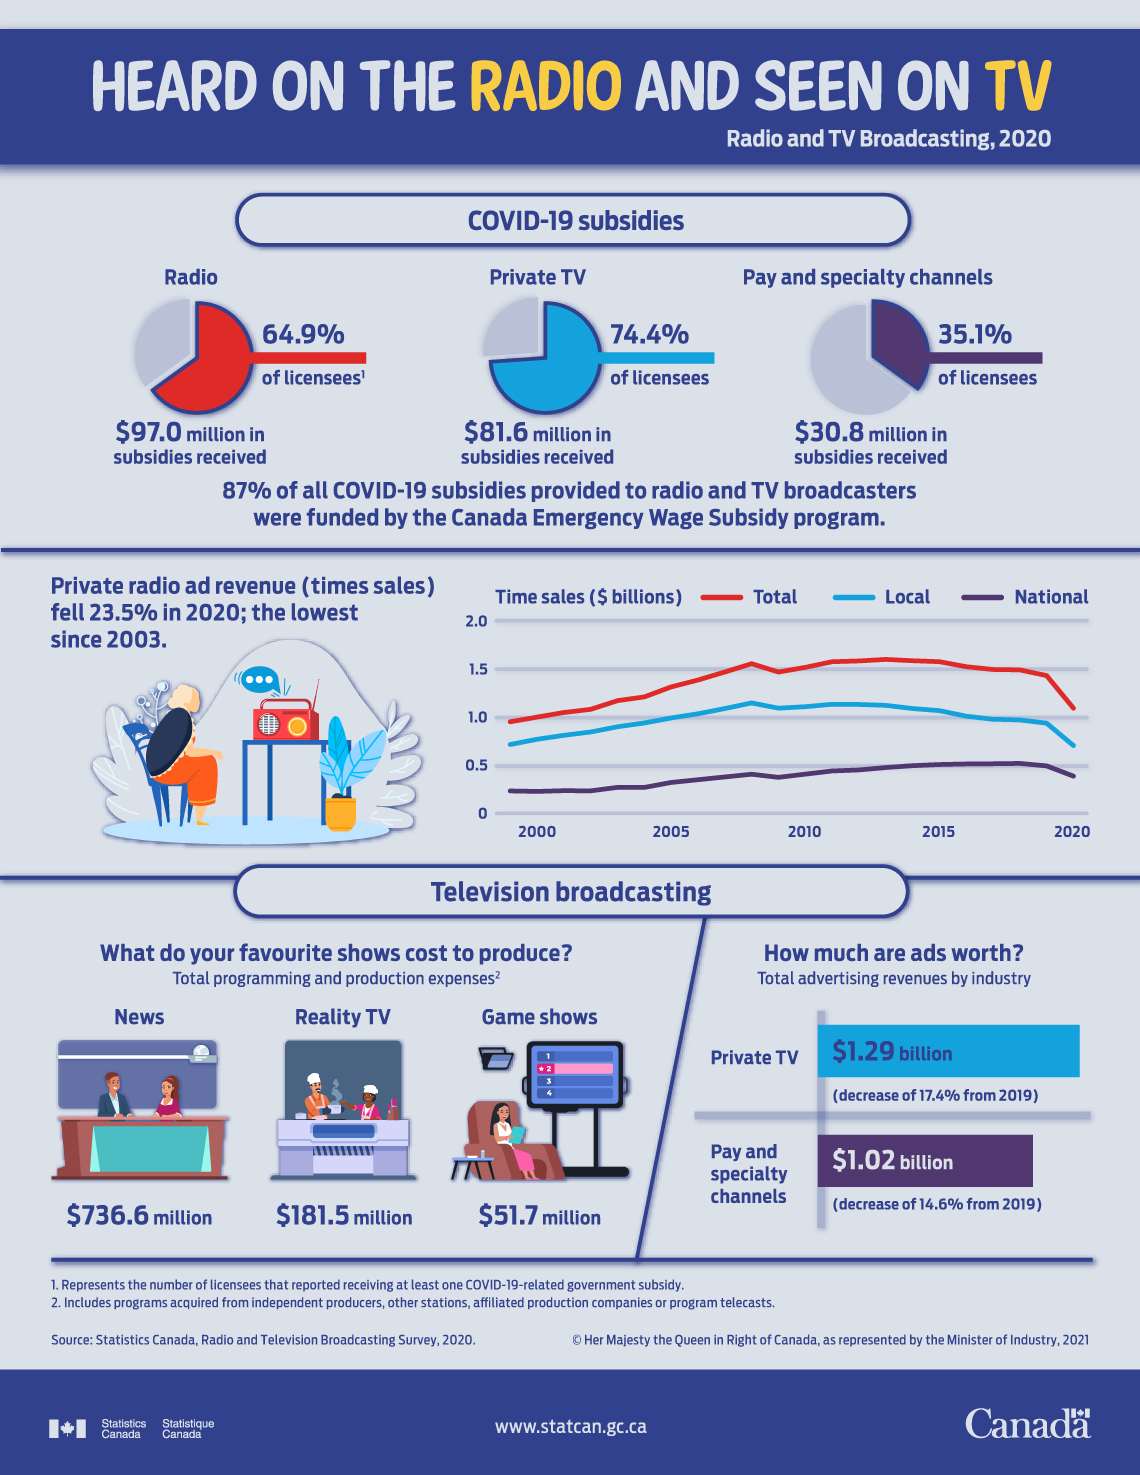
COVID-19 subsidies
| Industry | Percentage of licensees to have reported receiving at least one COVID-19-related government subsidyStatistics related to COVID-19 subsidies received Note 1 | Dollars (x1,000,000) in subsidies received |
|---|---|---|
| Radio | 64.9 | 97 |
| Private TV | 74.4 | 81.6 |
| Pay and specialty channels | 35.1 | 30.8 |
|
||
87% of all COVID-19 subsidies provided to radio and TV broadcasters were funded by the Canada Emergency Wage Subsidy program.
Private radio ad revenue (times sales) fell 23.5% in 2020; the lowest since 2003.
| Year | Local Time Sales | National Time Sales | Total Time Sales |
|---|---|---|---|
| dollars (x 1,000,000,000) | |||
| 1999 | 0.72 | 0.23 | 0.95 |
| 2000 | 0.77 | 0.23 | 1.00 |
| 2001 | 0.81 | 0.24 | 1.05 |
| 2002 | 0.85 | 0.24 | 1.08 |
| 2003 | 0.90 | 0.27 | 1.17 |
| 2004 | 0.94 | 0.27 | 1.21 |
| 2005 | 0.99 | 0.32 | 1.32 |
| 2006 | 1.04 | 0.35 | 1.39 |
| 2007 | 1.09 | 0.38 | 1.47 |
| 2008 | 1.15 | 0.41 | 1.56 |
| 2009 | 1.10 | 0.38 | 1.47 |
| 2010 | 1.11 | 0.41 | 1.52 |
| 2011 | 1.14 | 0.44 | 1.58 |
| 2012 | 1.13 | 0.45 | 1.59 |
| 2013 | 1.13 | 0.48 | 1.60 |
| 2014 | 1.09 | 0.50 | 1.59 |
| 2015 | 1.07 | 0.51 | 1.58 |
| 2016 | 1.01 | 0.52 | 1.53 |
| 2017 | 0.98 | 0.52 | 1.50 |
| 2018 | 0.97 | 0.52 | 1.50 |
| 2019 | 0.94 | 0.50 | 1.44 |
| 2020 | 0.71 | 0.39 | 1.10 |
What do your favourite shows cost to produce?
| Category | Dollars (x1,000,000) |
|---|---|
| News | 736.6 |
| Reality TV | 181.5 |
| Game shows | 51.7 |
|
|
How much are ads worth?
| Industry | Dollars (x1,000,000,000) |
|---|---|
| Private TV | 1.29 |
| Pay and specialty TV | 1.02 |
Source: Radio and Television Broadcasting Survey, 2020.
- Date modified: