Co-operatives in Canada, 2019
Archived Content
Information identified as archived is provided for reference, research or recordkeeping purposes. It is not subject to the Government of Canada Web Standards and has not been altered or updated since it was archived. Please "contact us" to request a format other than those available.

Description: Co-operatives in Canada, 2019
Co-operatives in Canada, 2019
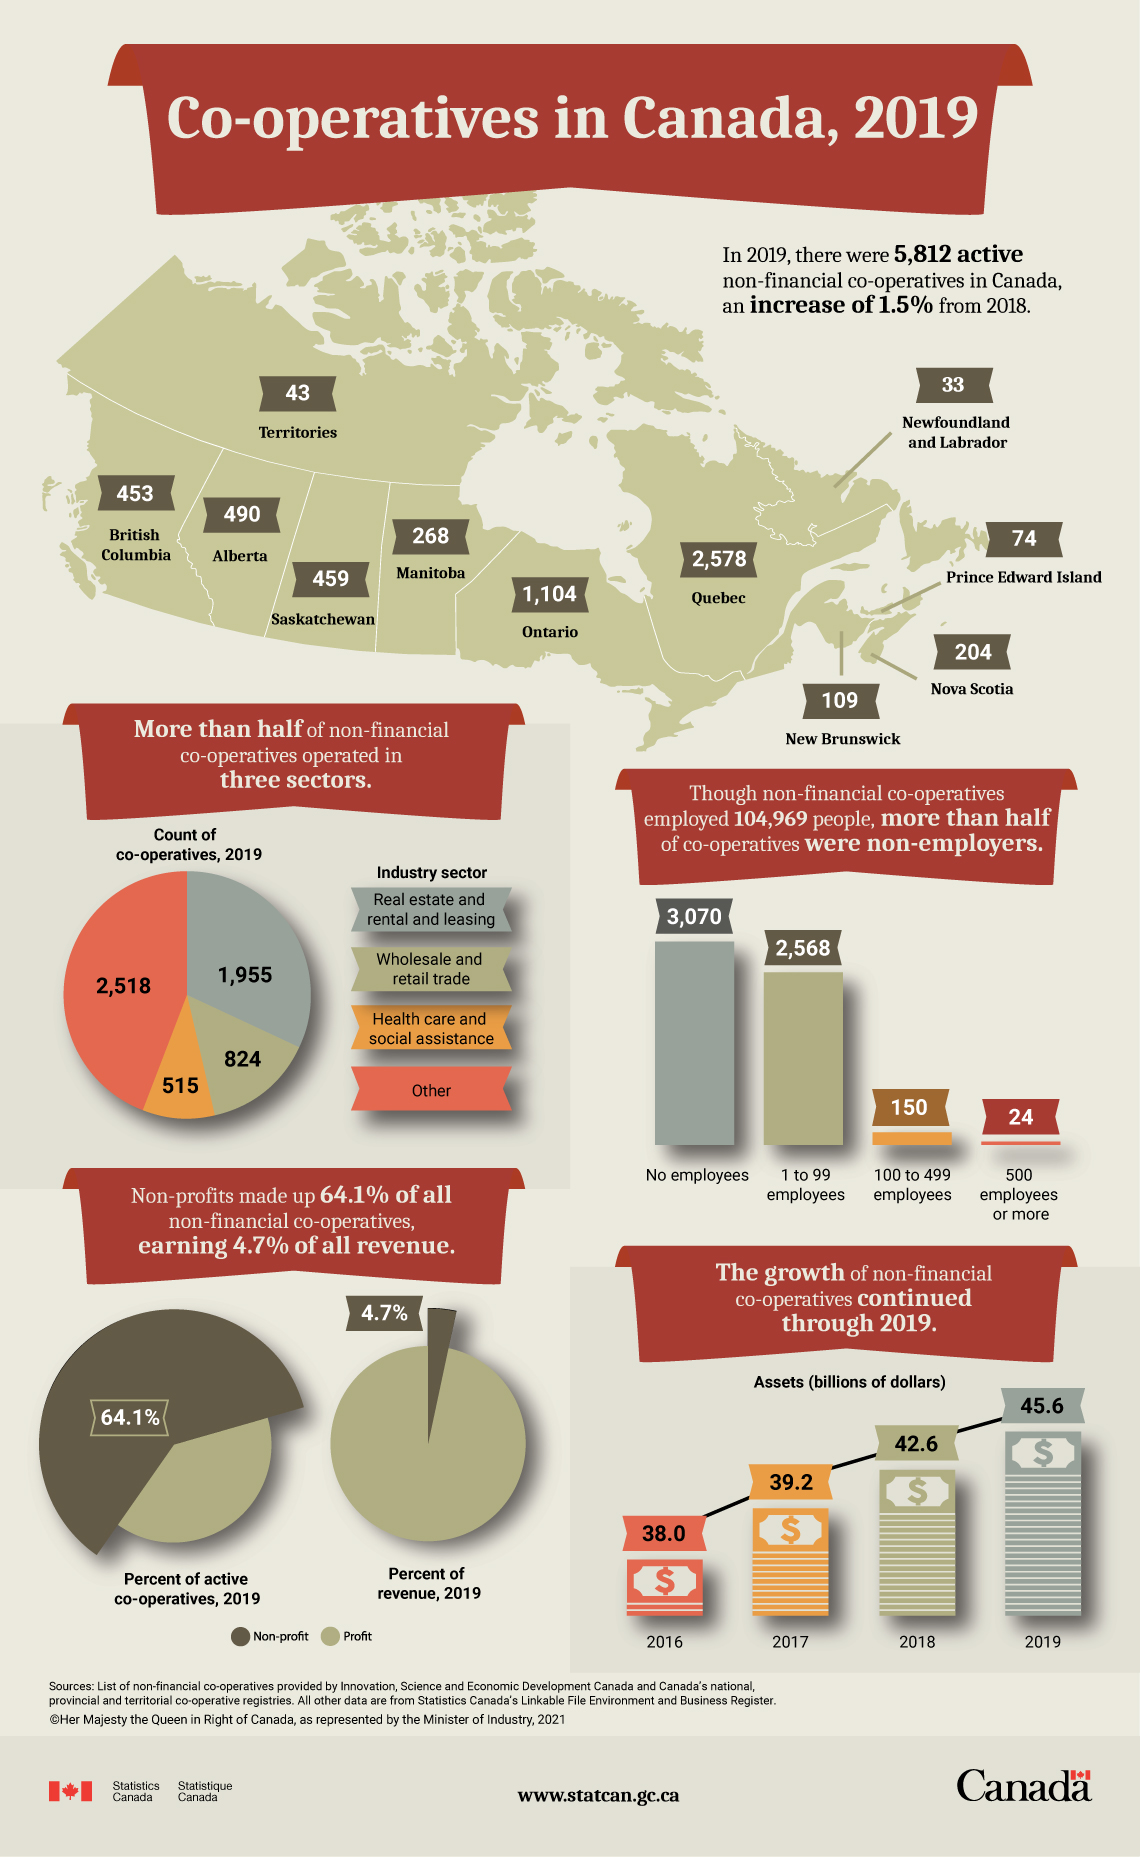
In 2019, there were 5,812 active, non-financial co-operatives in Canada, an increase of 1.5% from 2018.
| Region | Count of active cooperatives, 2019 |
|---|---|
| Alberta | 490 |
| British Columbia | 453 |
| Manitoba | 268 |
| New Brunswick | 109 |
| Newfoundland and Labrador | 33 |
| Nova Scotia | 204 |
| Ontario | 1,104 |
| Prince Edward Island | 74 |
| Quebec | 2,578 |
| Saskatchewan | 459 |
| Territories | 43 |
More than half of non-financial co-operatives operated in three sectors.
| Industry sector | Count of co-operatives, 2019 |
|---|---|
| Real estate and rental and leasing | 1,955 (33.6%) |
| Wholesale and retail trade | 824 (14.2%) |
| Health care and social assistance | 515 (8.8%) |
| Other | 2, 518 (43.3%) |
Though non-financial co-operatives employed 104,969 people, more than half of co-operatives were non-employers.
| Employment size group | Count of active cooperatives, 2019 |
|---|---|
| No employees | 3,070 |
| 1- 99 employees | 2,568 |
| 100 -499 employees | 150 |
| 500 employees or more | 24 |
Non-profits made up 64.1% of all non-financial co-operatives, earning 4.7% of all revenue.
| Non-profit status | Percent of active cooperatives, 2019 | Percent of revenue, 2019 |
|---|---|---|
| Non-profit | 64.10% | 4.70% |
The growth of non-financial co-operatives continued through 2019.
| 2016 | 2017 | 2018 | 2019 | |
|---|---|---|---|---|
| Assets (billions of dollars) | 38.0 | 39.2 | 42.6 | 45.6 |
Sources: List of non-financial co-operatives provided by Innovation, Science and Economic Development Canada and Canada’s national, provincial and territorial co-operative registries. All other data are from Statistics Canada’s Linkable File Environment and Business Register.
- Date modified:
