
Income of Canadians, 2019

Archived Content
Information identified as archived is provided for reference, research or recordkeeping purposes. It is not subject to the Government of Canada Web Standards and has not been altered or updated since it was archived. Please "contact us" to request a format other than those available.
Release date: March 23, 2021
Description: Income of Canadians, 2019
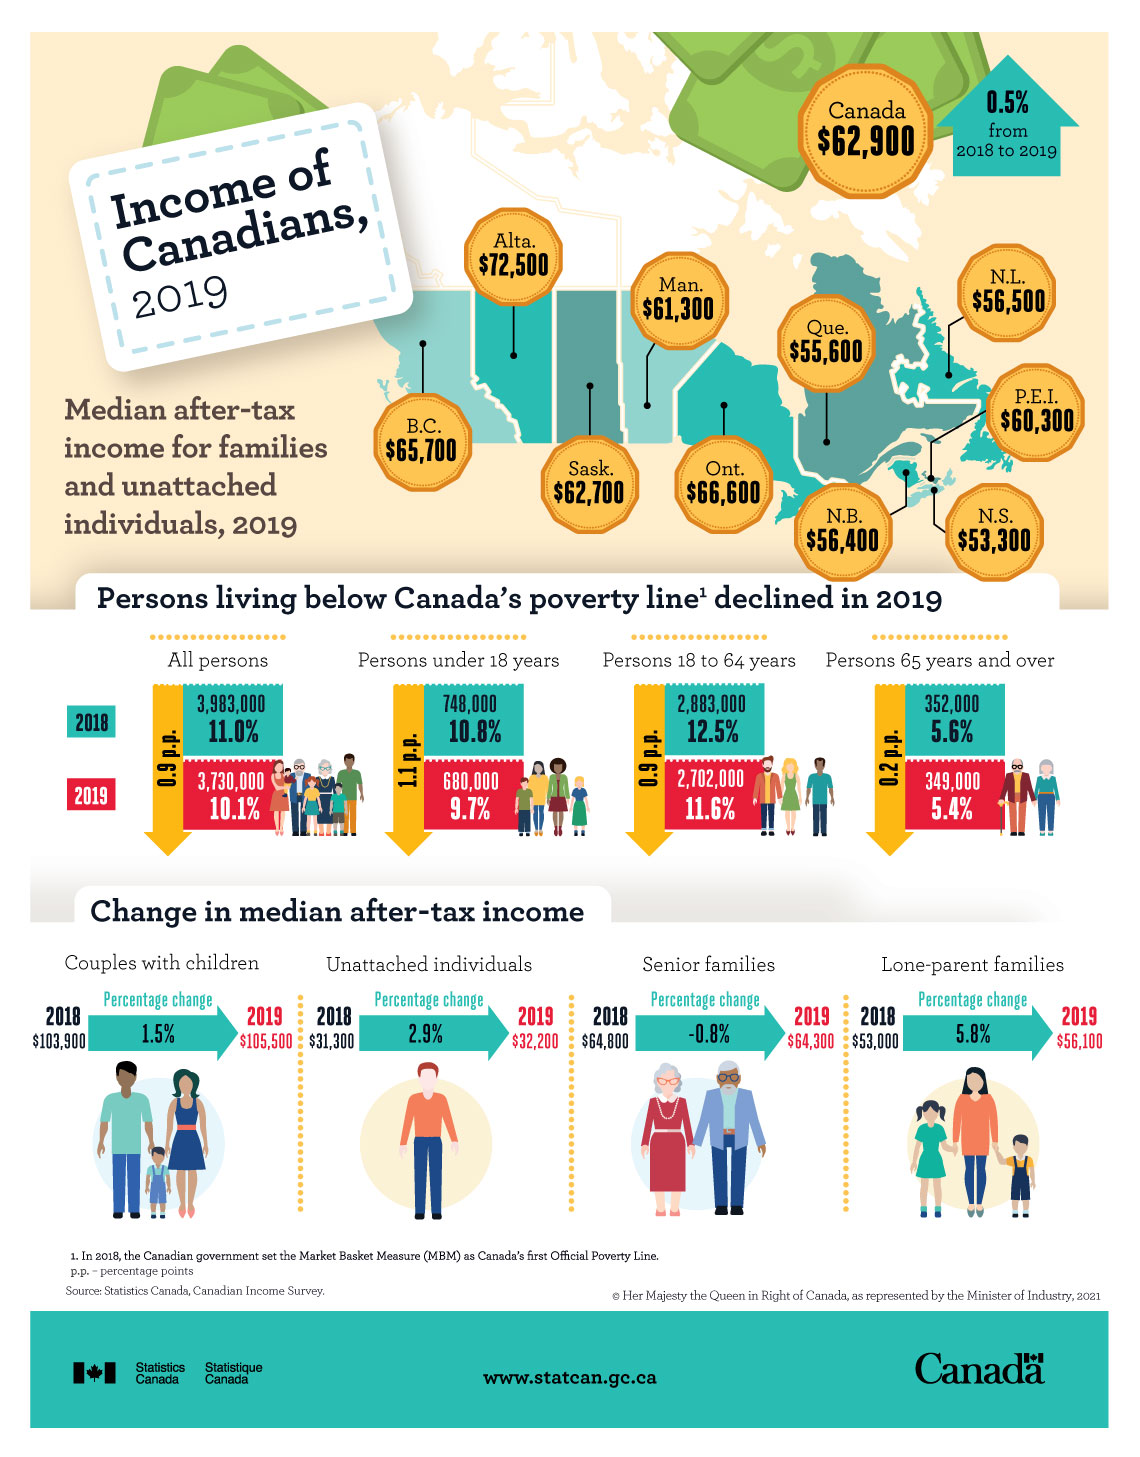
Income of Canadians, 2019
| Geography | Median after-tax income in dollars |
|---|---|
| Canada | 62,900 |
| Newfoundland and Labrador | 56,500 |
| Prince Edward Island | 60,300 |
| Nova Scotia | 53,300 |
| New Brunswick | 56,400 |
| Quebec | 55,600 |
| Ontario | 66,600 |
| Manitoba | 61,300 |
| Saskatchewan | 62,700 |
| Alberta | 72,500 |
| British Columbia | 65,700 |
A 0.5% increase from 2018 to 2019 in Canada
| Number of persons in 2019 | Number of persons in 2018 | Percentage in 2019 | Percentage in 2018 | Percentage point decrease | |
|---|---|---|---|---|---|
| All persons | 3,730,000 | 3,983,000 | 10.1% | 11.0% | 0.9 p.p. |
| Persons under 18 years | 680,000 | 748,000 | 9.7% | 10.8% | 1.1 p.p. |
| Persons 18 to 64 years | 2,702,000 | 2,883,000 | 11.6% | 12.5% | 0.9 p.p. |
| Persons 65 years and over | 349,000 | 352,000 | 5.4% | 5.6% | 0.2 p.p. |
| Number of persons in 2019 | Number of persons in 2018 | Percentage change from 2018 to 2019 | |
|---|---|---|---|
| Couples with children | 105,500 | 103,900 | 1.5% |
| Unattached individuals | 32,200 | 31,300 | 2.9% |
| Senior families | 64,300 | 64,800 | -0.8% |
| Lone-parent families | 56,100 | 53,000 | 5.8% |
p.p. – percentage points
Source: Canadian Income Survey.
- Date modified: