
Earnings and mobility of journeypersons in Canada, 2018

Archived Content
Information identified as archived is provided for reference, research or recordkeeping purposes. It is not subject to the Government of Canada Web Standards and has not been altered or updated since it was archived. Please "contact us" to request a format other than those available.
Release date: March 10, 2021
Description: Earnings and mobility of journeypersons in Canada, 2018
Earnings and mobility of journeypersons in Canada, 2018
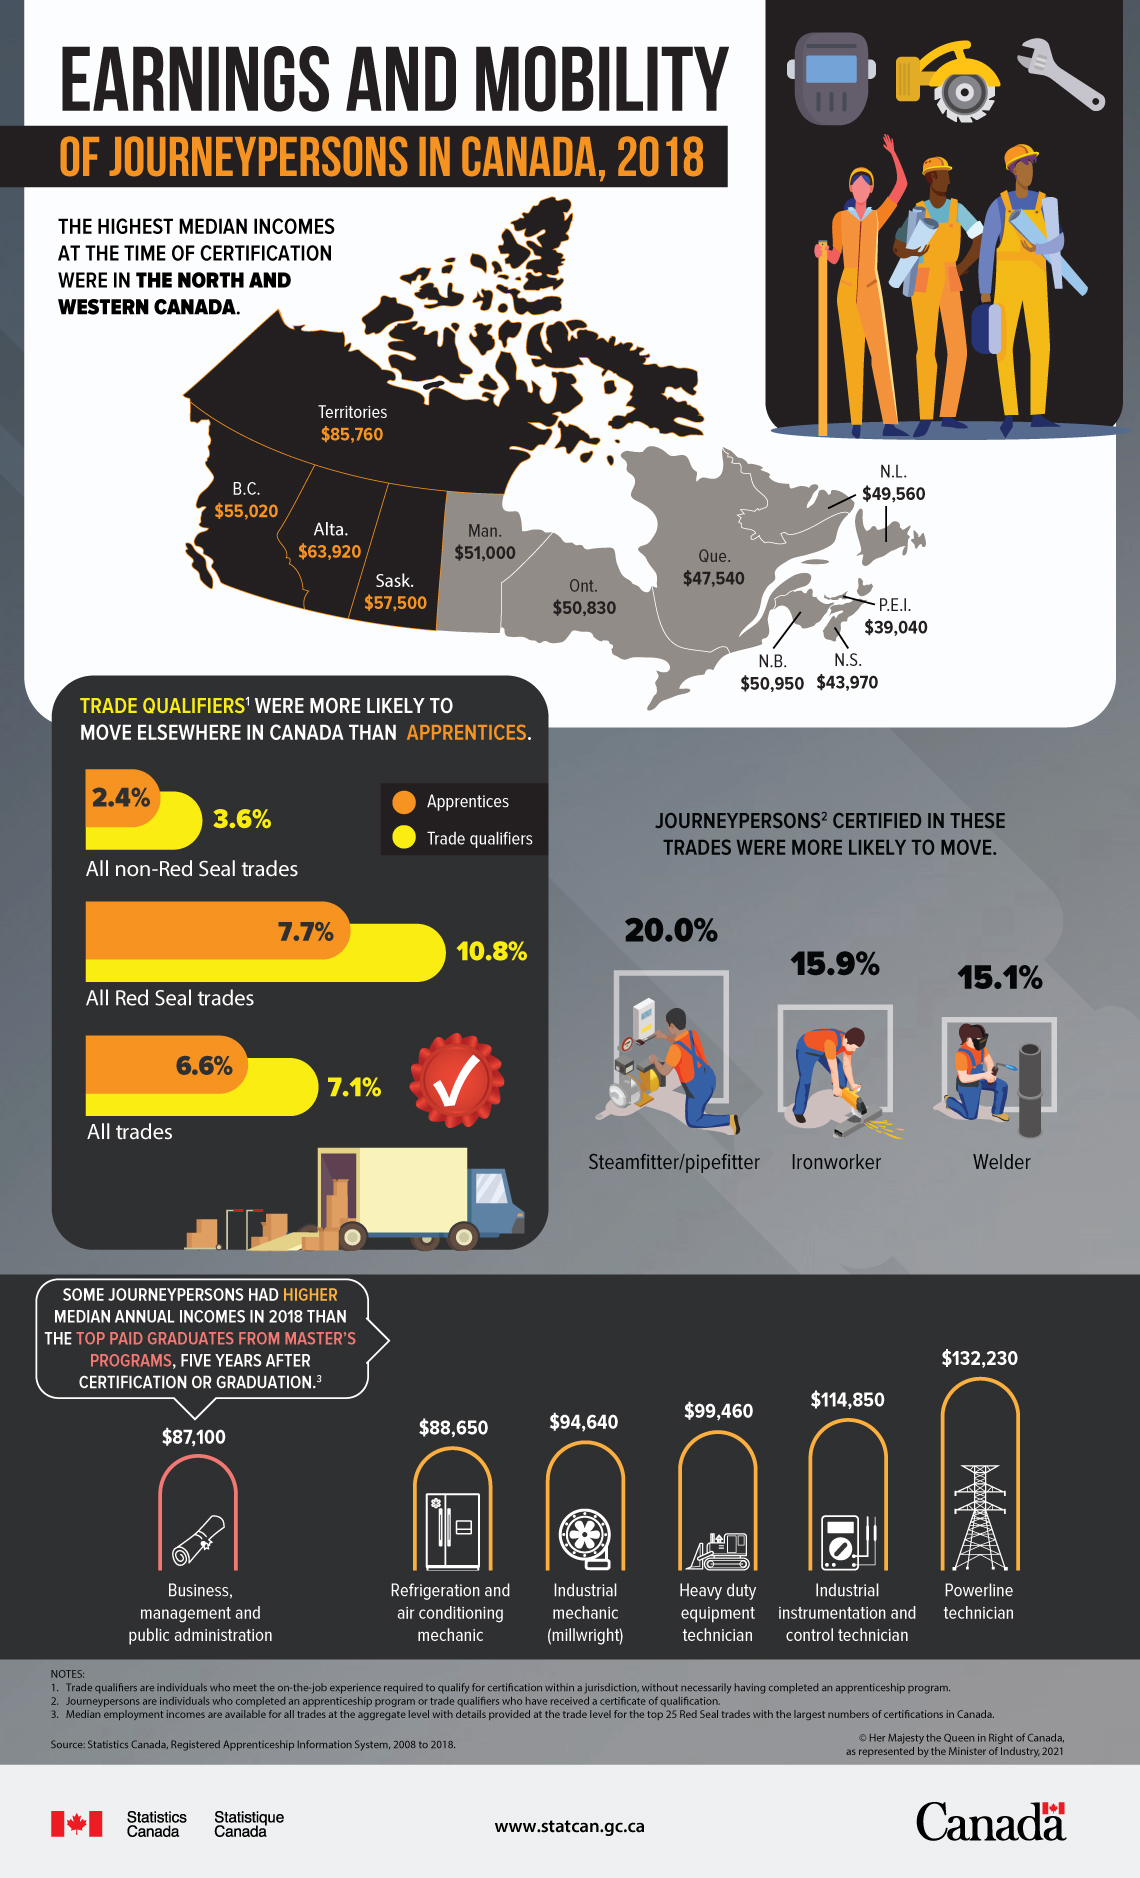
The highest median incomes at the time of certification were in the North and Western Canada.
| Median incomes in 2018, at the time of certification | |
|---|---|
| dollars | |
| Newfoundland and Labrador | 49,560 |
| Prince Edward Island | 39,040 |
| Nova Scotia | 43,970 |
| New Brunswick | 50,950 |
| Quebec | 47,540 |
| Ontario | 50,830 |
| Manitoba | 51,000 |
| Saskatchewan | 57,500 |
| Alberta | 63,920 |
| British Columbia | 55,020 |
| Territories | 85,760 |
Trade qualifiersNote were more likely to move elsewhere in Canada than apprentices.
| Trades | Mode of certification | Total mobility, 2018 |
|---|---|---|
| percentage | ||
| All trades | Trade qualifiers | 7.1 |
| Apprentices | 6.6 | |
| All non-Red Seal trades | Trade qualifiers | 3.6 |
| Apprentices | 2.4 | |
| All Red Seal trades | Trade qualifiers | 10.8 |
| Apprentices | 7.7 |
JourneypersonsNote certified in these trades were more likely to move.
| Trade | Total mobility, 2018 |
|---|---|
| percentage | |
| Steamfitter/pipefitter | 20 |
| Ironworker | 15.9 |
| Welder | 15.1 |
Some journeypersons had higher median annual incomes in 2018 than the top paid graduates from master’s programs, five years after certification or graduationNote .
| Trade | Median incomes in 2018, five years after certification |
|---|---|
| dollars | |
| Powerline technician | 132,230 |
| Industrial instrumentation and control technician | 114,850 |
| Heavy duty equipment technician | 99,460 |
| Industrial mechanic (millwright) | 94,640 |
| Refrigeration and air conditioning mechanic | 88,650 |
| Business, management and public administration | 87,100 |
| Source: Statistics Canada, Registered Apprenticeship Information System, 2008 to 2018. | |
- Date modified: