
How Canadians spent their money in 2019

Archived Content
Information identified as archived is provided for reference, research or recordkeeping purposes. It is not subject to the Government of Canada Web Standards and has not been altered or updated since it was archived. Please "contact us" to request a format other than those available.
Description: How Canadians spent their money in 2019
How Canadians spent their money in 2019
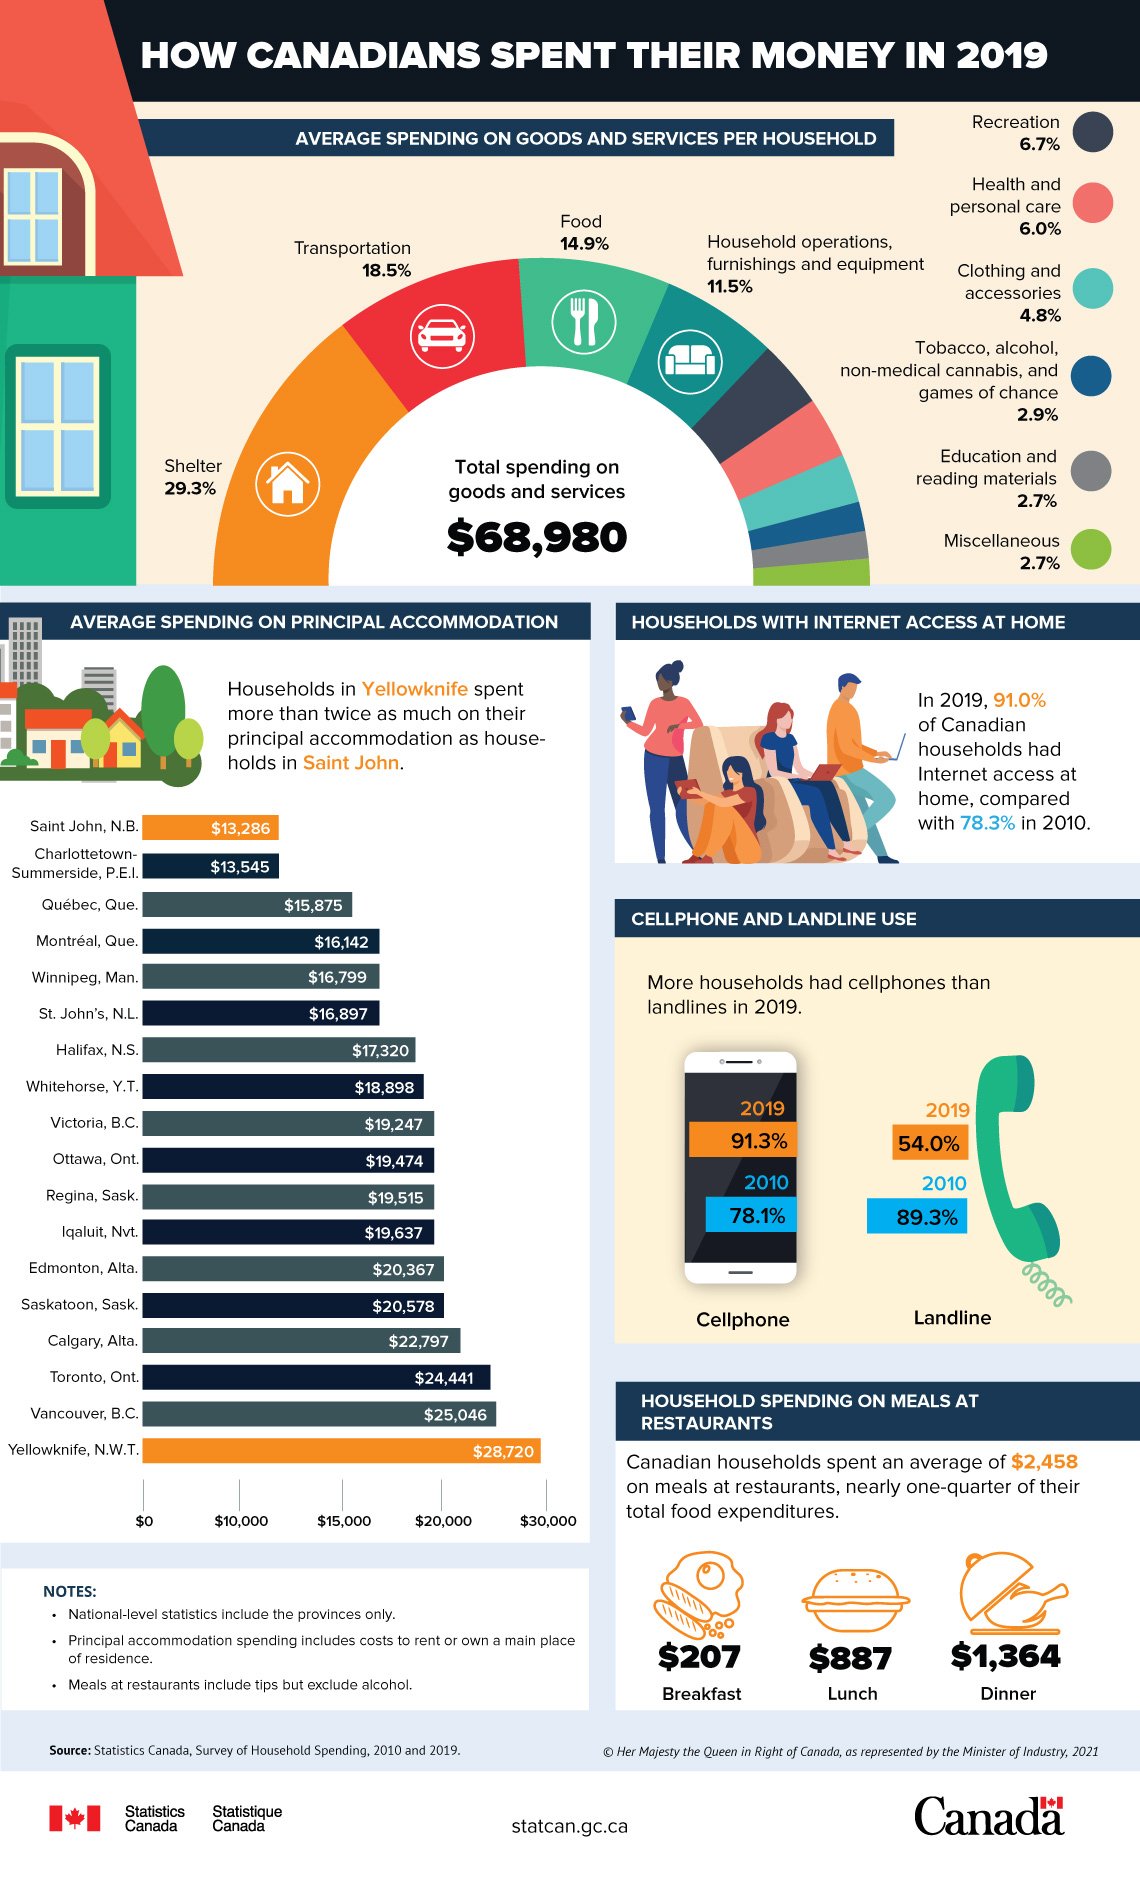
Average spending on goods and services per household
Total spending on goods and services: $68,980
| Category | Percentage |
|---|---|
| Shelter | 29.3% |
| Transportation | 18.5% |
| Food | 14.9% |
| Household operations, furnishings and equipment | 11.5% |
| Recreation | 6.7% |
| Health and personal care | 6.0% |
| Clothing and accessories | 4.8% |
| Tobacco, alcohol, non-medical cannabis, and games of chance | 2.9% |
| Education and reading materials | 2.7% |
| Miscellaneous | 2.7% |
Average spending on principal accommodation
Households in Yellowknife spent more than twice as much on their principal accommodation as households in Saint John.
| City | Average expenditure per household |
|---|---|
| Saint John, N.B. | $13,286 |
| Charlottetown-Summerside, P.E.I. | $13,545 |
| Québec, Que. | $15,875 |
| Montréal, Que. | $16,142 |
| Winnipeg, Man. | $16,799 |
| St. John’s, N.L. | $16,897 |
| Halifax, N.S. | $17,320 |
| Whitehorse, Y.T. | $18,898 |
| Victoria, B.C. | $19,247 |
| Ottawa, Ont. | $19,474 |
| Regina, Sask. | $19,515 |
| Iqaluit, Nvt. | $19,637 |
| Edmonton, Alta. | $20,367 |
| Saskatoon, Sask. | $20,578 |
| Calgary, Alta. | $22,797 |
| Toronto, Ont. | $24,441 |
| Vancouver, B.C. | $25,046 |
| Yellowknife, N.W.T. | $28,720 |
Households with Internet access at home
In 2019, 91.0% of Canadian households had Internet access at home, compared with 78.3% in 2010.
Cellphone and landline use
More households had cellphones than landlines in 2019.
| Year | Cellphone | Landline |
|---|---|---|
| 2019 | 91.3% | 54.0% |
| 2010 | 78.1% | 89.3% |
Household spending on meals at restaurants
Canadian households spent an average of $2,458 on meals at restaurants, nearly one-quarter of their total food expenditures.
- Breakfast: $207
- Lunch: $887
- Dinner: $1,364
Notes:
- National-level statistics include the provinces only.
- Principal accommodation spending includes costs to rent or own a main place of residence.
- Meals at restaurants include tips but exclude alcohol.
Source: Statistics Canada, Survey of Household Spending, 2010 and 2019.
- Date modified: