
Differences in the caregivingNote 1 arrangements of Canadians, 2018

Archived Content
Information identified as archived is provided for reference, research or recordkeeping purposes. It is not subject to the Government of Canada Web Standards and has not been altered or updated since it was archived. Please "contact us" to request a format other than those available.
Description: Differences in the caregiving arrangements of Canadians, 2018
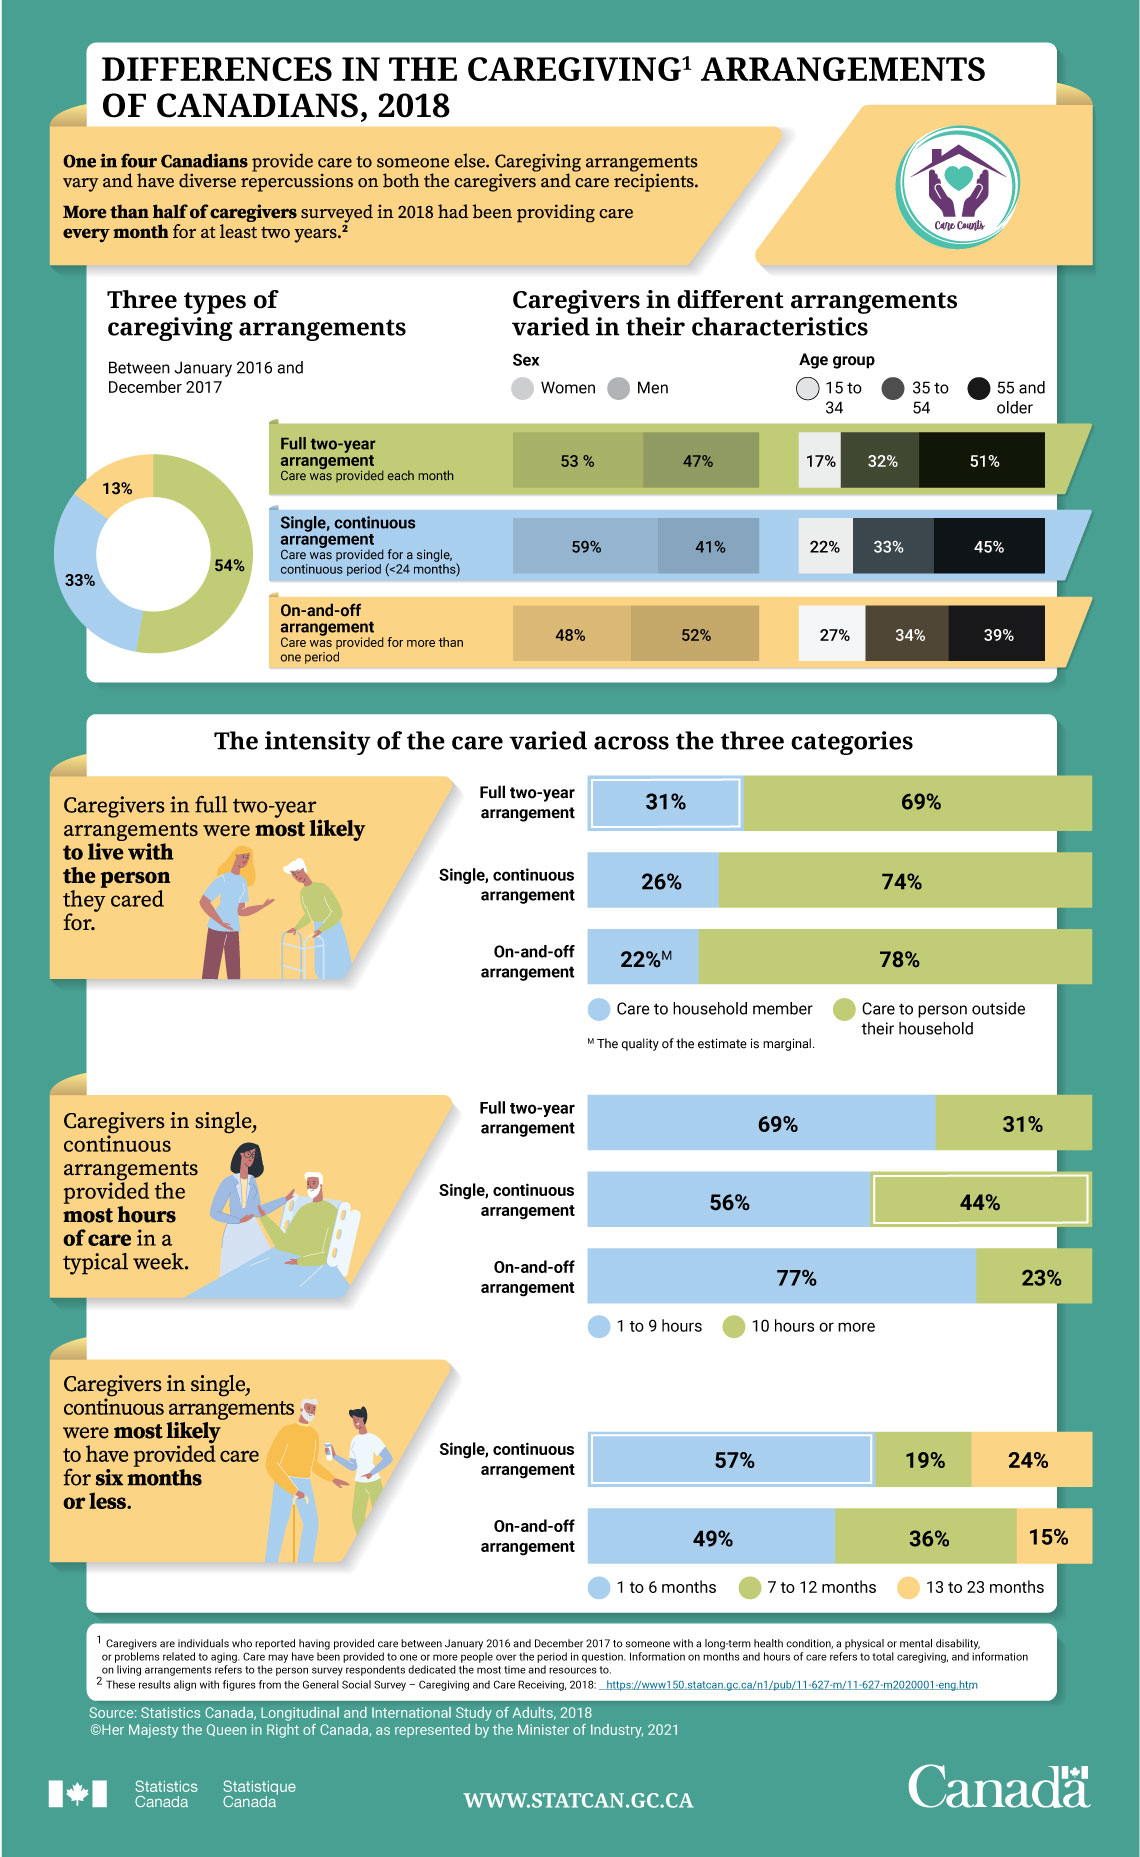
One in four Canadians provide care to someone else. Caregiving arrangements vary and have diverse repercussions on both the caregivers and care recipients.
More than half of caregivers surveyed in 2018 had been providing care every month for at least two years.Note 2
Three types of caregiving arrangements
Between January 2016 and December 2017:
| Type of arrangement | Rate |
|---|---|
| Full two-year arrangement | 54% |
| Single, continuous arrangement | 33% |
| On-and-off arrangement | 13% |
Caregivers in different arrangements varied in their characteristics:
| Sex | Age group | ||||
|---|---|---|---|---|---|
| Women | Men | 15 to 34 | 35 to 54 | 55 and older | |
| Full two-year arrangement: Care was provided each month |
53% | 47% | 17% | 32% | 51% |
| Single, continuous arrangement: Care was provided for a single, continuous period (less than 24 months) |
59% | 41% | 22% | 33% | 45% |
| On-and-off arrangement: Care was provided for more than one period |
48% | 52% | 27% | 34% | 39% |
The intensity of the care varied across the three categories:
Caregivers in full two-year arrangements were most likely to live with the person they care for
| Care to household member | Care to person outside their household | |
|---|---|---|
| Full two-year arrangement | 31% | 69% |
| Single, continuous arrangement | 26% | 74% |
| On-and-off arrangement | 22%Note M: The quality of the estimate is marginal. | 78% |
| M The quality of the estimate is marginal. | ||
Caregivers in single, continuous arrangements provided the most hours of care in a typical week
| 1 to 9 hours | 10 hours or more | |
|---|---|---|
| Full two-year arrangement | 69% | 31% |
| Single, continuous arrangement | 56% | 44% |
| On-and-off arrangement | 77% | 23% |
Caregivers in single, continuous arrangements were most likely to have provided care for six months or less
| 1 to 6 months | 7 to 12 months | 13 to 23 months | |
|---|---|---|---|
| Single, continuous arrangement | 57% | 19% | 24% |
| On-and-off arrangement | 49% | 36% | 15% |
Source : Statistics Canada, Longitudinal International Study of Adults, 2018
- Date modified: